I.
Introduction
S
INCE the turn of the Century, researchers have been studyingclustering methods and comparing them from different perspectives.
These algorithms were the core of an emerging data mining discipline, which would soon explode along with the popularity of big data
approaches in all fields. And when these ideas were applied to digital education, the field of Learning Analytics was born.
But the core of these approaches is still the use of adequate clustering algorithms for each scenario, and this problem has received a fair share of attention. Berkhin contrasted theoretically different algorithms [1], and indicated how to perform the most typical evaluations, data preparation and measurements. In [2], the authors studied 216 articles written between 2000 and 2011, classifying the literature in three axes (knowledge types, analysis types, and architecture types) and exploring the different context where such techniques may be used. Remarkably, the study highlighted the potential applications of data mining techniques in social sciences, psychology, cognitive sciences and human behavior, which is very relevant for this specific work. In turn, other studies such as [3] provided solid grounds for defining and scoping clustering, discussing aspects such as variable selection and similarity measurements, and provided a theoretical foundation of grouping methods and applications. Other authors have studied the theoretical limitations and potential pitfalls of these techniques [4].
All in all, the theoretical foundation of clustering algorithms is solid and has been the object of detailed studies. In terms of experimental analysis, we can find publications as early as in the 80s. In [5] the
author proposed specific analysis methods, and also studied the performance impact of different perturbations. In [6] the authors compared five grouping algorithms and used four different supervised automatic learning algorithms to analyze their performance. In [7] three algorithms were measured with four cluster validation indexes, using synthetic and real datasets. Other relevant works have conducted formal tests to determine the most appropriate data mining algorithms for specific fields such as classification [8] or text mining from RSS sources [9]. However, few experimental studies focused on analyzing performance using specifically educational datasets.
In turn, Learning Analytics (LA) research ranges from theoretical essays on the potential impact of LA in education [10] to very focused studies on how it is useful for establishing personalized feedback to improve academic performance [11]. There are also works proposing dynamic models for data analysis of educational datasets [12] or proposing the use of different statistical algorithms to rank academic performance [13]. Regarding the evolution of the state of the art, different works have studied stakeholders, benefits and challenges [14]-[15] or differentiated types of educational settings, tasks and outputs [16]. Other authors have studied specific quality indicators to assess the impact of LA in education [17] or studied in depth the foundations of LA in terms of data mining techniques [18]. All these efforts can be characterized for their use of clustering algorithms as an analysis technique, which is the focus of this work, but typically focus on one or two algorithms at most, or just in the educational and social implications, rather than focusing specifically in experimental comparison of the performance of different algorithms when applied in educational settings.
And while the challenges of small-scale and relatively clean educational datasets lie mostly on how to identify the best visualizations or practical uses of the data, the emergence of open education formats is yielding increasingly complex and noisy datasets, imposing
non-Keywords
Clustering Methods, Computer Languages, Data Analysis, Engineering Students, Performance Evaluation, Unsupervised Learning.Abstract
Learning Analytics is becoming a key tool for the analysis and improvement of digital education processes, and its potential benefit grows with the size of the student cohorts generating data. In the context of Open Education, the potentially massive student cohorts and the global audience represent a great opportunity for significant analyses and breakthroughs in the field of learning analytics. However, these potentially huge datasets require proper analysis techniques, and different algorithms, tools and approaches may perform better in this specific context. In this work, we compare different clustering algorithms using an educational dataset. We start by identifying the most relevant algorithms in Learning Analytics and benchmark them to determine, according to internal validation and stability measurements, which algorithms perform better. We analyzed seven algorithms, and determined that K-means and PAM were the best performers among partition algorithms, and DIANA was the best performer among hierarchical algorithms.
Comparison of Clustering Algorithms for Learning
Analytics with Educational Datasets
Alvaro Martínez Navarro
1, Pablo Moreno-Ger
2*
1
Departamento de Ingeniería de Sistemas, Universidad Mariana, Pasto (Colombia)
2
Escuela Superior de Ingeniería y Tecnología, Universidad Internacional de La Rioja, Logroño (España)
Received 3 November 2017 | Accepted 22 January 2018 | Published 9 February 2018
* Corresponding author.
E-mail addresses: [email protected] (Alvaro Martínez Navarro), [email protected] (Pablo Moreno-Ger).
trivial burdens on the data mining algorithms applied to make sense of how students are interacting with these open materials.
At the crossroads of these lines of research, our goal is to contribute experimental validation of the performance of different clustering techniques when specifically applied to educational datasets, thus providing a more solid foundation for further works focusing on practical aspects rather than back-office performance.
To achieve this goal, we have conducted a practical experiment using a real-world dataset provided by Universidad Mariana in Colombia, benchmarking different algorithms and configurations in terms of internal validations and stability measurements.
II.
Materials and Methods
The experimental design is quite straightforward. We started with a literature review to select a representative set of clustering algorithms. Then, we organized a workflow for testing each algorithm and selected specific measurements for comparison, and finally we applied this workflow to all algorithms targeting an educational dataset provided by Universidad Mariana. This section details each of these steps.
A. Selecting the Algorithms to Be Benchmarked
The specific selection of algorithms was conducted after performing a literature review, with a heavy influence of related works from other fields ([1], [4], [16]) and trying to provide a wide perspective of the potential approaches.
The final selection of algorithms is summarized in Table I.
B. Experimental Platform
We employed different platforms and tools to create our experimental pipeline. We started with raw and cross-referenced data available on an Oracle 10g database server. We extracted different listings and used Microsoft Excel to review, perform basic cleaning (including anonymization) and saving as CSV (comma-separated values) files.
All statistical analyses and clustering algorithms were applied using the opensource platform R, for which we created our test scripts using the R Studio graphical interface. The platform was also used to create the different visualizations that helped in this study and that
are included in this article. In Table II we provide a summary of the different libraries that we used for the experiment.
C. Benchmarking Performance
In order to benchmark the performance of each algorithm, we focused on the facilities provided by the clValid library presented in [19] to measure internal and stability validations.
Internal validations are computed using intrinsic information from the datasets to assess the quality of the resulting clusters. We used the three main internal validation measurements offered by the validation library: connectivity (which provides a value in the [0, ∞) range where
lower is better), silhouette width (which proves values in the (-1,1) range where higher is better), and Dunn index (which provides a value
in the [0, ∞) range where higher is better).
In terms of stability measurement, we again selected the main measures from [19], all of them focused on inspecting each cluster and sequentially removing internal columns and checking whether the cluster remains valid. We employed APN (average proportion of non-overlap), AD (average distance between measurements), ADM (average distance between means) and FOM (figure of merit, focused on the average intra-cluster variance of the observations). All of them
take values in the [0, ∞) range where higher is better except APN, with
values in the [0,1] range with preferred results close to zero.
TABLE I. Algorithm Selection
NAME Description
K-means It builds the clusters with similarity measure, each cluster is represented by a centroid, which is the average of its elements. It works only with numerical data and its affected by outliers [1].
CLARA It builds the clusters without all the data, instead, sample them at random and then the centers are calculated with the PAM algorithm. It works with numerical data [1].
PAM
It is a robust version of K-means. The process of grouping is done through the search of a sequence of objects called medoids. Its main characteristic is the reduction of the average dissimilarity of the observations to its nearest observation [1].
FANNY It calculates the clustering in a diffuse way in a number K clusters.
Hierarchical
It uses previous clusters to form the new clusters. It’s of two types: divisive (top-down) and agglomerative (bottom-up). It can be applied with any type of variables and it is not necessary to establish a priori the number of clusters to be formed. It is sensitive to noise and outliers.
AGNES Hierarchical algorithm of agglomerative type, it uses the Euclidean distance as similarity measure.
DIANA Hierarchical algorithm of divisive type, it uses the Euclidean distance as similarity measure.
TABLE II. R Libraries
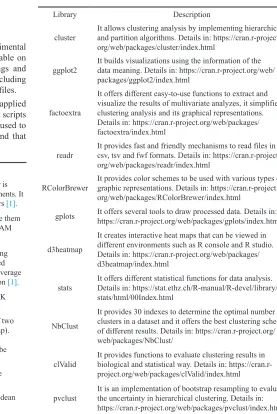
Library Description
cluster It allows clustering analysis by implementing hierarchical and partition algorithms. Details in: https://cran.r-project. org/web/packages/cluster/index.html
ggplot2 It builds visualizations using the information of the data meaning. Details in: https://cran.r-project.org/web/ packages/ggplot2/index.html
factoextra
It offers different easy-to-use functions to extract and visualize the results of multivariate analyzes, it simplifies clustering analysis and its graphical representations. Details in: https://cran.r-project.org/web/packages/ factoextra/index.html
readr It provides fast and friendly mechanisms to read files in csv, tsv and fwf formats. Details in: https://cran.r-project. org/web/packages/readr/index.html
RColorBrewer It provides color schemes to be used with various types of graphic representations. Details in: https://cran.r-project. org/web/packages/RColorBrewer/index.html
gplots It offers several tools to draw processed data. Details in: https://cran.r-project.org/web/packages/gplots/index.html
d3heatmap
It creates interactive heat maps that can be viewed in different environments such as R console and R studio. Details in: https://cran.r-project.org/web/packages/ d3heatmap/index.html
stats It offers different statistical functions for data analysis. Details in: https://stat.ethz.ch/R-manual/R-devel/library/ stats/html/00Index.html
NbClust
It provides 30 indexes to determine the optimal number of clusters in a dataset and it offers the best clustering scheme of different results. Details in: https://cran.r-project.org/ web/packages/NbClust/
clValid It provides functions to evaluate clustering results in biological and statistical way. Details in: https://cran.r-project.org/web/packages/clValid/index.html
D. Preparing the Dataset
One particularity of Learning Analytics approaches is the focus on inspecting academic data generated at specific institutions for specific courses, since comparisons across platforms, institutions and even individual courses may be challenging due to significant differences in usage patterns [10]
We therefore chose to focus on a specific student profile within the host institution: Computer Engineering students enrolled in the first semester with the 2010-2016 timeframe (7 years).
The datasets were constructed with the main measurement of the average grade of all courses in the semester. The data was extracted from the host University’s database system, using specific queries and basic data management (e.g. transposing) to create rows representing each specific student’s aggregated data.
The scripts were also prepared to provide anonymization when required and removed non-essential personal data (e.g. personal addresses or phone numbers).
All the relevant R scripts as well as the dataset can be downloaded from https://goo.gl/oNHm2R.
III.
Results
A. Pre-processing
The first step in our test pipeline was the conduction of relatively simple cleanup tasks, mostly focused on removing instances where some grades were missing (this may happen either due to an administrative issue or an error in the grade reporting system).
After this step, we analyzed for each variable different comparison statistics, averaging their maximum, minimum, average and mean values. We determined that their standard deviation and variances were minimal, therefore making it possible to work directly with the original data without requiring a previous normalization.
We also analyzed the dataset to validate its clusterability, using two approaches: first, we used the Hopkins statistic method from [20], with a resulting value of 0.2036606 (<0.5) which shows that the values are potentially groupable. We also validated this notion visually, by representing the tendency of the data to be grouped. This is achieved by (1) calculating the dissimilarities between all datapoints and storing them in a dissimilarity matrix according to their Euclidean distances, (2) sorting the matrix so that similar objects are closer together and (3) displaying the matrix to check the presence of high values along the diagonal of the matrix (Fig. 1).
Fig. 1. Data clustering trend where we can observe dark blue rectangles aligned with the diagonal line, which can be interpreted as a potential clustering amenability of the data.
Therefore, we could ascertain the adequacy of our dataset for the goals of our experiment.
B. Optimal K Value
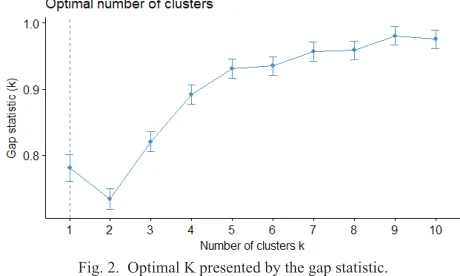
In order to determine the optimal number of clusters, we again used to separate and complementary methods. The first approach we used employed the gap stastic[21] targeting the K-means algorithm with a maximum value of K=10 and 10,000 Monte Carlo samples. The result can be observed in Fig. 2, yielding a proposal for one single cluster (or rather hinting that the data was not prone to clustering), although applying the 1-standard error criterion K=5 may also be a valid candidate.
Fig. 2. Optimal K presented by the gap statistic.
Given this partially unsatisfactory result, we also looked at the nbClust R package, which analyses 30 separate indexed to determine the optimal K. We ran this analysis for values of K in the [2,10] range, with full clustering and all indexes included. As observed in Fig. 3, this yielded an optimal number of clusters of K=3.
Fig. 3. Optimal K reported by nbClust.
C. Algorithm Execution with Optimal K Value
All seven algorithms were run on the data using K=3 in order to study their behavior and performance.
Regarding the set of partition algorithms, Fig. 4a shows the dispersion and cluster charts produce by the K-means, CLARA and PAM algorithms (all three produced the same output), while Fig. 4b shows the results for the FANNY algorithm, which displayed a significantly worse performance.
Fig. 4 a. Cluster plot for K-means, CLARA and PAM algorithms. All three yielded the same result.
Fig. 4 b. Cluster plot for the FANNY algorithm.
Fig. 5 a. Clusters silhouette plot for the K-means, CLARA and PAM algorithms. All observations are >0 with an average of 0.55.
Fig. 5 b. Clusters silhouette plot for the FANNY algorithm. In cluster 2 (cyan color) there are negative values.
We took the same approach for our selection of hierarchical algorithms. Fig. 6 show the cluster plots for the hierarchical and AGNES algorithms (which were equal) and for the DIANA algorithm (which presented issues with one of the clusters).
Fig. 6 a. Cluster plot for the hierarchical and AGNES algorithms. Both yielded the same result.
Fig. 6 b. Cluster plot for the DIANA algorithm.
Similarly to the other family, the clusters yielded by the hierarchical variants were validated through silhouette inspection, using a different visualization due to concerns with the very small cluster yielded by the DIANA algorithm.
The silhouettes can be observed in Fig. 7. The first two algorithms yielded the same result while, remarkably, the DIANA algorithm had produced three clusters, all with positive silhouette values, meaning that all values are well assigned, even if the value for cluster #3 (the small blue one in Fig. 6b) is relatively low (0.27) although the overall value is 0.54, very close to the other two algorithms.
Fig. 7 b. Clusters silhouette plot for the DIANA algorithm.
D. Algorithm Execution Doubling the Optimal K Value
While the previous observations already present some interesting insights, the decision of going with a specific K value was a concern, especially given that one of our tests suggested potential gains for relatively high K values.
We therefore repeated the process using a higher value, K=6 (doubling the previous value) in order to check both the consistency of the previous results and the effect of increasing K in general.
In Fig. 8 we can observe the performance of the clustering algorithms once we double the K value. FANNY basically maintains the same average (and poor) performance for K=3 and K=6, while the other algorithms actually decreased their performance, yielding small but significant errors in most cases. In this sense, PAM and CLARA took a significant performance hit, with 11 and 10 wrongly classified observations respectively. In turn, the classic K-means algorithm presented four negative values after increasing the K value.
Fig. 8 a. Clusters silhouette plot for K-means with K=6.
Fig. 8 b. Cluster silhouette plot for CLARA with K=6.
Fig. 8 c. Cluster silhouette plot for PAM with K=6.
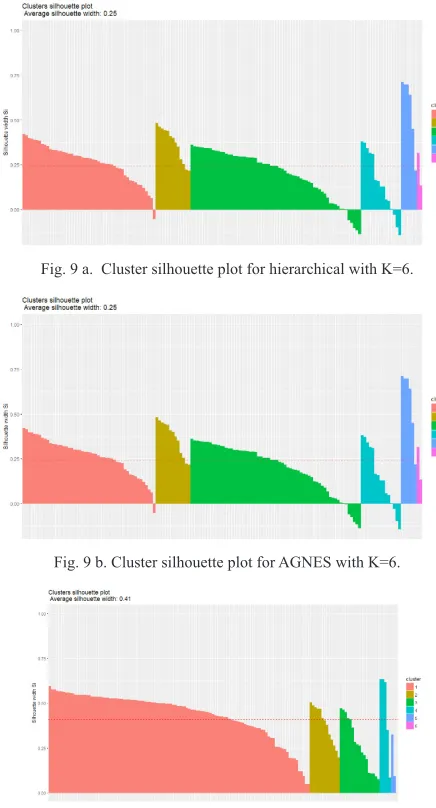
Regarding hierarchical algorithms, their cluster silhouette plots (Fig. 9) show that the hierarchical and AGNES algorithms still show the same behavior but doubling the K value impacted their performance negatively. Not only they assigned more instances incorrectly, but they also reduced the average silhouette value from 54% to 24%. In turn, the DIANA algorithm also took a performance hit, but did not experience any incorrect classifications.
Fig. 9 a. Cluster silhouette plot for hierarchical with K=6.
Fig. 9 b. Cluster silhouette plot for AGNES with K=6.
E. Internal Validation and Stability Measurement
As stated in previous section, in order to assess the performance of the different algorithms we performed a comparison using internal validation and stability measurements. Fig. 10 displays the R output with all the internal validation scores for our selection of algorithms, for varying K values from 3 to 6, while Fig. 11 displays the output for stability scores.
Fig. 10. Internal validation scores for all algorithms.
Fig. 11. Stability scores for all algorithms.
Regarding partition algorithms, for K=3, K-means, CLARA and PAM tie as the best performers, due to their lower connectivity score (5.7167), best silhouette coefficient (0.5549) and best Dunn index (0.3721). However, this tie disappeared when we increased K values, with K-means maintaining better performance while CLARA and PAM quickly degraded their numbers. In turn, the FANNY algorithm yields no output given its inability to generate measurable clusters. In terms of stability, PAM achieved the best score with K=6 for AD and FOM measurements, and also performed excellently with ADM with K=3. K-means achieved the best APN score with K=6.
Focusing on hierarchical algorithms, hierarchical achieved the best connectivity and Dunn scores for K=3 and K=5 respectively, while DIANA achieved the best score in terms of correct instance assignments when K=4. In terms of stability scores, hierarchical again displays the best scores for K=3 and K=5 for APN and ADM measurements, while DIANA achieves optimal values for AD and FOM when K=6.
IV.
Discussion
One of the most relevant (although reasonably expected) observations is that no algorithm is a clear and obvious winner across all measurements and potential K values.
In terms of internal validation, K-means, CLARA and PAM achieved the best overall scores with K=3, although CLARA and PAM experienced a worst degradation as the K value increased. However, the hierarchical and AGENS algorithms also achieve very significant Dunn scores when K=4.
If we focus on K=3 (our selected optimal value), the worst performers in connectivity were the three hierarchical algorithms, although they achieved better Dunn index scores. However, they also presented more incorrect assignments, and therefore can be considered worst performers overall.
However, as we increased the K value, partition algorithms degraded their performance quickly, while hierarchical algorithms remained more stable and actually improved some scores.
In terms of stability, again there is no single algorithm that achieves the best score in all four measurements. PAM exhibited good AP and FOM behavior at K=6, hierarchical achieved very good APN with K=5 and very good ADM with K=3.
Again, if we focus on K=3, the worst performer in terms of APN and ADM was CLARA, while DIANA and AGNES performed poorly in AD and FOM respectively.
The pattern of degradation as we increased the K value exhibited by partition algorithms was also apparent when looking at stability measurements, yielding a consistent conclusion of the better behavior of hierarchical algorithms for higher number of clusters.
The FANNY algorithm failed to produce significant clusters and was therefore deemed as poorly fit for our specific dataset.
V.
Conclusion and Future Works
Open education is bound to push the boundaries of how we analyze our educational datasets. And as the scope of our research actions Learning Analytics becomes more and more specialized, the specific underlying techniques, including the selection of a particular clustering algorithm, are bound to receive less attention than appropriate.
This study aims to provide researchers with insights into how the different algorithms exhibit different performance patterns depending on specific measurements and variation in K values, especially when the dataset is highly driven by a set of grades in different courses.
selecting the most prominent algorithms identified in the literature and analyzing them using an assortment of assessment tools and an educational dataset from a higher education institution.
Among the seven clustering algorithms selected, we measured which algorithms performed better at an experimentally determined K value (K=3) and henceforth how they changed their performance if we increased this number.
During the experimental work we highlighted different relevant observations, from which we can distil some specific insights:
• Among partition algorithms, K-means and PAM were the best performers overall. The former achieved the best results in terms of internal validation (especially as we increased the K value) while the latter performed better in terms of stability.
• Among hierarchical algorithms, DIANA and hierarchical were the best performers, with a similar variation: the former achieved better internal validation scores, while the latter achieved better stability scores.
• Student grades in the sample dataset were highly groupable, as corroborated by the Hopkins statistic, a result that we expect would be extrapolated to other educational datasets, especially in higher education, where students tend to form grade patterns with ease. In lower education levels, the breadth of topics may introduce additional noise as students may have greater affinities for specific courses. • In terms of determining the optimal K value, the Gap statistic was
not really helpful, suggesting one single cluster even though the performance of the clustering algorithms for higher K values was rapidly apparent.
• Increasing the K value improved the performance of many algorithms in most metrics, although the number of errors also increased, and this improvement should be taken in context. This work, however, also has specific limitations. Firstly, the preparation of the dataset was performed through an aggressive cleanup of the data, discarding all instances where any piece of information was missing. This resulted in a clean dataset 44% smaller than the original one. Given that this was an official dataset provided by the host University, it is to be expected to get similar noise levels in other real (non-synthetic) datasets, and better data cleanup techniques could be required. Making sure that we do not loose significant information while cleaning up data remains a significant open line of research.
In addition, most validations were performed trough different variations of Euclidean distance measurements, ignoring other approaches that may provide additional insights. This invites the potential expansion of this experiment either by including new measurements or by testing alternative educational datasets (or both).
Finally, we expect that the comparisons performed in this work will be helpful for future researchers looking into how to select the best algorithms for performing clustering analysis of educational datasets in higher education.
Further than the specific scores achieved by the different algorithms, we believe that this work adds value by identifying performance patterns that can be used as a base in future research.
Acknowledgment
This work was partially funded by Universidad Internacional de La Rioja (UNIR, http://www.unir.net) through the Research Institute for Innovation & Technology in Education (UNIR iTED, http://ited.unir. net) and the IBM-UNIR Chair on Data Science in Education.
Thanks to Universidad Mariana - Pasto - Colombia for their collaboration in this research, especially to Iván Bastidas for his help in obtaining the data for this experiment.
References
[1] P. Berkhin, “A Survey of Clustering Data Mining Techniques”, Grouping
Multidimensional Data. Springer, no. c, pp. 25–71, 2006.
[2] S. H. Liao, P. H. Chu, and P. Y. Hsiao, “Data mining techniques and applications - A decade review from 2000 to 2011”, Expert Systems with
Applications, vol. 39, no. 12, pp. 11303–11311, 2012.
[3] Q. Hen, “A Review of Clustering Algorithms as Applied in IR”, Technical
Report IUIUCLIS--1999/6+IRG, pp. 1–33, 1999.
[4] G. Sreenivasulu, S. V. Raju, and N. S. Rao, “Review of Clustering Techniques”, Proceedings of the International Conference on Data Engineering and Communication Technology Advances in Intelligent
Systems and Computing 468, pp. 523–535, 2017.
[5] G. W. Milligan and M. C. Cooper, “Methodology Review: Clustering Methods”, Applied Psychological Measurement, vol. 11, no. 4, pp. 329– 354, 1987.
[6] L. Candillier, I. Tellier, F. Torre, and O. Bousquet, “Cascade evaluation of clustering algorithm”, Springer Verlag. 17th European conference on
machine learning, pp. 574–581, 2010.
[7] U. Maulik and S. Bandyopadhyay, “Performance evaluation of some clustering algorithms and validity indices”, IEEE Transactions on Pattern
Analysis and Machine Intelligence, vol. 24, no. 12, pp. 1650–1654, 2002.
[8] N. Settouti, M. Bechar, and M. Chikh, “Statistical Comparisons of the Top 10 Algorithms in Data Mining for Classification Task”, International
Journal Of Interactive Multimedia And Artificial Intelligence, vol. 4, no.
1, pp. 46–51, 2016.
[9] A. M. Jalil, I. Hafidi and L. Alami,“Comparative Study of Clustering Algorithms in Text Mining Context”, International Journal Of Interactive Multimedia And Artificial Intelligence, vol. 3, no. 7, pp. 42–45, 2016. [10] K. Swan, “Learning Analytics and the Shape of Things To Come”, The
Quarterly Review of Distance Education, vol. 17, no. 3, pp. 5–12, 2016.
[11] Q. Nguyen, D. T. Tempelaar, B. Rienties, and G. Bas, “What learning analytics-based prediction models tell us about feedback preferences of students”, The Quarterly Review of Distance Education, vol. 17, no. 3, pp. 13–33, 2016.
[12] S. De Freitas et al., “Foundations of dynamic learning analytics: Using university student data to increase retention”, British Journal of
Educational Technology, vol. 46, no. 6, pp. 1175–1188, 2015.
[13] O. J. Oyelade, O. O. Oladipupo, and I. C. Obagbuwa, “Application of k Means Clustering algorithm for prediction of Students’ Academic Performance”, International Journal of Computer Science and Information Security, vol. 7, no. 1, pp. 292–295, 2010.
[14] J. A. Reyes, “The Skinny on Big Data in Education: Learning analytics simplified”, TechTrends, vol. 59, no. 2, pp. 75–80, 2015.
[15] R. Klamma, “Community Learning Analytics – Challenges and Opportunities”, Advances in Web-Based Learning – ICWL 2013. Lecture
Notes in Computer Science. Springer, vol. 8167, pp. 284–293, 2013.
[16] C. Romero and S. Ventura, “Educational data mining: A review of the state of the art”, IEEE Transactions on Systems, Man, and Cybernetics-Part C:
Applications and Reviews, vol. 40, pp. 601–618, 2010.
[17] M. Scheffel, H. Drachsler, S. Stoyanov, and M. Specht, “Quality Indicators for Learning Analytics”, Journal of Educational Technology & Society, vol. 17, no. 4, pp. 124–140, 2014.
[18] R. S. J. d. Baker and G. Siemens, “Learning analytics and educational data mining: Towards Communication and Collaboration”, Proceedings of the 2nd International Conference on Learning Analytics and Knowledge -
LAK ‘12, pp. 252-254, 2012.
[19] G. Brock, V. Pihur, S. Datta, and S. Datta, “clValid : An R Package for Cluster Validation”, Journal Of Statistical Software, vol. 25, no. 4, pp. 1–28, 2008.
[20] A. Banerjee and R. N. Davé, “Validating clusters using the Hopkins statistic”, Proceedings of 2004 IEEE International Conference on Fuzzy
Systems, pp. 149–153, 2004.
Alvaro Martínez Navarro
Alvaro Martínez Navarro was born in Pasto, Colombia in 1974. Computer Engineer from Universidad Mariana since 1998. He received his master degree from Universidad de Nariño in Teaching of Higher Education. Candidate to Master in Analysis and Visualization of Massive Data / Visual Analytics & Big Data from Universidad Internacional de La Rioja. He is an Associate Professor at the Universidad Mariana and he is member of the research group GISMAR (B ranking). His research area is analysis and visualization of massive data, learning analytics and higher education in engineering.
Pablo Moreno-Ger