139 Copyright © 2011-15. Vandana Publications. All Rights Reserved.
Volume-5, Issue-1, February-2015
International Journal of Engineering and Management Research
Page Number: 139-144
Importance of Six Sigma in Small and Medium Enterprises to Improve the
Productivity
Amit Meshram
P.G Student M-Tech (MECHANICAL ENGG DESIGN), Department of Mechanical Engineering, Priyadarshini College of Engineering Nagpur, Maharashtra, INDIA
ABSTRACT
Simulation of business and manufacturing processes has been helping companies improve their operations for several decades. During that time, business improvement programs have appeared disappeared, grown and evolved. Six Sigma introduced another way of thinking about process improvement by focusing primarily on the financial impact and how defect reduction, customer satisfaction and improved processes all contribute. Only recently has Six Sigma broadly accepted the benefits and approach of simulation to streamline projects, improve results and in still a deeper understanding and appreciation of “the process.” This paper begins with an overview of Six Sigma, followed by a description of the benefits of Six Sigma to a Six Sigma Black Belt and ends with an example of the benefits received by an organization or by the SMEs through the use of simulation.
Keywords--- Analyze,Goods, Manufacturing,
Methodology, Six-Sigma and Organization.
I.
INTRODUCTION
Six Sigma Methodology has been found a most powerful Quality Improvement Technique so far in the world. This technique was originated in Motorola Inc. USA by Japanese as such, it became very popular in Europe and many corporations revolutionized their business culture after implementing this program. They showed drastic results on record and improved their profitability and productivity in multiples. The leading companies believe so much in Six Sigma that they are willing to invest 100’s of millions of dollars in Six Sigma with the expectation to receive billions of dollars in return. Six Sigma places the emphasis on financial results that can be achieved through the virtual elimination of product and process defects. Gone are the days of quality at any cost.
Today’s quality improvement programs must deliver measurable results, short-and long-term, to operational effectiveness and the bottom line. The logical end of this approach is that as product and process defects are driven out, value for the customer goes up, customer satisfaction increases, the company captures the market with higher quality at lower price, and profits and company stakeholder value is maximized. Sigma is a letter from the Greek alphabet used in statistics as shorthand for the
Standard Deviation, one metric that describes the
variability in a set of data. In Six Sigma, the focus is on the reduction of defects in a product or process. The measure is derived from the concept of a process predictably producing output that is about twice as good as that specified by the customer. At a “Six Sigma” level, a process predictably produces no greater than 3.4 defects per million opportunities (DPMO). A “defect opportunity” is defined as a chance for non-conformance or not meeting the required specifications. This assumes that the output is normally distributed and includes the assumption of a long term process shift of 1.5 to account for shift and drift of the mean. DPMO provides a base standard metric for comparing disparate systems in different industries. A Six Sigma Process; Output twice as Good as Customer Requirements Six Sigma has traditionally been and continues to be very statistics centric. Only recently, Six Sigma Black Belts have been introduced to the benefits that simulation brings to a Six Sigma project and many Black Belts now require a simulation solution as part of their Six Sigma toolkit. Black Belt is the common term for those experts within a company.
II.
SIX SIGMA PHASES140 Copyright © 2011-15. Vandana Publications. All Rights Reserved.
thought of as a roadmap for problem solving and product/process improvement. Most companies begin implementing Six Sigma using the DMAIC methodology; Approaches to Six Sigma dictate the use of a model to drive a disciplined approach to the solution of quality problems. The most commonly used model is the five-phase model commonly known by the acronym DMAIC (Define, Measure, Analyze, Improve, and Control). The model acts as a roadmap for improvement projects, leading the teams through figure: 1 shows how it works,
FIGURE: 1 SIX SIGMA PHASES
Define: The Define Phase is the first phase of the Lean Six Sigma improvement process. In this phase, the leaders of the project create a Project Charter, create a high-level view of the process, and begin to understand the needs of the customers of the process. This is a critical phase of Lean Six Sigma in which your teams define the outline of their efforts for themselves and the leadership (executives) of your organization.
Measure: Measurement is critical throughout the life of the project and as the team focuses on data collection initially they have two focuses: determining the start point or baseline of the process and looking for clues to understand the root cause of the process. Since data collection takes time and effort it’s good to consider both at the start of the project.
Analyze: This phase is often intertwined with the Measure Phase. As data is collected, the team may consist of different people who will collect different sets of data or additional data. As the team reviews the data collected during the Measure Phase, they may decide to adjust the data collection plan to include additional information. This continues as the team analyzes both the data and the process in an effort to narrow down and verify the root causes of waste and defects.
Improve: Once the project teams are satisfied with their data and determined that additional analysis will not add to their understanding of the problem, it’s time to move on to solution development. The team is most likely collecting
improvement ideas throughout the project, but a structured improvement effort can lead to innovative and elegant solutions.
Control: This phase is a mini version of process management. The team has been building a form of infrastructure throughout the life of the project, and during the Control Phase they begin to document exactly how they want to pass that structure on to the employees who work within the process.
141 Copyright © 2011-15. Vandana Publications. All Rights Reserved.
deployment of Six Sigma within SMEs.
III.
APPLICATION OF SIX SIGMA IN
SMES
Today, it is much easier for SMEs to obtain good external resources without a large up-front payment. Once an owner of the business (in small firms) is convinced of the advantages conferred by Six Sigma and visualizes the benefits, it is much easier to implement Six Sigma at smaller firms and to realize its benefits (Adams et al., 2003). They suggest that the initial focus on SMEs can be to reduce quality costs or waste in the system. Effort and investment, as well as results in smaller companies, are more visible within a short time. , in small organizations, if one visible and important person is actively against Six Sigma, then this attitude must change or the initiative must be a non-starter. In other words, in small companies, the top management team needs to be visibly supportive of every aspect of Six Sigma initiative and they must demonstrate by their active participation, involvement and by their actions that such support is more than lip service. He also accentuates the point that it is far more important for small- and medium-sized enterprises to ensure that every iota of effort is directed exactly where it is needed for maximum benefit, so an overall quality strategy plan is vital right from the start of the Six Sigma initiatives. Six Sigma is about overall management strategy, culture and change, and the organization needs to build all of this into a sound corporate strategy plan. The following advantages for small-businesses embarking on Six Sigma initiative:
1. Stronger, more intimate relationships with
customers.
2. A limited number of sites.
3. Fewer layers in the management hierarchy.
4. Faster and effective internal communication.
5. Strong owner influence.
BARRIERS FOR IMPLEMENTATION OF SIX SIGMA BY SMEs:
Six Sigma approach since its inception has been usually associated with large companies. Gradually midsize companies have also started reaping financial benefits from the program. They are achieving enhanced savings from Six Sigma projects and better growth. Lack of knowledge and education and some of the misconceptions about Six Sigma has made the SMEs to be skeptical about the applicability of Six Sigma for them. Apart from these there are some genuine technological, organizational and financial limitations of SMEs that act as barriers for Six Sigma implementation by them, are as follows:
1. Lack of resources
2. Internal resistance
3. Lack of leadership from top executives
4. Lack of knowledge about Six Sigma
5. Insufficient organizational alignment 6. Cultural barriers
7. Poor training and coaching
8. False notion that Six Sigma is too complex to use
9. Wrong identification of the process parameters
10. Lacunae in data collection 11. Poor Six Sigma project selection
IV.
SIX SIGMA STUDY IN
MANUFACTURING INDUSTRY
Present study will let you know about the various steps to be considered while going through a case study in a manufacturing industry. For solving any problem, the methodology adopted must cover all possible causes of problem. If the methodology of problem solving is not comprehensive enough, the solution obtained at completion will not be correct and problem will resurface sooner or later. A process flow chart is to be prepared to proceed in a sequential manner and to present a one shot picture of the entire methodology, In this paper, the high rejection problem can be studied in depth and all the five phases in Six Sigma methodology, i.e. Define, Measure, Analyze, Improve and Control (DMAIC) can be successfully implemented to achieve the existing sigma quality level from 1.40s to 5.46s. Six Sigma Training is taught for a variety of professions and industries. The great thing about Six Sigma is that even though it was created as a process improvement method for manufacturing, it can offer so much more to the world than just that. It can be applied to nearly any industry or business, and can create process and product improvements that lower statistical variations and generate defect rates of about 3.4 parts per million.
Define the problem and define what customer
requires (Henderson and Evans, 2000). In define phase, process map and high-level process map – a SIPOC (Supplier, Input, Process, Output, and Customer) diagram should be drawn to understand the process. These diagrams were used to document manufacturing sequence of product and to identify the process or product for improvement.
Measure In measure phase, a measurement
system analysis is conducted which includes the Gauge
142 Copyright © 2011-15. Vandana Publications. All Rights Reserved.
a micrometer. From the results of Gauge R&R study, repeatability and reproducibility comes out to be 27.02 percent and 0.00 percent and put the percentage study variation to be 27.02 percent, which is o30 percent, indicating that micrometer was correct.
Analysis According to Kapur and Feng (2005), the
analyze phase examine the data collected in order to generate a prioritized list of source of variation.Many statistical tools are used to carry out the analysis which are explained as follows.
Process capability analysis. Process capability analysis can be performed to find out actual state of the process. Rational sub-grouping can be done and 20 samples can be drawn, in a group of five. Can use Minitab to draw process capability analysis curve for product parameter analysis. Say Z – Bench sigma value of process found to be 1.40 and existing DPMO level of the process comes out to be 80,213.07, which is remarkably high and this shows that there are lot of opportunities for improvement in the process.
Fishbone Diagram. Using process capability analysis, the DPMO level and sigma level of the product parameter rejection is known. Now it is the time to find out the causes of bush rejection. Using expert experience and critical analysis of actual process, a Fishbone can be drawn to find out the causes of more product rejections.
FIGURE 2: FISH BONE DIAGRAM
Two-sample t-test. The t-statistic was introduced in 1908 by William Sealy Gosset, a chemist working for the Guinness brewery in Dublin, Ireland ("Student" was his pen name). Gosset had been hired due to Claude Guinness's policy of recruiting the best graduates from Oxford and Cambridge to apply biochemistry and statistics to Guinness's industrial processes. Gosset devised the t-test
as a cheap way to monitor the quality of stout. The t-test work was submitted to and accepted in the journal
Biometrika, the journal that Karl Pearson had co-founded
and was the Editor-in-Chief; the article was published in 1908. Company policy at Guinness forbade its chemists from publishing their findings, so Gosset published his mathematical work under the pseudonym "Student". Actually, Guinness had a policy of allowing technical staff leave for study (so-called study leave), which Gosset used during the first two terms of the 1906-1907 academic year in Professor Karl Pearson's Biometric Laboratory at University College London. Gosset's identity was then known to fellow statisticians and the Editor-in-Chief Karl Pearson. It is not clear how much of the work Gosset performed while he was at Guinness and how much was done when he was on study leave at University College London. In two-sample t-test four important factors were taken for study identified from Fishbone diagram.
In first case, two-sample t-test can be performed for operator skill (unskilled and skilled) by taking the sample size of 50 each for skilled and unskilled operator.
In second case, two-sample t-test was done for replacement (after 15 h and after 25 h) by taking the sample size of 50 each for rod replacement after 15 and 25 h.
In third case, two-sample t-test was done for regrinding of tool (after 20 h and after 30 h) by taking the sample size of 50 each for regrinding after 20 and 30 h. In forth case, two-sample t-test was done for rod-holding mechanism (old and new) by taking the sample size of 50
each for old and new mechanism. Most t-test statistics
have the form t = Z/s, where Z and s are functions of the data.
Typically, Z is designed to be sensitive to the alternative hypothesis (i.e., its magnitude tends to be larger when the alternative hypothesis is true), whereas s is a scaling parameter that allows the distribution of t to be determined.
The two-sample t-test is one of the most commonly used hypothesis tests in Six Sigma work. It is applied to compare whether the average difference between two groups is really significant or if it is due instead to random chance. It helps to answer questions like whether the average success rate is higher after implementing a new sales tool than before or whether the test results of patients who received a drug are better than test results of those who received a place.
143 Copyright © 2011-15. Vandana Publications. All Rights Reserved.
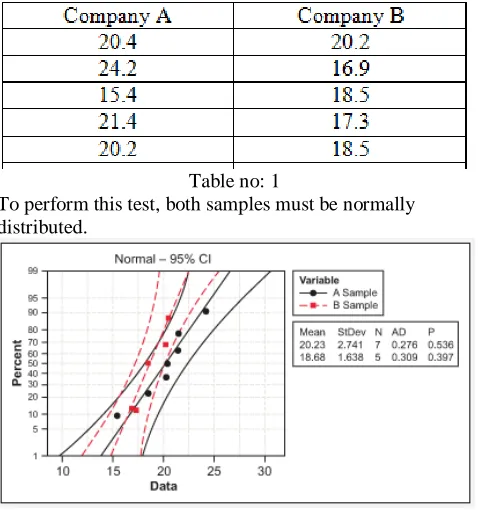
Table no: 1
To perform this test, both samples must be normally distributed.
Figure 3: Probability plot of sample A & Sample B
Since both samples have a p-value above 0.05 (or 5 percent) it can be concluded that both samples are normally distributed. The test for normality is here performed via the Anderson Darling test for which the null hypothesis is “Data are normally distributed” and the alternative hypothesis is “Data are not normally distributed.”
Using the two-sample t-test, statistics software generates the output in Table 2.
Table no: 2
Difference = mu (A Sample) – mu (B Sample) Estimate for difference: 1.54857
95% CI for difference: (-1.53393, 4.63107)
T-test of difference = 0 (vs not =): T-value = 1.12, P-value = 0.289, DF = 10
Both use pooled SD = 2.3627
Since the p-value is 0.289, i.e. greater than 0.05 (or 5 percent), it can be concluded that there is no difference between the means. To say that there is a difference is taking a 28.9 percent risk of being wrong.
If the two-sample t-test is being used as a tool for practical Six Sigma use, that is enough to know the concept of Six Sigma.
V.
ACKNOWLEDGEMENT
Six Sigma for SMEs is an emerging topic among many academics and Six Sigma practitioners over the last two to three years. Very few studies have been reported about the successful applications of Six Sigma in SMEs. As small companies are more agile, it is much easier to buy-in management support and commitment, as opposed to large organizations. The education and training component is much harder for smaller companies. Moreover, small companies do not have the slack to free up top talented people to engage in training followed by execution of Six Sigma projects as they are crucial to the day-to-day operations and problem solving within the company. Being able to link compensation to Six Sigma implementation is much easier in small companies compared to a large company. This paper is an attempt to justify the highly useful role of management techniques like Six Sigma for SME’s, which are normally presumed to be in the domain of large industries. Product parameter variation is found to be a big problem in manufacturing industry.
REFERENCES
[1] Adams, C.W., Gupta, P. and Wilson, C. (2003), Six Sigma Deployment, Butterworth-Heinemann, Burlington, MA.
[2] Behara, R.S., Fontenot, G.F. and Gresham, A. (1995), “Customer satisfaction measurement and analysis using Six Sigma”, International Journal of Quality & Reliability Management. & isixsigma.com
[3] Burton, T. (2004), “Six Sigma for small and medium
sized businesses”, available at: www.isixsigma.com/library/content/ (accessed June 20, 2008).
[7] Harry, M.J. and Schroeder, R. (2000), Six Sigma: The Breakthrough Management Strategy Revolutionizing the [4] S.K Gupta, Dr R V Singh, Dr V K Mahna, Rajendra Kumar, “ Lean Implementation In Manufacturing Industry; Volume 3,1,2012, pp, 1320, ISSN online 0976-69
[5] Coronado, R. and Antony, J. (2002), “Critical success factors for the implementation of Six Sigma projects in organization”, The TQM Magazine, Vol. 14 No. 2, pp. 92-9. Goh, T.N. and Xie, M. (2004), “Improving on the Six Sigma paradigm”, The TQM Magazine, Vol. 16 No. 4, pp. 235-40.
144 Copyright © 2011-15. Vandana Publications. All Rights Reserved.
WorldsTop Corporations, 1st ed., Double Day – A Division of Random House Publication, New York, NY. [8] George Eckes, “Six Sigma For Everyone”, John Wiley & Sons, Inc.
[9] Jiju Antony, “Six Sigma in the UK service organizations: results from a pilot survey”, Managerial Auditing Journal, 19, (8), pp. 1006 1013, 2004.