103
Copyright © 2018. IJEMR. All Rights Reserved.
Volume-8, Issue-2, April 2018
International Journal of Engineering and Management Research
Page Number: 103-109
Benchmarking Quality Management System (QMS) Audit Process on Oil
and Gas Projects
Shobhendu Prabhakar
Project Quality Manager, TechnipFMC, Houston, TX, USA
Corresponding Author: [email protected]
ABSTRACT
This research paper discusses when and why there is a need to benchmark QMS audit process, illustrates objectives of QMS audit benchmarking exercise and details steps to carry of QMS audit process benchmarking exercise on oil and gas projects.
Keywords-- Benchmarking, Quality Management System Audits, Best in class performance and Continuous improvement
I.
INTRODUCTION
Crude oil prices have not been great in last few years. In fact, in early 2016 oil prices reached as low as around $28 per barrel from as high as around $ 105 per barrel in mid-2014, refer to Figure – 1 [1]. This represents a 73% decline in oil prices in a span of only year and a half. Though oil prices have seen an upward trend since mid-2017 (around $40s) and Q1 2018 (around $60s), they are still nowhere near when compared to period of 2011 – mid 2014.
Fig.1 – Crude Oil Prices – 10-year chart
According to a study by Strategy & (a global consulting firm), due to lower oil prices, the companies in oil and gas sector are facing enormous challenges. To address these challenges, the companies’ corporate strategic objectives will increasingly focus on a) sustainable profitability and b) differentiated capabilities will become a key factor for future success [2]. One of the most effective ways to boost profitability is ‘Benchmarking’ through process improvement. According to a research, companies whose best practice performance measures rank in the top quartile of their industry are 10 times more profitable than companies that rank in the bottom quartile [3].
Since Quality Management System (QMS) and QMS audits are critical parts of oil and gas projects execution and can contribute significantly to cost savings and thus profitability, a diligent review of company’s QMS audit process is prudent.
This research paper:
a) discusses symptoms that should prompt a company that there is need to benchmark its QMS audit program
b) details objectives of QMS audit benchmarking exercise
c) provides detailed steps to carry out QMS audit benchmarking exercise
d) details a meaningful guideline survey questionnaire to identify gaps and opportunities for improvement in QMS audit process with respect to company’s peers and best in class companies
e) provides a prioritization matrix to effectively implement suggested recommendations from QMS audit process benchmarking.
II.
OBJECTIVES OF QMS AUDITS
104
Copyright © 2018. IJEMR. All Rights Reserved.
Before diving into the objectives of QMS auditsBenchmarking on Oil and Gas projects, let me detail the reasons why and when a company in Oil and Gas industry should decide to perform benchmarking exercise on its QMS auditing process.
Despite of QMS audits:
Company has high/significant cost of poor quality (i.e. the cost of poor quality is above the target established by the company and/or higher than the cost of poor quality of company’s competitors). Cost of poor quality is typically defined as an additional cost incurred by the company in fulfilling the gap between desired and actual product/service quality [4].
Company’s customer satisfaction ratings have been declining and/or customer complaints have been increasing.
Non-conformances are not identified at the right time and the right phase during project execution. A typical example would be engineering related non-conformances are identified in procurement and/or construction phase OR procurement/equipment related quality issues are identified during installation phase. Late identification of non-conformances not only drives cost of correction up but also bullwhips efforts and complexity to correct the non-conformances. The term bullwhips here is taken from the bullwhip effect observed in the distribution channel. It refers to increasing swings in inventory in response to shifts in customer demand as one moves further up the supply chain 5, 6, 7]. Applying the same concept, if the non-conformances are identified late (i.e. farther from the project phase), the efforts, complexity and cost to correct the non-conformances increase as illustrated in Fig.1.
Fig.1 – Bullwhip effect of late non-conformance identification
Recurring similar types of non-conformances and/or quality issues on projects within the company.
Company’s current QMS audits are not risk based and do not address risk mitigations effectively on the projects.
Existing QMS audits are perceived by the company, client, supplier and sub-contractors as:
routine procedural compliance tools as opposed to continuous improvement tools.
verifications from 10,000 ft level (i.e. high level) as opposed to verification of detailed process(es), sub-process(es) and steps within the subjected process(es) and sub-process(es).
too frequent or too sporadic.
minimum value added for project execution and process improvements. If a company is facing one or more of the above scenarios despite of QMS audits, it is time to re-evaluate, benchmark and improve its QMS audit program.
Objectives of QMS audits benchmarking include:
Identify what is working and what is not working for QMS audits
Identification and adoption of QMS audit best practices from best in class peers
Re-defining goals and key performance indicators of QMS audit program
Reduction in cost of poor quality due to QMS audits benchmarking
Company should also analyze changes in the marketplace and role of QMS audits to help company sustain its competitive advantage.
III.
STEPS OF QMS AUDITS
BECHMARKING
Like any other benchmarking project [15], there are following steps to be followed for QMS audit benchmarking.
Planning
Analysis
Integration
Action
Planning:
Planning phase of QMS audit benchmarking project involves following tasks:
Mission statement – this statement should include purpose, scope, value proposition and desired future state [8] of QMS audit program.
105
Copyright © 2018. IJEMR. All Rights Reserved.
Research – company should conduct a research on following items within recent past (3-5 years):
1. Functional areas on which QMS audits were conducted
2. Scope and frequency of QMS audits 3. Cost benefit analysis of QMS audits
Survey – the company should decide which survey media (online, phone and/or face to face) will be used. An in-depth and meaningful survey questionnaire should be developed by the benchmarking team. Below survey questionnaire lists some of the useful questions that should be asked. These questions are for guideline only. Company’s benchmarking team should tailor the survey questionnaire based on the company needs and goals.
1. Do your company have a defined QMS audit program?
Yes No
2. Are there defined criteria to select areas to be audited?
Yes No
3. What are the criteria to select areas to be audited (select one or more)?
Risk ranking Non-conformances Cost of poor quality Lessons learned Customer complaints
Equipment post-delivery issues Warranty claims
Audit team judgement
4. What is the frequency of audits? Monthly
Quarterly Half yearly Annually
More than a year
5. Typical number of auditors to conduct a QMS audit
One Two Three
More than three
6. What is the structure of audit team? Quality Assurance (QA) personnel only
Subject Matter Experts (SMEs) only Combination of QA personnel and
SMEs
7. Are there separate audit checklists for each area to be audited?
Yes No
8. What type of questions are in the audit checklist (select one or more)?
verification of documented procedures and related records check of process risks and mitigation measures
assessment of cost and schedule impacts
implementation of lessons learned from past issues
review of corrective and preventive actions from past non-conformances for effectiveness in current business environment
review of customer complaints and assessment of actions taken to prevent recurrence
9. Who receives the audit results and reports?
Auditees only
Auditees and process owners Auditees and their respective managers
Auditees, their respective managers and process owners
10. Are root causes identified for non-conformances?
Yes No
11. What tools are used to conduct root cause analysis for audit findings (select one or more)?
None
Verbal thru informal interviews only 5-why
Fishbone diagram
Any other (list the name of the tool)
12. How systematic is the root cause analysis process on a scale 1 thru 10? (1 - poor, 10 – excellent)?
106
Copyright © 2018. IJEMR. All Rights Reserved.
13. Who checks and verifies implementationof corrective and preventive actions for audit findings?
Auditor only SMEs only Auditor or SME Auditor and SME
14. Are audit findings from one location or one project shared among other locations or projects?
Yes No
15. If answer to question 14 is a ‘yes’, how are these audit findings shared?
Email Meeting Central website
16. Are cost and schedule impacts quantified for each audit finding?
Yes No
Yes. However, it is done on a case by case basis but not for each audit finding
17. Who reviews QMS audit findings data? Quality Leadership Team (QLT) only Process Owners only
QLT and process owners
18. How frequently review mentioned in question 17 conducted?
Weekly Monthly Quarterly Half yearly Annually More than a year
19. Are the audit findings trended? Yes
No
20. What type of trending is performed (select one or more)?
Cost impact Schedule impact Non-conformance types Non-conformance root causes Recurrence of same or similar non- conformances
Recurrence of same or similar customer complaints non- conformances
21. Is Return on Investment (ROI) calculated for QMS audit program? Yes
No
22. Are inputs to improve QMS audit program collected?
Yes No
23. If answer to question 22 is ‘yes’, from whom the inputs are collected?
Internal stakeholders only Clients/customers Suppliers/Sub-contractors
24. If answer to question 22 is ‘yes’, are these inputs analyzed and actioned? Yes
No
25. Are QMS audits perceived as value added from internal stakeholders, clients/customers and suppliers/sub-contractors?
Yes No
26. If answer to question 25 is ‘no’, are further questions asked as to relevant stakeholders as to why?
Yes No
27. If answer to question 26 is ‘yes’, are responses from stakeholders analyzed and actioned?
Yes No
Next step after developing the survey questionnaire is to define the survey distribution list. To get most value out of the survey questionnaire, benchmarking team should send the survey to both internal and external stakeholders along with personnel from peer best in class companies. List of internal stakeholders, external stakeholders (clients/customers and suppliers/sub-contractors) and personnel from peer and best in class companies should typically include:
Company leadership
Department and/or Functional heads Process owners
Project Managers Auditees
107
Copyright © 2018. IJEMR. All Rights Reserved.
comparison to getting responses from personnel of best inclass companies specifically if they are competitors. That said, there will be personnel from competitors and/or best in class companies who will be willing to participate in the survey to know the results as well as for the improvement of QMS audit program across the oil and gas industry. The other option is to outsource the survey and competitive research to an independent third party who conducts research for benchmarking and research purposes [9].
In parallel to the survey questionnaire, the benchmarking team should also decide whether they should conduct office and/or site visits internally and externally to understand more about positives and improvement areas for QMS audit program.
Analysis:
After collecting the required data in the planning phase, the benchmarking team should analyze the collected data. Following steps should be carried out to analyze the data.
Gap analysis – benchmarking team should perform a gap analysis to understand in which aspects the company’s QMS audit program is superior, inferior or at par with those of competitors’ and best in class companies. A typical gap analysis template is provided below.
Table 1 – Gap Analysis Template
Next step in the gap analysis is to determine up to what extent the company’s QMS audit program is inferior to that of its competitors and the best in class companies. Since the purpose of benchmarking exercise is to improve, the company should focus on areas of improvement. The company should also focus on whether historically the performance gap has been narrowing or widening or remaining the same.
Similarly, the company should also analyze the what-if scenarios i.e. what-if the company does X to improve, what will be the reaction of competitors and the best in class companies and what steps the company should take to minimize the impacts.
Summary metric – development of a summary metric (single or multiple) is highly desirable to interpret and compare the data at hand. For QMS audit program benchmarking exercise, typical summary metric should at least include following:
Table 2 – Typical Summary Metric – QMS Audit Program
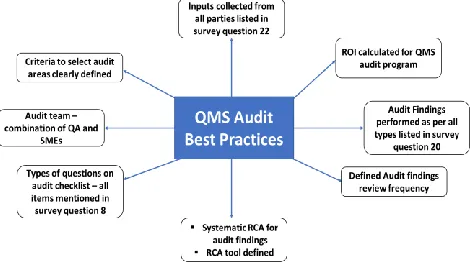
Compilation of best practices chart: Upon analysis of survey responses and QMS audit program of best in class/competitor companies, the benchmarking team should identify and compile a chart of best practices. Compilation of best practices provides the benchmarking team with an understanding of value added elements of QMS audit program. A typical best practices chart would be like the one depicted in Figure – 2.
Figure 2 – Typical QMS Audit Program Best Practices
Integration:
List of personnel to whom the benchmarking exercise result will be communicated:
Identification of a comprehensive distribution list to whom the benchmarking exercise results will be communicated is critical so that:
no stakeholders are left out.
personnel with right management and supervisory levels know the results. the results are not going inadvertently to
inappropriate personnel.
The benchmarking team should finalize the distribution list after consulting with the relevant stakeholders.
Mode of presentation:
108
Copyright © 2018. IJEMR. All Rights Reserved.
companies may choose verbal discussions or acombination of both. Independent of the presentation mode, the content should be informative as well as persuasive. Informative because the benchmarking team is trying to educate the stakeholders about the benchmarking exercise findings and results and persuasive because the purpose of benchmarking exercise is to identify gaps and continuous improvement [10, 11, 12].
Organization of findings, results and
recommendations:
Though analysis phase provides findings, the benchmarking team not only need to interpret the findings to gain meaningful insights, extract results, draw conclusions and provide recommendations but also need to organize these items in such a way that the findings, results and recommendations make sense and are clearly understood by relevant stakeholders [13]. To do this, the benchmarking team should consider following:
Data collection, Data processing and Data analysis process.
Emerging themes and patterns from the data analysis.
Significance of results from statistical point (if it can be proven).
Do findings and results lead to additional data request?
Do findings and results pass ‘the making sense’ test?
Following is typical representation of benchmarking study report structure:
Scope
Purpose
Executive Summary
Methodology
Team structure
Competitor and Best in Class Companies analysis
Comparative Study
Company’s QMS audit process status with respect to Peers and Best in Class Companies
Key Findings
Recommendations
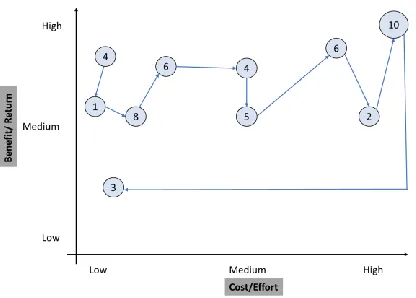
Recommendations – prioritization matrix
Since action(s) for every recommendation requires efforts and cost by stakeholders, it is highly desirable that the Benchmarking team should create a prioritization matrix explaining cost/effort vs benefits/returns of suggested recommendation. This prioritization matrix will help management and stakeholders to decide recommendations to be addressed in short and long terms. A sample prioritization matrix of ten (10) recommendations is illustrated in Figure - 3.
Figure 3 – Recommendation Priorities Cost/Effort vs Benefit/Return Matrix
Review and revision of functional goals:
The company should review and revise functional goals to align them with the recommendations and future state of QMS audits program.
A case in point can be that one of the recommendations from Benchmarking team is as follows:
Expand the horizon of audit findings trending to include cost and schedule impacts.
Therefore, the company’s functional goal should be that for every audit finding, cost and schedule impacts shall be determined and reported.
Action:
Based on the prioritization matrix depicted in Figure - 3, the company should determine recommendations implementation priorities.
As a guideline, path mentioned in Figure – 4 can be one of the paths that the company can take to decide on implementation priorities. In this path, the company plans to implement recommendations that require lower cost/effort and higher benefit/return.
109
Copyright © 2018. IJEMR. All Rights Reserved.
Depending on severity of recommendation(s) andbudget availability, the company may decide to implement recommendation 10 first and then move towards left.
Other criteria to determine implementation priorities are training required, probability of success and controls needed [14].
Further, it is important to clearly define and detail action plans for each agreed recommendation based on the implementation priority. Action plans should as a minimum include – specific tasks along with desired outcomes, schedule that includes task sequence, start and end dates, resources, key responsible personnel along with a monitoring system to track progress [14].
Benchmarking team along with assistance from stakeholders should monitor implementation progress and results at an agreed frequency.
IV.
SCOPE OF FUTURE RESEARCH
Like QMS audits, the author would like to identify and analyze other Quality Management System processes to be benchmarked on the Oil and Gas projects.
V.
CONCLUSION
Reduction in cost of poor quality, timely identification of non-conformances and increase in customer satisfaction ratings play a critical role in any company’s profitability. These items are becoming even more critical for companies in the oil and gas industry due to lower oil prices for few years now. If not addressed, a decrement in profitability is certain. Therefore, companies in the oil and gas industry should thoroughly look at their QMS audit program and identify if the time has come to benchmark and revamp it. If the answer is yes, this research paper provides details on how to carry out QMS audits benchmarking exercise.
Disclaimer: This paper does not represent any TechnipFMC positon, and it is in no way related to TechnipFMC.
REFERENCES
[1] Crude Oil Price Today. (2018). Available at: http://www.macrotrends.net/2516/wti-crude-oil-prices-10-year-daily-chart
[2] Giorgio Biscardini, Reid Morrison, David Branson, & Adrian del Maestro. (2017). How energy companies can adjust their business models to a period of recovery, 2017 Oil and Gas Trends. Available at: https://www.strategyand.pwc.com/media/file/2017-Oil-and-Gas-Trends.pdf
[3] What is Benchmarking – and Why Is It Important? (2013). CFO Edge. Available at:
https://www.cfoedge.com/blog/performance-
measurement/what-is-benchmarking-and-why-is-it-important/
[4] Cost of Poor Quality – COPQ. Available at: https://www.isixsigma.com/dictionary/cost-of-poor-quality-copq/
[5] How the Bullwhip Effect Impacts the Supply Chain, Ohio University, Online Graduate Degree Programs. Available at: https://onlinemasters.ohio.edu/how-the-bullwhip-effect-impacts-the-supply-chain/
[6] Osmond Vitez, The Bullwhip Effect in Supply Chain, Benchmarking (Surveying). Available at: http://www.cbpp.uaa.alaska.edu/afef/bullwhip_effect_in_s upply_ch.htm
[7] Bullwhip Effect. Available at: https://en.wikipedia.org/wiki/Bullwhip_effect
[8] Mission Statement. Available at: https://en.wikipedia.org/wiki/Mission_statement
[9] Joshua Boyd. (2017). Competitive Benchmarking: What it is and how to do it. Available at:
https://www.brandwatch.com/blog/competitive-benchmarking-defined-how-to-do-it/
[10] Types of Business Presentations. Available at:
https://bizfluent.com/info-7753671-types-business-presentations.html
[11] Defining Your Type of Presentation is Half the Battle. Available at: https://businesstown.com/articles/knowing-what-kind-of-presentation-youre-making-is-half-the-battle/ [12] Types of Business Presentations, Sam M. Walton College of Business, University of Arkansas. Available at:
https://walton.uark.edu/business-communication-lab/Resources/final_types_of_business_presentations.pdf [13] Organizing and Analyzing Your Data. Available at:
https://www.wilder.org/Wilder-Research/Publications/Studies/Program%20Evaluation%2 0and%20Research%20Tips/Organizing%20and%20Analy
zing%20Your%20Data%20-%20Tips%20for%20Conducting%20Program%20Evaluati on%20Issue%2013,%20Fact%20Sheet.pdf, Feb, 2008 [14] J. Juran, A. Godfrey. (1998). Juran’s 1uality
handbook. (5th ed.). New York: McGraw-Hill
[15] Shobhendu Prabhakar. (2017). Benchmarking – A process of continuous improvement to achieve best in class performance, International Journal of Engineering and