IJPAR |Vol.8 | Issue 4 | Oct - Dec - 2019 Journal Home page: www.ijpar.com
Research article Open Access
Stability indicating RP-HPLC method for simultaneous estimation of
darunavir and ritonavir in pure drug and tablet dosage form
G.Priyanka, RV.Valli Kumari
Department of Pharmaceutical Analysis,Malla Reddy Institute of Pharmaceutical sciences,
Maisammaguda, Dhulapally, Secundrabad -500014,Telangana State, INDIA.
*Corresponding Author: G.Priyanka
Email: [email protected]
ABSTRACT
This project presents a sensitive, rapid, precise and accurate stability indicating RP -HPLC technique for the estimation of two antiviral drug combination, ritonavir and darunavir in bulk and tablet form. Ritonavir and darunavir are extracted with mobile phase from the tablets. Analysis was done on a C8 YMC column by detection with photodiode array detector. Mobile phase composition with 0.1M potassium dihydrogen phosphate and methanol in proportion of 65:35 v/v is employed for analysis. The limits of quant ification were 0.160 µg/ml and 2.359 µg/ml for ritonavir and darunavir, respectively.The limits of detection for ritonavir and darunavir are 0.048 µg/ml and 0.708 µg/ml, respectively. The precision (ritonavir – 0.142% RSD and darunavir – 0.116% RSD ) and accuracy (ritonavir – 99.77% to 99.94% recovery and darunavir – 99.39% to 99.65% recovery) remained within standard limits while validation study. Ritonavir and darunavir were degraded applying acid, alkali, oxidative, neutral, thermal and photo degradation conditions. While degradation study, no substantial interfering peaks are seen in chromatograms of all tested degradation conditions at the retention time of ritonavir and darunavir. Finally it was concluded that the quantitative RP -HPLC method developed and validated can be utilized in routine analysis of ritonavir and darunavir in tablets and for stability related studies of ritonavir and darunavir in tablets.
Keywords:
Ritonavir and Darunavir, Potassium Dihydrogen Phosphate.INTRODUCTION
Drugs selected
Two human immunodeficiency virus protease inhibitors, darunavir and ritonavir are selected to
develop a stability indicating RP-HPLC method for their assay in bulk and dosage tablet.
High performance liquid chromatography
separation and identification of compounds. It belongs to column chromatography category. Column chromatography relies on various polarities shown by the compounds in a mixture solution so as to separate them. In HPLC, pressure is used to force the sample solution via the column quickly. Therefore, it produces quickerand more accurate, results.
Reversed phase chromatography
In this technique, the usage of alkaline chains bonded with particles of stationary phase is applied for production of hydrophobic stationary phase with stronger affinity for hydrophobic or less polar compounds. As the mobile phase and stationary phase is inverted, the use of a hydrophobic stationary phase use is necessarily the reverse of normal phase chromatography– and so the term reversed-phase chromatography [19,20]. An aqueous polar mobile phase is used in this technique. Subsequently the hydrophobic molecules of polar mobile phase are tempted to adsorb with hydrophobic stationary phase, will pass through the column and get eluted first [19,20]. The elution of hydrophobic molecules from the column decreases the polarity of the mobile phase with the support of an organic (non-polar) solvent that reduces hydrophobic interactions. The increase in
hydrophobicity of the molecule increases the binding strength with stationary phase, and the higher the concentration of organic solvent which is required for molecule elution.
DRUG PROFILE
DARUNAVIR AND RITONAVIR
Darunavir
Darunavir has beenrecommended for patients with acquired immunodeficiency syndrome condition and human immunodeficiency viral infections. Darunavir belongs to human immunodeficiency virus protease inhibitor drugs category.Used generally in combination with other antiretroviral agents [28-30].
Iupac name
[(1R,5S,6R)-2,8-dioxabicyclo[3.3.0]oct-6-yl] N-[(2S,3R)-4- [(4-aminophenyl)sulfonyl- (2-methylpropyl)amino]-3-hydroxy-1-phenyl- butan-2-yl] carbamate
Empirical formula
C27H37N3O7S
Molecular mass
547.667 g/mol
Drug structure
Figure 1: Darunavir chemical structure
Solubility
Slightly soluble in chloroform and methanol, and soluble in dimethylsulfoxide.
RITONAVIR
In low dose, ritonavir has been recommended as combination therapy for patients with acquired immunodeficiency syndrome condition and human
belongs to human immunodeficiency virus protease inhibitor drugs category[31-33].
Iupac name
Empirical formula
C37H48N6O5S2
Molecular mass
720.94 g/mol
Drug structure
Figure 2: Ritonavir chemical structure
Solubility
Insoluble in water, soluble in methanol and ethanol.
EXPERIMENTAL
Materials
Darunavir reference sample (gifted from Lara Drugs Private Limited, Telangana, India) Ritonavir reference sample (gifted from Lara
Drugs Private Limited, Telangana, India) Durart R 450 tablets labeled to have 400 mg
darunavir and 50 mg ritonavir (Mylan Pharmaceuticals Pvt Ltd, India)
Milli Q water (Millipore, USA)
Methanol (HPLC grade, Merck specialities Ltd, India)
Potassium dihydrogen phosphate (Analytical grade, SD Fine-Chem Limited, India)
Hydrochloric acid (Analytical grade, Fisher Scientific International, Inc, India)
Sodium hydroxide (Analytical grade, SD Fine -Chem Limited, India)
Orthophosphoric acid (Analytical grade, Fisher Scientific International, Inc, India)
Apparatus
Model 2695 Waters HPLC Alliance system equipped by photodiode array detector
Waters Version 2 empower software
YMC analytical column (C8, 25 cm × 4.6 mm, particle size 5 µm)
Ultrasonicator (Labline stock center, India)
Mobile phase
Methanol and 0.1M potassium dihydrogen phosphate are mixed as 35:65 (v/v) ratio. This is also employed for standard solutions preparation.
Conditions set for rp-hplc analysis
Isocratic elution is done at a flow rate of 1.0 ml/min. Sample injection vol is 10 μl. Column is set at 25oC Temp. Detection and quantification is done at 275 nm.
Stock darunavir and ritonavir solution
Stock solution of darunavir and ritonavir is prepared in a 100 ml dry volumetric flask with mobile phase at a concentration of 4000 µg/ml (darunavir) and 500 µg/ml (ritonavir). For this, 400 mg of darunavir and 50 mg of ritonavir is dissolved in mobile phase of volume 100 ml.
Darunavir and ritonavir calibration solutions
The stock darunavir and ritonavir solution is successively diluted with solvent (mobile phase) to prepare calibration solutions. Darunavir and ritonavir calibration solutions were made by diluting 0.5, 0.75, 1.0, 1.25 and 1.5 ml of stock solution by 10 mlmobile phase in volumetric flask to get five point calibration concentrations:
200 µg/ml, 300 µg/ml, 400 µg/ml, 500 µg/ml, 600 µg/ml – darunavir
RESULTS AND DISCUSSION
Assay of darunavir and ritonavir in tabelt
Five Durart R 450 tablets are weighed followed by powdering in mortar pestle to made homogenous mixture. A quantity of mixture corresponding to weight of one tablet (having 400 mg of darunavir and 50 mg of ritonavir) is weighed and liquefied with mobile phase (30 ml). Following 10 min of sonication, the solution mixture was filtered through a membrane filter and transferred to 100 ml standard flask and filled to the mark with mobile phase. The prepared solution is stock tablet solution (4000 µg/ml - darunavir and 500 µg/ml - ritonavir). 1.0 ml of stock tablet solution is transferred to 10 ml standard flask and filled with mobile phase to get working test tablet solution with concentration 400 µg/ml of darunavir and 50 µg/ml of ritonavir. Ten µl of working test tablet solution is injected into the column. Isocratic elution with optimized mobile phase is done at a flow rate of 1.0 ml/min. Column is set at 25oC Temp. Detection and quantification is done at 275 nm. The peak areas of darunavir and ritonavir are determined. From the response, the content of darunavir and ritonavir in tablets were evaluated using regression equation or calibration curve of the selected drugs.
Darunavir and ritonavir stress degradation
evalation
Evaluation of darunavir and ritonavir stress degradation [39] was made by subjecting 1 ml of
stock tablet solution ((4000 µg/ml - darunavir and 500 µg/ml - ritonavir) to diverse stress conditions as shown below:
Acidic stress:1 ml of 0.1N hydrochloric acid
followed by 30 min sonication at room temperature
Basic stress:1 ml of sodium hydroxide
followed by 30 min sonication at room temperature
Oxidative stress:1 ml of 30% hydrogen
peroxide followed by 30 min sonication at room temperature
Neutral stress:1 ml of distilled water followed
by 30 min sonication at room temperature
Photo stress: Exposing1 ml of tablet stock
solution to direct sunlight for 24 hr
Dry heat stress: Exposing 1 ml of tablet stock
solution to 105 oCfor 30 min in hot air oven.
After degradation by applying stress, the samples were diluted to 10 ml with mobile phase (concentration: 400 μg/ml – darunavir; 50μg/ml – ritonavir) in 10 ml standard flask. After filtration, samples are assayed using proposed method. The percentage degradation of ritonavir and darunavir are assessed to check their stability.
Method development
During process of method development, different columns, solvents and mixture of solvent with buffers were checked to elute ritonavir and darunavirwith better resolution, low tailing factor and high plate count.
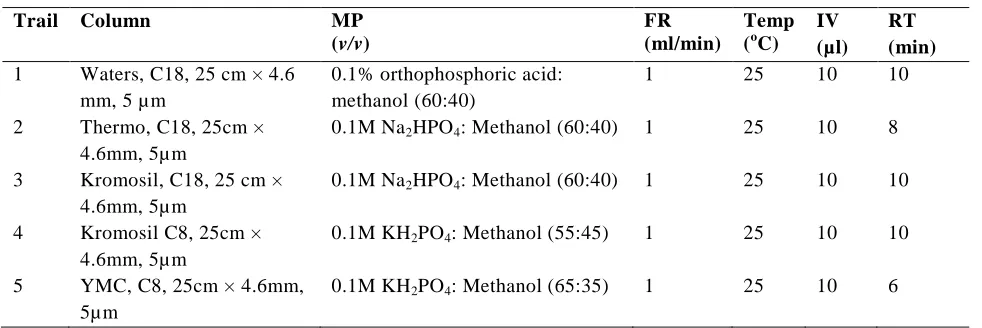
Table 1: Conditions used in different trails
Trail Column MP
(v/v)
FR (ml/min)
Temp
(oC)
IV (µl)
RT (min)
1 Waters, C18, 25 cm × 4.6 mm, 5 µm
0.1% orthophosphoric acid: methanol (60:40)
1 25 10 10
2 Thermo, C18, 25cm × 4.6mm, 5µm
0.1M Na2HPO4: Methanol (60:40) 1 25 10 8
3 Kromosil, C18, 25 cm × 4.6mm, 5µm
0.1M Na2HPO4: Methanol (60:40) 1 25 10 10
4 Kromosil C8, 25cm × 4.6mm, 5µm
0.1M KH2PO4: Methanol (55:45) 1 25 10 10
5 YMC, C8, 25cm × 4.6mm, 5µm
0.1M KH2PO4: Methanol (65:35) 1 25 10 6
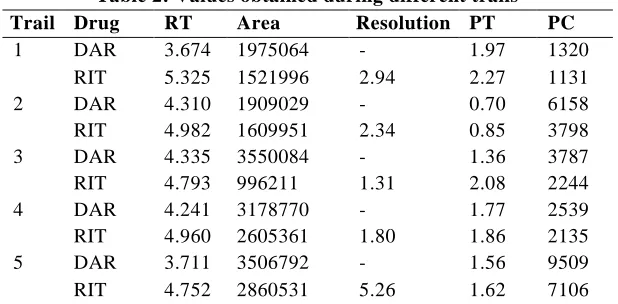
Table 2: Values obtained during different trails
Trail Drug RT Area Resolution PT PC
1 DAR 3.674 1975064 - 1.97 1320
RIT 5.325 1521996 2.94 2.27 1131
2 DAR 4.310 1909029 - 0.70 6158
RIT 4.982 1609951 2.34 0.85 3798
3 DAR 4.335 3550084 - 1.36 3787
RIT 4.793 996211 1.31 2.08 2244
4 DAR 4.241 3178770 - 1.77 2539
RIT 4.960 2605361 1.80 1.86 2135
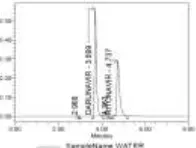
5 DAR 3.711 3506792 - 1.56 9509
RIT 4.752 2860531 5.26 1.62 7106
DAR – darunavir; RIT – ritonavir; RT – retention time; PT – peak tailing; PC – plate count
The chromatograms obtained during different trails are shown in the following figures.
Figure 3: Chromatogram with trial 1 conditions Figure 4: Chromatogram with trial 2 conditions
Figure 5: Chromatogram with trial 3
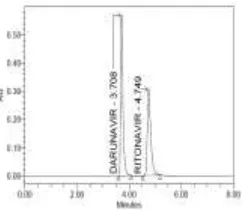
Figure 6: Chromatogram with trial 4 conditions Figure 7: Chromatogram with trial 5 conditions
From the chromatograms and values obtained in all the trails tested, better results were obtained
when trail 5 conditions are used. In trail 5 conditions, the ritonavir and darunavir peaks were
4 . 3 1 0 4 . 9 8 2 AU 0.00 0.10 Minutes
0.00 1.00 2.00 3.00 4.00 5.00 6.00 7.00 8.00 9.00 10.00
3 . 6 7 4 5 . 3 2 5 AU 0.00 0.05 Minutes
0.00 1.00 2.00 3.00 4.00 5.00 6.00 7.00
4 . 3 3 5 4 . 7 9 3 AU 0.00 0.20 Minutes
0.00 1.00 2.00 3.00 4.00 5.00 6.00 7.00 8.00
4 . 2 4 1 4 . 9 6 0 AU 0.00 0.10 0.20 Minutes
0.00 1.00 2.00 3.00 4.00 5.00 6.00 7.00
3 . 7 1 1 4 . 7 5 2 AU 0.00 0.20 0.40 0.60 Minutes
well shaped with less peak tailing. The resolution between ritonavir and darunavir is high in trail 5 conditions. The plate count and response for ritonavir and darunavir is more in trail 5 conditions. Hence the conditions used in trail 5 have been chosen as optimized conditions for the assay of ritonavir and darunavir simultaneously.
METHOD VALIDATION
Developed method is validated for the below explained parameters following set of laws of ICH [40].
Test for system suitability
Suitability of system to assay ritonavir and darunavirwas tested through six injections of working ritonavir (50 µg/ml) and darunavir(400 µg/ml) solution. The parameters measured are: .
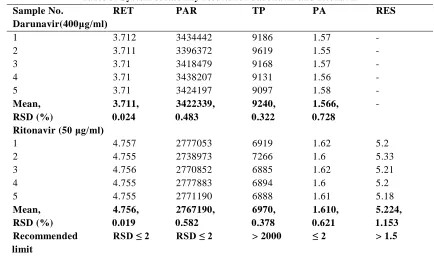
Table 3: System suitability results for darunavir and ritonavir
Sample No. RET PAR TP PA RES
Darunavir(400μg/ml)
1 3.712 3434442 9186 1.57 -
2 3.711 3396372 9619 1.55 -
3 3.71 3418479 9168 1.57 -
4 3.71 3438207 9131 1.56 -
5 3.71 3424197 9097 1.58 -
Mean, RSD (%) 3.711, 0.024 3422339, 0.483 9240, 0.322 1.566, 0.728 -
Ritonavir (50 μg/ml)
1 4.757 2777053 6919 1.62 5.2
2 4.755 2738973 7266 1.6 5.33
3 4.756 2770852 6885 1.62 5.21
4 4.755 2777883 6894 1.6 5.2
5 4.755 2771190 6888 1.61 5.18
Mean, RSD (%) 4.756, 0.019 2767190, 0.582 6970, 0.378 1.610, 0.621 5.224, 1.153 Recommended limit
RSD ≤ 2 RSD ≤ 2 > 2000 ≤ 2 > 1.5
RET-retention time; TP-theoretical plates; PAR-peak area response; PA-peak asymmetry; RES-resolution
All values are inside the recommended limits. Hence the method passed system suitability test and is suitable for assay of ritonavir and darunavir simultaneously.
Test for selectivity
Selectivity was tested by injecting mobile phase and placebo and chromatographic procedure mentioned for proposed method is applied. Mobile phase chromatogram and placebo chromatogram did not show interfering peaks at ritonavir and
darunavir retention time. Similarly the working standard and tablet sample solution with amount 400 µg/ml of darunavir and 50 µg/ml of ritonavir are also injected and chromatograms are compared. The retention times of ritonavir and darunavir both chromatograms are same.
No interfering peaks other than ritonavir and darunavir peaks are seen in chromatograms. This indicating that excipients of tablet do not interfered in assay of ritonavir and darunavir and demonstrated the selectivity of method.
Figure 9: Mobile phase chromatogram
Figure 10: Placebo chromatogram
Figure 11: Ritonavir and darunavir working standard chromatogram
Figure 12: Ritonavir and darunavir tablet sample chromatogram
Linearity and range
The ritonavir and darunavir calibration curves are obtained via linear least square regression process at five diverse concentration levels from 200-600 μg/ml (darunavir) and 25-75 µg/ml (ritonavir) by plotting peak areas in opposition to concentrations. The representative linear equations are:
Y = 8559 c + 863.6 (R² = 0.9999) --- Darunavir
Y = 55414 c– 3193 (R² = 0.9998) ---- Ritonavir Linear regression facts for calibration plots for daruanvir and ritonavir was demonstrative of good linearity between peak area and concentration in the series 200-600 μg/ml (darunavir) and 25-75 µg/ml (ritonavir).
Table 4: Darunavir and ritonavir linearity data
Conc % Darunavir Ritonavir
Area µg/ml Area µg/ml
75 2566960 300 2070296 37.5
100 3429686 400 2767626 50
125 4277480 500 3455671 62.5
150 5135870 600 4158907 75.00
Figure 13: Darunavir linearity graph Figure 14: Ritonavir linearity graph
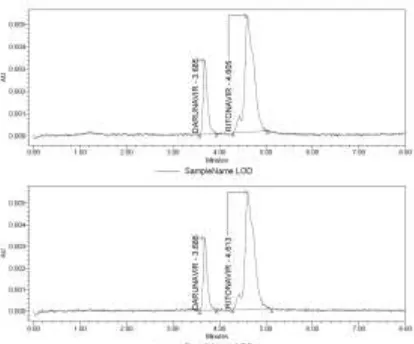
Limit of detection and limit of quantitation
These two parameters are calculated by taking signal to noise ratio of three for limit of detection and signal to noise ratio of ten for limit of quantitation. The values calculated were:
Limit of detection – 0.708 µg/ml (darunavir) and 0.048 µg/ml (ritonavir)
Limit of quantitation -2.359 µg/ml (darunavir) and 0.161 µg/ml (ritonavir)
Figure 16: Limit of detection and limit of quantitation chromatograms
Precision
To evaluate precision, daruanvir(400 µg/ml) and ritonavir (50 µg/ml) standard solution was injected 6 times. Precision is estimated as percent relative standard deviation of six peak areas and
percent assay of ritonavir and darunavir. Percent relative standard deviationis being lower than 2% for ritonavir and darunavirdemonstrates precision of method.
y = 8…
0 5000000 10000000
0 1000
Peak
ar
e
a (
m
A
U)
Concentration of …
y = 55414x - 3193. R² = 0.9998
0 2000000 4000000 6000000
0 50 100
Peak
ar
e
a(m
A
U)
Table 5: Darunavir and ritonavir precision data
S.No Peak area response Percent assay
Darunavir Ritonavir Darunavir Ritonavir
1 3422480 2766858 99.40 99.79
2 3420418 2768393 99.34 99.84
3 3429977 2769205 99.62 99.87
4 3427139 2761519 99.54 99.60
5 3429710 2768405 99.61 99.84
6 3428955 2761559 99.59 99.60
Average 3427240 2765816 99.52 99.76
RSD 0.116 0.142 0.118 0.128
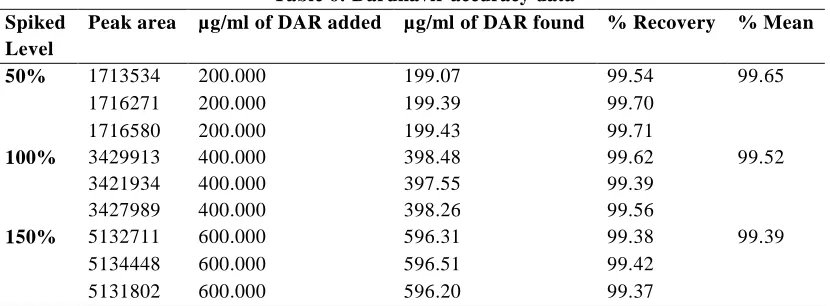
Accuracy
Method accuracy is tested by determining recoveries of darunavir and ritonavir by standard addition technique procedure. Reference standards of ritonavir and darunavirknown amounts are added to prior-quantified tablet sample solution at 50%,
100% and 150% level of labeled claim. The quantity of ritonavir and darunavir was assayed by applying attained peak area values to theirindividual regression line equations and calibration curves.
Table 6: Darunavir accuracy data Spiked
Level
Peak area µg/ml of DAR added µg/ml of DAR found % Recovery % Mean
50% 1713534 200.000 199.07 99.54 99.65
1716271 200.000 199.39 99.70
1716580 200.000 199.43 99.71
100% 3429913 400.000 398.48 99.62 99.52
3421934 400.000 397.55 99.39
3427989 400.000 398.26 99.56
150% 5132711 600.000 596.31 99.38 99.39
5134448 600.000 596.51 99.42
5131802 600.000 596.20 99.37
Table 7: Ritonavir accuracy data Spiked
Level
Peak area µg/ml of RIT
added
µg/ml of RIT found
% Recovery
% Mean
50% 1389984 25.000 25.07 100.26 99.94
1384556 25.000 24.97 99.87
1382069 25.000 24.92 99.69
100% 2766079 50.000 49.88 99.76 99.77
2765097 50.000 49.86 99.72
2767683 50.000 49.91 99.82
150% 4150640 75.000 74.85 99.80 99.87
4158387 75.000 74.99 99.98
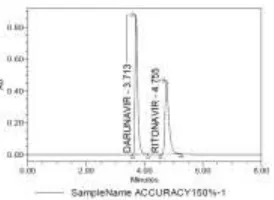
Figure 18: Accuracy chromatogram 1 (50%)
Figure 19: Accuracy chromatogram 2 (100%)
Figure 20: Accuracy chromatogram 3 (150%)
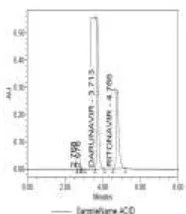
Degradation study
The tablet sample solution (daruanvir - 400 µg/ml and ritonavir - 50 µg/ml) was subjected to degradation by acid, base, oxidant, water, thermal
and photo conditions. This experiment demonstrates the specificity, stability indicating nature and stability of ritonavir and darunavir under different applied conditions.
Table 8: Darunavir and ritonavir degradation data
Condition Percent assay Percent degradation
Darunavir Ritonavir Darunavir Ritonavir
0.1 N HCl 86.17 86.55 13.83 13.45
0.1N NaOH
87.07 87.98 12.93 12.02
30% H2O2 90.51 89.77 9.49 10.23
105oC 86.19 84.67 13.81 15.33
Sunlight 89.91 89.02 10.09 10.98
Water 93.24 91.89 6.76 8.11
Figure 21: Acid degraded sample chromatogram
Figure 22: Base degraded sample chromatogram
Figure 23: Oxidant degraded sample chromatogram
Figure 24: Thermal degraded sample chromatogram
Figure 26: Water degraded sample chromatogram
Robustness test
Robustness test is done to check whether the system suitability parameter values of ritonavir and darunavir remains stable when minor changes made in the chromatographic conditions like:
Flow rate –1.0 ±0.1 ml/min
Mobile phase ratio - ±5% organic phase
Temperature - 25˚C ±2 oC
Detection wavelength – 275 nm ± 2 nm
The values in the table showed no significant changes in the system suitability parameter values of ritonavir and darunavir determined when minor changes made in above said conditions. Therefore the method is robust.
Table 9: System suitability values for darunavir and ritonavir while testing robustness
Parameter Analyzed value TP PA Res
Darunavir
Flow rate (ml/min) 1.0 - 0.1 8302 1.54 -
1.0 + 0.1 8930 1.56 -
Detection wavelength (nm) 275 - 2 9200 1.56 -
275 + 2 9649 1.55 -
Mobile phase ratio (v/v) 70:30 8302 1.54 -
60:40 9258 1.60 -
Temperature (oC) 25˚C + 2 oC 9258 1.60 -
25˚C - 2 o
C 9541 1.63 -
Ritonavir
Flow rate (ml/min) 1.0 - 0.1 6469 1.52 4.99
1.0 + 0.1 6907 1.54 5.11
Detection wavelength (nm) 275 - 2 6937 1.62 5.21
275 + 2 7251 1.59 5.33
Mobile phase ratio (v/v) 70:30 6469 1.52 4.99
60:40 7062 1.60 5.16
Temperature (oC) 25˚C + 2 oC 7062 1.60 5.16
25˚C - 2 oC 7376 1.61 5.33
TP - theoreticalplates ; PA - peak asymmetry; Res - resolution
CONCLUSION
This investigational project describes a simple and rapid stability indicating method for the combined assay of ritonavir and darunavir in tablets and bulk form. While degradation Study, no substantial interfering peaks are seen in chromatograms of all tested degradation conditions
at the retention time of ritonavir and darunavir. The proposed method finely fulfilled the validation parameter required criteria. Consequently, this quantitative RP-HPLC method can be utilized in routine analysis of ritonavir and darunavir in tablets and for stability studies of ritonavir and darunavir in tablets.
REFERENCES
[1]. Friedman-Kien A, Laubenstein L, Marmor M, Hymes K, Green J, Ragaz A, Gottleib J, Muggia F, Demopoulos R, Weintraub M. Kaposi's sarcoma and Pneumocystis pneumonia among homosexual men --New York City and California. MMWR Morbility and Mortal Wkly Rep. 30, 1981, 305 –308.
[2]. Sharp PM, Hahn BH. Origins of HIV and the AIDS pandemic. Cold Spring Harbor Perspectives in Medicine. 1 (1), 2011, 006841.
[3]. Barin F, M'Boup S, Denis F, Kanki P, Allan JS, Lee TH, Essex M. Serological evidence for virus related to simian T-lymphotropic retrovirus III in residents of west Africa. Lancet, 2 (10), 1985, 1387–1389. [4]. Dellar R, Karim QA. Handbook of Public Health in Natural Disasters: Nutrition, Food, Remediation and
Preparation, 1st edition. Vol. 10. Wageningen, Netherlands: Wageningen Academic Publishers, HIV/AIDS food insecurity, and undernourishment: amplifying cycles of risk in vulnerable populations, 2015, 537 – 562.
[5]. Eaton JW, Hallett TB, Garnett GP. Concurrent sexual partnerships and primary HIV infection: A critical interaction. AIDS Behavior, 15(4), 2011, 687–692.
[6]. WHO: Global summary of the HIV/AIDS epidemic, December 2014.
[7]. De ClercqE.The nucleoside reverse transcriptase inhibitors, nonnucleoside reverse transcriptase inhibitors, and protease inhibitors in the treatment of HIV infections (AIDS). Advances in Pharmacology, 6 7, 2013, 317-358.