IJPAR |Vol.7 | Issue 3 | July - Sep -2018 Journal Home page: www.ijpar.com
Research article Open Access
Development and in vivo evaluation of solid dispersions containing
nifedipine
G. Muralichand
1, D.V. R. N. Bhikshapathi
2* 1Research Scholar, Mewar University, Chittorgarh, Rajasthan, India
2Research Supervisor, Mewar University, Chittorgarh, Rajasthan, India
*Corresponding Author:D.V. R. N. Bhikshapathi
ABSTRACT
The main aim of this investigation was to develop and in vivo evaluation solid dispersions of Nifedipine which has low aqueous solubility and bioavailability. Preliminary solubility studies were carried out using various hydrophilic polymers. Formulation with 1:4:2 ratios of Nifedipine, Labrosol and SLS was found to be the best as it possessed better drug release properties compared to pure drug and other physical mixtures. The optimized formulation SD12 was found to have better drug release of 98.74±5.19% in 90 minutes. From FTIR studies no interaction was takes place between drug and polymers. XRD peaks indicate the successful transformation of drug from crystalline to amorphous form. From in vivo bioavailability studies, Cmax of the optimized formulation SD12 was 4.14±0.06ng /ml,
was significantly higher as compared to pure drug suspension, i.e., 2.88±0.32ng/ml. Tmax of optimized formulation
was decreased significantly when compared with pure drug (1.00±0.04hr, 2.00±0.05hr), AUC0-inf and AUC0-t for
optimized solid dispersion formulation was significantly higher (p<0.05) as compared to pure drug suspension. The present study demonstrated that formulation of Nifedipine solid dispersion by solvent evaporation technique is a highly effective strategy for enhancing the bioavailability of poorly water soluble Nifedipine.
Keywords:
Nifedipine, Solid dispersions, Hypertension, Solubility, Bioavailability.INTRODUCTION
Bioavailability of drugs having poor water solubility is limited because of their solubility and dissolution rate. Numerous studies have been carried out to increase the dissolution rate of such drugs [1]. One such research outcome was solid dispersions that showed promising results in improving solubility, wettability, drug dissolution rate and therefore its bioavailability [2]. In solid
dispersion formulation, the particle size of drug is reduced to fine or molecular form. The crystalline drug is converted into amorphous form which increases wettability of the formulation [3]. Several poorly soluble drugs like Ketoprofen [4], Nimodipine [5] and Tenoxicam [6] have been successfully formulated to solid dispersions.
Nifedipine is a calcium channel blocker mainly used for treatment of hypertension. It reduces the risk of fatal and nonfatal cardiovascular events,
primarily strokes and myocardial infarctions [7]. There are fewer products available commercially for solid dispersions in spite of numerous advantages [8]. In solid dispersions, the drug is dispersed in a fine crystalline or amorphous form in the matrix which when exposed to aqueous media disperses the drug as fine colloid particles [9].
Various methods have been designed for the formulation of solid dispersions. They are fusion/ melting, solvent evaporation, lyophilization (freeze drying), melt agglomeration process, extrusion method, spray dry method, use of surfactants, electro static spinning and super critical fluid technology. Solvent evaporation method is most convenient for formulation of solid dispersions without much hassle. It employs an organic solvent to dissolve and disperse the drug and carrier molecule. Use of large volume of solvent formulation may sometimes pose difficulty in removing it and also may lead to toxicity [10, 11]. Thus, small amounts of easily volatile solvents may be used.
MATERIALS AND METHODS
Materials
Nifedipine pure drug was generous gift from Aurobindo Pharma Ltd, Hyderabad, India. Kleptose HPB, Poloxamer 407 and PEG 8000 were obtained from BASF, Mumbai. Kolliwax GMS II, Labrosol, Kolliphor RH 40, Avicel PH 102 and Colloidal Silicone dioxide (Aerosil 200) were obtained from Signet Chemical Corp. Pvt. Ltd., Mumbai. Soluplus was gifted by BASF, Germany. Urea and PVP K-30 were gifted by Dow
Chemicals, USA. All other chemicals used were of analytical grade.
Preliminary solubility studies of nifedipine
Solubility measurements of Nifedipine were performed according to a published method given by Higuchi and Connors in 1965 [12]. An excess amount of Nifedipine was added to 25ml of aqueous solution of water soluble carriers like Urea, PEG 8000, Labrosol, Soluplus, Kolliphor RH 40, Kolliwax GMS II, Poloxamer 407, Kleptose HPB, Colloidal Silicone dioxide (Aerosil 200), and PVPK-30 in screw capped bottles. Samples were shaken for the 24 hours at room temperature. Subsequently, the suspensions were filtered through a Whatman filter paper no 1. Filtered solution was diluted with methanol and analyzed for the Nifedipine at UV 338 nm [13].
Preparation of nifedipine solid dispersion by
the solvent evaporation method
The calculated amount of Nifedipine and the employed polymers of Labrosol, Soluplus, Kolliphor RH 40, Kolliwax GMS II and SLS in different drug, polymer and surfactant ratios of 1:1:0.5, 1:2:1, 1:3:1.5 and 1:4:2 (Shown in table 1) are weighed and mixed together in a porcelain dish. Sixteen different formulae were prepared by the solvent evaporation method. The mixture was dissolved in small amount of methanol. Then the solvent was evaporated in oven at temperature 50ºC until complete evaporation. The solid dispersions prepared were pulverized in a mortar and sieved. The fraction of the powder that passed through 45 μm was stored in a desiccator and utilized for further study.
Table 1: Composition of Nifedipine solid dispersions Ingredients & formulation ratios Nifedipine (mg) Kolliwax GMS (mg) Kolliphor RH 40(mg) Labrasol (mg)
Soluplus SLS (mg)
Methanol (mL)
SD11:1:0.5 30 30 - - - 15 Qs
SD2 1:2:1 30 60 - - - 30 Qs
SD3 1:3:1.5 30 90 - - - 45 Qs
SD4 1:4:2 30 120 - - - 60 Qs
SD5 1:1:0.5 30 - 30 - - 15 Qs
SD6 1:2:1 30 - 60 - - 30 Qs
SD8 1:4:2 30 - 120 - - 60 Qs
SD9 1:1:0.5 30 - - 30 - 15 Qs
SD10 1:2:1 30 - - 60 - 30 Qs
SD11 1:3:1.5 30 - - 90 - 45 Qs
SD12 1:4:2 30 - - 120 - 60 Qs
SD13 1:1:0.5 30 - - - 30 15 Qs
SD14 1:2:1 30 - - - 60 30 Qs
SD15 1:3:1.5 30 - - - 90 45 Qs
SD16 1:4:2 30 - - - 120 60 Qs
Evaluation of nifedipine solid dispersions
Solid dispersions obtained by solvent evaporation method were tested for their percentage practical yield, drug content, FTIR, SEM, XRD, in-vitro release and stability studies.
In vitro
dissolution study of solid dispersion
The USP dissolution test type II apparatus (Electrolab TDT- 06 N, India) was used. Amount of samples equivalent to 16 mg of drug were dispersed into the dissolution vessel containing 900 mL of 0.1 N HCL with pH 1.2 at 37°C and stirred at 50 rpm. Samples were withdrawn periodically, filtered and replaced with a fresh dissolution medium. After filtration through 0.45 μm microfilter, concentration of Nifedipine was determined spectrophotometrically at λ max 338 nm [14].
Characterization
FTIR studies
The FTIR studies were conducted according to the reported method [15].
Powder x-ray diffraction (XRD)
X-ray powder diffraction patterns were recorded on an X-ray powder diffraction system (Shimadzu, Japan) using copper target, a voltage of 40 Kv and a current of 30 mA [16]. The scanning was done over 2_ range of 5º to 60º [17].
Sem (scanning electron microscope) studies
The surface morphology of the layered sample was examined by SEM (Hitachi, Japan). A small amount of powder was manually dispersed onto a carbon tab (double adhesive carbon coated tape) adhered to aluminum stubs. These sample stubs were coated with a thin layer (30Å) of gold by
employing POLARON-E 3000 sputter coater. The samples were examined by SEM and photographed under various magnifications with direct data capture of the images onto a computer [18].
Stability studies
The optimized solid dispersions were placed inside sealed 40cc HDPE container with child resistant cap under controlled temperature environment inside stability chamber (Thermo Lab, India) with relative humidity of 75%±5%RH and temperature of 40 0C±20C for stability studies. Samples were removed after 1, 2 and 3 months and evaluated for percent drug content and in vitro dissolution studies [19].
IN VIVO
STUDIES
Animal preparation
Healthy male Wistar rats were (weighing approximately 250±25 g) selected for this study, all the animals were healthy during the period of the experiment. All efforts were made to maintain the animals under controlled environmental conditions (Temperature 250C±20C, Relative Humidity 45%±5%RH and 12 h alternate light and dark cycle) with 100 % fresh air exchange in animal rooms, uninterrupted power and water supply. Rats were fed with standard diet and water ad libitum.
Pharmacokinetic studies [20]
animals. First group was administered Nifedipine (as such) suspension was prepared in 0.5% w/w of HPMC 2.5cPs, second group was administered optimized preparation of solid dispersion suspension was prepared in 0.5% w/w of HPMC 2.5cPs by oral route at an equivalent dose of 20 mg/kg body weight.
About 500 µl of blood was withdrawn from retro orbital plexus at different time intervals such as 0.25, 0.50, 1.00, 1.50, 2.00, 2.50, 3.00, 4.00, 5.00, 6.00, 8.00, 12.00, 16.00, 20.00 and 24.00h. Blood samples were transferred into eppendorf tubes containing heparin in order to prevent blood clotting. The samples were centrifuged immediately at 4000 rpm and the plasma was stored in light-protected container at -20 0C till analysis.
Determination of nifedipine in rat plasma by
hplc method [21]
Analysis was performed on C18 (125 × 4.6 mm id, 5-µm particle) column with acetonitrile-10 mM phosphate buffer (pH 3.5) 60:40 (v/v) as mobile phase, started at a flow rate of 1 mL min-1 continued for 4 min and further 6 min at a flow rate of 2 mL/ min. UV detection was performed at 338 nm for Nifedipine (internal standard). Retention time, Rt(min) 3.12 (Nifedipine), 4.45 (internal standard)
Pharmacokinetic data analysis for optimized
preparation of solid
dispersions and pure
drug suspension:
The area under the drug concentration-time curve from zero to 24h (AUC) was calculated using the trapezoidal rule. The maximum plasma concentration of the drug (Cmax and the time to
reach Cmax (Tmax) was obtained directly from the
plasma profiles.
The pharmacokinetic parameters were performed by a non compartmental analysis using Win Nonlin 3.3® pharmacokinetic software (Pharsight Mountain View, CA USA). All values
are expressed as the mean±SD. Statistical analysis was performed with Graph Pad InStat software (version 3.00, Graph Pad Software, San Diego, CA, USA) using one-way analysis of variance (ANOVA) followed by Tukey–Kramer multiple comparison test. Difference with p<0.05 was considered statistically significant.
The bioavailability of the optimized preparation of solid dispersion was evaluated using rats.
RESULTS AND DISCUSSION
Preliminary solubility studies of nifedipine
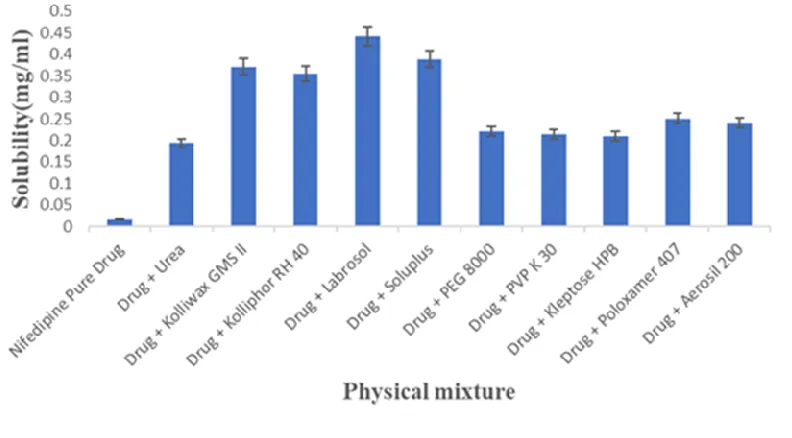
Initially preliminary solubility analysis was carried out to select the appropriate water-soluble carriers for the preparation of solid dispersion in which Nifedipine pure drug solubility was found to be 0.0177mg/ml. From this study, drug and Labrosol in the ratio of 1:1 exhibits highest drug solubility of 0.442±0.04mg/ml, almost 25-fold increase compared to that of pure drug. Among all the water-soluble carriers used, Urea, PEG 8000, PVP K 30, Kelptose HPB, Poloxamer 407, Aerosil 200 and Urea showed low solubility and therefore are not included in the preparation of Nifedipine solid dispersions.
EVALUATION PARAMETERS
Solubility
studies
of
nifedipine
solid
dispersions
Figure 1: Solubility studies of Nifedipine physical mixture
Figure 2: Solubility studies of Nifedipine solid dispersion
Percent practical yield and drug content
The formulation SD12 was found to have highest percent practical yield and percent drug
content of 98.82% and 99.04% respectively when compared with other formulations. The results are given in Table 2.
Table 2: Percent Practical yield and drug content for Nifedipine solid dispersions S. No Formulation % Practical Yield % Drug content
1 SD1 94.21±0.02 91.47±0.01
2 SD2 94.46±0.01 94.77±0.15
3 SD3 95.68±0.03 95.33±0.11
5 SD5 95.55±0.12 92.47±0.07
6 SD6 96.68±0.08 93.92±0.09
7 SD7 95.98±0.04 94.50±0.10
8 SD8 96.22±0.02 94.52±0.13
9 SD9 95.87±0.09 96.53±0.15
10 SD10 96.26±0.14 96.86±0.17
11 SD11 96.99±0.05 96.97±0.03
12 SD12 98.82±0.14 99.04±0.13
13 SD13 93.87±0.31 92.43±0.05
14 SD14 94.27±0.15 93.37±0.09
15 SD15 95.26±0.09 94.52±0.07
16 SD16 96.28±0.10 95.08±0.03
In vitro dissolution studies
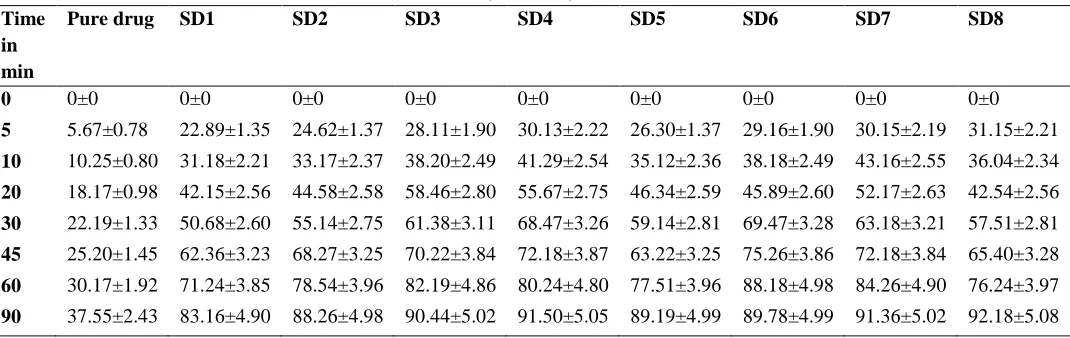
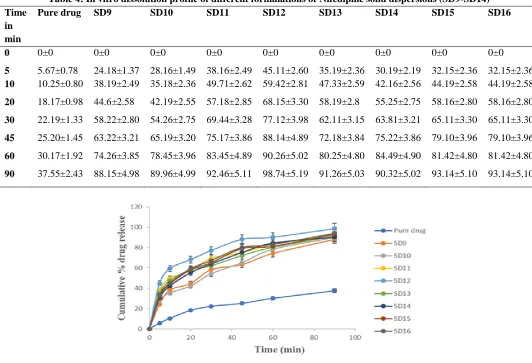
The drug release data obtained for formulations SD1-SD16 are tabulated in tables 5 and 6 which represent the cumulative percent drug released as a function of time for all formulations. In vitro studies reveal that there is marked increase in the dissolution rate of Nifedipine from all the solid dispersions when compared to pure Nifedipine
itself. From the in vitro drug release profile, it can be seen that formulation SD12 containing Nifedipine, Labrosol and SLS in 1:4:2 ratio shows higher dissolution rate of 98.74±5.19 compared with other formulations. The graphical representation of solid dispersions of SD1- SD16 with pure drug is shown in Figures 3 and 4.
Table 3: In vitro dissolution profile of pure drug and different formulations of Nifedipine solid dispersions (SD1-SD8)
Time in min
Pure drug SD1 SD2 SD3 SD4 SD5 SD6 SD7 SD8
0 0±0 0±0 0±0 0±0 0±0 0±0 0±0 0±0 0±0
5 5.67±0.78 22.89±1.35 24.62±1.37 28.11±1.90 30.13±2.22 26.30±1.37 29.16±1.90 30.15±2.19 31.15±2.21
10 10.25±0.80 31.18±2.21 33.17±2.37 38.20±2.49 41.29±2.54 35.12±2.36 38.18±2.49 43.16±2.55 36.04±2.34
20 18.17±0.98 42.15±2.56 44.58±2.58 58.46±2.80 55.67±2.75 46.34±2.59 45.89±2.60 52.17±2.63 42.54±2.56
30 22.19±1.33 50.68±2.60 55.14±2.75 61.38±3.11 68.47±3.26 59.14±2.81 69.47±3.28 63.18±3.21 57.51±2.81
45 25.20±1.45 62.36±3.23 68.27±3.25 70.22±3.84 72.18±3.87 63.22±3.25 75.26±3.86 72.18±3.84 65.40±3.28
60 30.17±1.92 71.24±3.85 78.54±3.96 82.19±4.86 80.24±4.80 77.51±3.96 88.18±4.98 84.26±4.90 76.24±3.97
Figure 3: In vitro dissolution profile of pure drug and different formulations of Nifedipine solid dispersions (SD1-SD8)
Table 4: In vitro dissolution profile of different formulations of Nifedipine solid dispersions (SD9-SD14) Time
in min
Pure drug SD9 SD10 SD11 SD12 SD13 SD14 SD15 SD16
0 0±0 0±0 0±0 0±0 0±0 0±0 0±0 0±0 0±0
5 5.67±0.78 24.18±1.37 28.16±1.49 38.16±2.49 45.11±2.60 35.19±2.36 30.19±2.19 32.15±2.36 32.15±2.36 10 10.25±0.80 38.19±2.49 35.18±2.36 49.71±2.62 59.42±2.81 47.33±2.59 42.16±2.56 44.19±2.58 44.19±2.58
20 18.17±0.98 44.6±2.58 42.19±2.55 57.18±2.85 68.15±3.30 58.19±2.8 55.25±2.75 58.16±2.80 58.16±2.80
30 22.19±1.33 58.22±2.80 54.26±2.75 69.44±3.28 77.12±3.98 62.11±3.15 63.81±3.21 65.11±3.30 65.11±3.30
45 25.20±1.45 63.22±3.21 65.19±3.20 75.17±3.86 88.14±4.89 72.18±3.84 75.22±3.86 79.10±3.96 79.10±3.96
60 30.17±1.92 74.26±3.85 78.45±3.96 83.45±4.89 90.26±5.02 80.25±4.80 84.49±4.90 81.42±4.80 81.42±4.80
90 37.55±2.43 88.15±4.98 89.96±4.99 92.46±5.11 98.74±5.19 91.26±5.03 90.32±5.02 93.14±5.10 93.14±5.10
Characterization
Ftir studies
FTIR spectroscopy of Nifedipine was performed to identify the supplied pure drug and find out any possible interactions between drug and the polymers. FTIR study of Nifedipine showed the peak at 3250.26, 1677.21, 1224.14, 1119.06, 1018.86 and 711.14 cm-1 due to the functional group like C-H, C=C, O-H, C-C, C˗O
and N-H respectively. The physical mixture of drug and polymer also retained the same peak indicating no interaction between the selected drug and the polymers. The FTIR spectra of nifedipine and polymer mixture are shown in figures 5, 6 and 7. Here, the N-H stretching in secondary amine groups of Nifedipine confirm the formation of hydrogen bonding between Nifedipine and water molecules.
Figure 5: FTIR spectrum of Nifedipine pure drug
Figure 7: FTIR spectrum of optimized formulation of Nifedipine SD12
X-ray diffraction patterns
The Nifedipine solid dispersions were studied for XRD to know whether the solid dispersions are crystalline or amorphous. The presence of numerous distinct peaks in the XRD spectrum of pure Nifedipine indicates that Nifedipine was
present as a crystalline material (Figure 8). On the other hand, the spectrum of optimized formulation SD12 was characterized by the complete absence of any diffraction peak, which is characteristic of an amorphous compound.
(Figure 9). The enhancement in the dissolution rate of the drug from the drug-Labrosol-SLS solid dispersion is because of marked reduction in the crystallinity of the drug.
Figure 9: X-Ray diffractograms of Nifedipine optimized formulation SD12
Sem studies
SEM photographs for pure drug and optimized formulation SD12 are shown in figures 10 and 11. The drug crystals seemed to be smooth-surfaced, irregular in shape and size. For solid dispersions, it was difficult to distinguish the presence of drug crystals. The drug surface in solid dispersion seems
to be more porous in nature. Solid dispersions appeared as a homogeneous mass with wrinkled surface. Drug crystals appeared to be incorporated into the particles of the polymers. The solid dispersion looked like matrix particles. This could be due to dispersion of the drug in the molten mass of the polymer.
Figure 11: Nifedipine optimized formulation SD12
Stability studies
Stability studies of SD12 formulation was performed for drug content and In vitro drug release studies for 3 months at accelerated stability conditions as per ICH guidelines. The optimized formulation was stable during 3months period. From these results it was concluded that the formulation was stable and retained most of its properties with minor differences.
In vivo
bioavailability studies
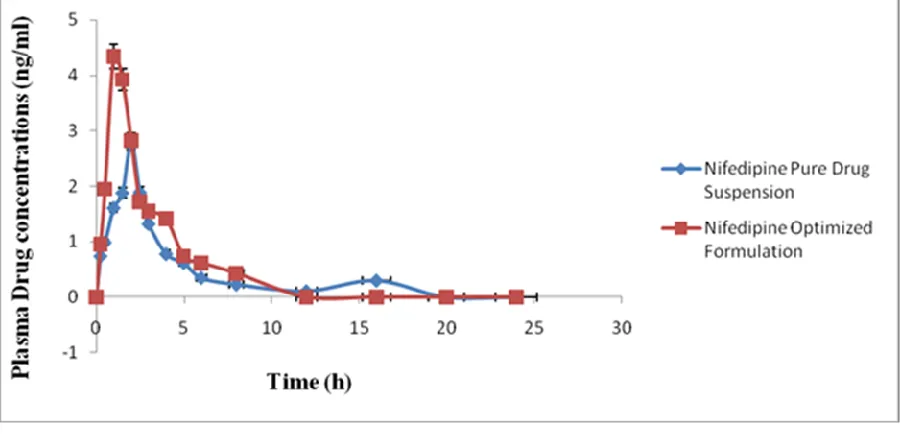
The Nifedipine plasma concentrations in rats treated with optimized preparation of solid dispersion was significantly higher than those treated with pure drug suspension. Plasma pharmacokinetic parameters of Nifedipine after oral administration of the formulation to Wister rats are shown in Table 5. Based on the results, it was clearly evident that Nifedipine from a solid dispersion was significantly increased in comparison with that of the pure drug (Nifedipine suspension). Cmax of the optimized preparation of
solid dispersion was 4.14±0.06ng /ml, was
significantly higher as compared to Cmax of the pure
drug suspension, i.e., 2.88±0.32ng/ml. Tmax of
optimized preparation of solid dispersion, pure drug suspension was 1.00±0.04hr, 2.00±0.05hr respectively, AUC is an important parameter in evaluating bioavailability of drug from dosage form, as it represents the total integrated area under the blood concentration time profile and represents the total amount of drug reaching the systemic circulation after oral administration. AUC0-inf for
optimized solid dispersion formulation was slightly higher (14.05±1.45ng h/ml) than significantly higher than AUC0-inf of the pure drug suspension
10.85±1.24ng h/ml. Statistically, AUC0-t of the
optimized preparation of solid dispersion was significantly higher (p<0.05) as compared to pure drug suspension. Higher amount of drug concentration in blood indicated better systemic absorption of Nifedipine from optimized solid dispersion formulation as compared to the pure drug suspension.
Table 5: Pharmacokinetic Parameters of Nifedipine Optimized Solid dispersion and Nifedipine pure drug Pharmacokinetic Parameters Nifedipine Pure drug Nifedipine solid dispersion
C max (ng/ml) 2.88±0.32 4.14±0.06
AUC 0-t (ng h/ml) 7.62±1.55 9.54±1.74
AUC 0-inf (ng h/ml) 10.85±1.24 14.05±1.45
T max (h) 2.00±0.05 1.00±0.04
Figure 12: Plasma concentration–time curves for the Nifedipine optimized formulation and pure drug suspension
CONCLUSION
Solid dispersions of Nifedipine were prepared by solvent evaporation method using hydrophilic polymer Labrosol and SLS as a surfactant. The type and amount of carrier was found to be important in increasing the solubility of Nifedipine. The in-vitro dissolution and kinetic modelling studies indicate that solid dispersions are one of the best methods to enhance the oral solubility and bioavailability of Nifedipine. From in vivo bioavailability studies, Cmax of the optimized formulation SD12 was
4.14±0.06ng /ml, was significantly higher as
compared to pure drug suspension, i.e., 2.88±0.32ng/ml. Tmax of optimized formulation was
decreased significantly when compared with pure drug (1.00±0.04hr, 2.00±0.05hr), AUC0-inf and
AUC0-t for optimized solid dispersion formulation
was significantly higher (p<0.05) as compared to pure drug suspension. The present study demonstrated that formulation of Nifedipine solid dispersion by solvent evaporation technique is a highly effective strategy for enhancing the bioavailability of poorly water soluble Nifedipine.
REFERENCES
[1]. Venkat YB, AdhikraoVY. Enhancement of solubility and dissolutionrate of BCS class II pharmaceuticals by no naquious granulation technique. International Journal of Pharma Research and Development. 1, 2010, 1‐12. [2]. SerajuddinATM. Solid dispersions of poorly water‐soluble drugs early promises, subsequent problems and
recent breakthroughs. J. Pharm. Sci. 88, 1999, 1058‐1066.
[3]. Christian L, Jennifer D. Improving drug solubility for oral delivery using solid dispersions. Eur. J. Pharm. Biopharm. 50, 2000, 47‐ 60.
[4]. Rogers JA, Anderson AJ. Physical characteristics and dissolution profiles of ketoprofen‐urea solid dispersions. Pharmaceutical Acta Helvetiae.57, 1982, 276‐281.
[5]. Murali Mohan Babu GV, Prasad CHDS, Ramana Murthy KV. Evaluation of modified gum karaya as carrier for the dissolution enhancement of poorly water soluble drug nimodipine. Int. J. Pharm.1,2002, 34:117. [6]. El‐Gazayerly ON. Characterization and evaluation of Tenoxicam co precipitates. Drug Dev. Ind. Pharm. 26,
2000, 925‐930.
[7]. https://www.drugs.com/dosage/nifedipine.html
[9]. Chiou WL, Riegelman S. Pharmaceutical applications of solid dispersion systems. J Pharm Sci. 60(9), 197, 1281-302.
[10]. Butler, Mattew J. Method of producing a solid dispersion of a poorly water-soluble drug. 1999.
[11]. Kim EJ, Chun MK, Jang JS, Lee I H, Lee KR, Choi HK. Preparation of a solid dispersion of Felodipine using a solvent wetting method. Eur J pharm Biopharm. 64(2), 2006, 200-5.
[12]. Higuchi T, Connors K. Phase-solubility techniques. Adv Anal Chem Instrum. 4,1965,117-212.
[13]. Chen S, Zhu J, Ma F, Fang Q, Li Y. Preparation and characterization of solid dispersions of dipyridamole with a carrier copolyvidonum Plasdone S-630. Drug Dev Ind Pharm.33 (8), 2007, 888-99.
[14]. Valizadeh H, Nokhodchi A, Qarakhani N. Physicochemical characterization of solid dispersions of nifedipine with PEG 6000, Myrj 52, lactose, sorbitol, dextrin, and Eudragit E100. Drug Dev Ind Pharm. 30(3), 2004, 303-17.
[15]. Yang M, Wang P, Huang CY. Solid dispersion of acetaminophen and poly (ethylene oxide) prepared by hot-melt mixing. Int J Pharm. 395(1-2), 2010, 53-61.
[16]. Chaulang G, Patel P, Hardikar S, Kelkar M, Bhosale A, Bhise S. Formulation and Evaluation of Solid Dispersions of Furosemide in Sodium Starch Glycolate. Tropical Journal of Pharmaceutical Research. 8(1), 2009, 43-51.
[17]. Shamma RN, Basha M. A novel polymeric solubilizer for optimization of Carvedilol solid dispersions. Formulation design and effect of method of preparation. Powder Technology. 237, 2013, 406–414.
[18]. Breitenbach J. Melt extrusion from process to drug delivery technology. Eur J Pharm Biopharm. 54, 2002, 107– 117.
[19]. Dhirendra K, Lewis S, Udupa N. Solid Dispersions: A Review. Pak. J. Pharm. Sci. 22(2), 2009, 234-246. [20]. Eun-Sol H, Gwang C, Ihwan B, Min Kim S. Formulation Characterization and in Vivo Evaluation of
Celecoxib-PVP Solid Dispersion Nanoparticles Using Supercritical Antisolvent Process. Molecules. 19, 2014, 20325-20339.