Tribology in Industry
www.tribology.rsFrictional Study of Al 6061 Red-Mud Composite
under the Influence of Different Process Parameters
N. Panwar
a, S. Saini
b, A. Chauhan
ba Department of Mechanical engineering, NIT Srinagar, India,
b Department of Mechanical engineering, UIET, Panjab university, Chandigarh, India.
Keywords:
Metal matrix composite Red mud
Aluminium 6061 Stir casting Taguchi technique ANOVA
A B S T R A C T
Metal matrix composite having aluminium 6061 as matrix incorporating red mud reinforcement has been casted by employing stir casting. Scanning electron microscopy images has been taken to observe the uniformity of the red-mud reinforcement in the aluminium 6061 matrix. The inclusion of reinforcement inside the matrix of the fabricated composite has been confirmed by Energy dispersive spectroscopy. The results reveal that the coefficient of friction increases by larger sliding distance and decreases in response to higher sliding velocity. Also, coefficient of friction first increase up to second level with increase in applied load after that continuously reduced with further applying higher load. Study reveals that the coefficient of friction has been minimum at 125 micrometer particle size and has maximum value at 250 micrometer. Delta analysis shows percentage reinforcement has least effect on output i.e. coefficient of friction. Further, coefficient of friction decreases with higher aging time but again increases for 24 hour aging time. The ANOVA analysis concludes, the parameters i.e. aging time, sliding distance, sliding speed have found significant effect but the impact of particle size and load have been not comes out significant. The ANOVA revealed descending order of significance for the studied parameters has been: sliding speed, aging time, sliding distance, particle size and load.
© 2019 Published by Faculty of Engineering Corresponding author:
Amit Chauhan
Department of Mechanicalengg. UIET, Panjab university, Chandigarh, India.
E-mail:[email protected]
1. INTRODUCTION
Aluminum including its alloys when reinforced mostly by harder ceramic reinforcements has been known as aluminium matrix composites (AMC) [1-3]. Unreinforced aluminium alloys have been not able to meet the changingrequirements of current era. AMCs have better properties then their monolithic parent alloy such as higher stiffness, improved
strength, better wear behaviour, more strength-to-weight ratio, higher tensile strength etc. this makes AMCs preferable over aluminum and their alloys [4-6]. Among Al-alloys, 6061Al-alloy is widely used. A number of materials such as SiC, Al2O3, B4C, TiB2, ZrO2, SiO2 and graphite are being used as reinforcements to improve the properties of 6061Al alloy [7-9]. Type of reinforcements and methods of fabrication influences the properties of aluminum
R
ES
EA
R
composites. AMC due to their superior properties comes out as important materials for aerospace, auto, defence, and other industrial applications [10-12]. Most often used reinforcements with aluminium has been SiC, TiB2, B4C, AL2O3, TiO2, Gr,CNT, SiO2, Fly-ash,
bagasse-ash, rise husk-ashetc. Reinforcement included in a matrix may contain single, two or more materials [13-19]. Many fabrication techniques have been used for fabricating AMCs. These methods include powder metallurgy, diffusion bonding, squeeze casting, compo casting, stir casting physical vapour deposition etc. Stir casting has been proffered because of its simplicity and economy [20-25]. Design of experiment (DOE) has been employed to examine the influence of selected variables on output with reduced number of experiments. Taguchi methods have been applied mostly to study any product or process, influencing variables and their effect with minimum possible variation. The orthogonal array, signal-to-noise ratio and analysis of variance have been employed by researches to find optimum input variables in composite [26-30].
In this study friction behaviour of fabricated aluminium 6061 matrix based red mud composite has been studied and reported in detail. Coefficient of friction of composite has been measured on pin on disc type friction and wear monitor and the results has been reported. S/N ratio and mean values of results has been calculated using minitab software for further analysis. Delta and ANOVA analysis of mean and S/N ratio has been done to reveal the effect of input parameters upon wear and coefficient. Mathematical model for wear and coefficient of friction has been developed and the predicted results have been reported.
2. METHOD
2.1 Material preparation
Al6061 which has been available commercially, chosen as matrix. Material has been purchased from the market in the form of rods and angles. X-ray fluorescence (XRF) spectroscopy of purchased aluminum 6061 has been done at institute laboratory to find out composition of constituents. XRF results of purchased material have been shown in Table 1, gives the
composition of aluminum 6061. The Purchased rods and angles have been cut into small pieces before melting. Red Mud powder has been the reinforcement material and is procured from HINDALCO plant, situated at Renukut town, in Utter Pradesh state of India. The procured red-mud have been dried and crushed. Different particle size of red-mud has been separated by using standard sieves. Five different sizes of red mud have been separated.
Table 1. Constituents of aluminum 6061 and red mud obtained by XRF analysis.
XRF Result for aluminium 6061
Sr. no. Element Percentage
1 Al 97.6
2 Mg 0.79
3 Si 0.72
4 Mn 0.32
5 Cu 0.28
6 Fe 0.16
7 Cl 0.04
8 Ti 0.02
9 Cr 0.02
10 K 0.02
11 Ga 0.02
12 Zn 0.01
13 S 67PPM
14 N 66PPM
15 V 48PPM
XRF result for red mud
Sr. no Element Percentage
1 Fe2O3 35.26
2 Al2O3 21.89
3 TiO2 15.11
4 SiO2 12.46
5 Na2O 11.82
6 CaO 1.83
7 P2O5 0.40
8 V2O5 0.38
9 SO2 0.19
10 ZrO2 0.15
11 K2O 0.13
12 MgO 0.12
13 Cr2O3 0.11
14 Cl 0.04
15 MnO 0.04
16 CuO 0.02
17 Sc2O3 0.01
18 Ga2O3 0.01
19 Nb2O5 0.01
20 ZnO 65PPM
21 Ag 56PPM
22 PbO 47PPM
23 As2O3 45PPM
24 NiO 44PPM
25 SrO 43PPM
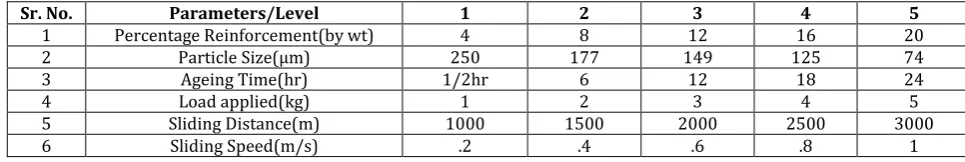
Table 2. Selected input Parameters with their respective levels for friction studies.
Sr. No. Parameters/Level 1 2 3 4 5
1 Percentage Reinforcement(by wt) 4 8 12 16 20
2 Particle Size(µm) 250 177 149 125 74
3 Ageing Time(hr) 1/2hr 6 12 18 24
4 Load applied(kg) 1 2 3 4 5
5 Sliding Distance(m) 1000 1500 2000 2500 3000
6 Sliding Speed(m/s) .2 .4 .6 .8 1
2.2 Selection of Parameters and Orthogonal array Friction behaviour
To study the friction behaviour six parameters have been chosen as follows: percentage reinforcement (PR), Particle size (PS) in microns, aging time (AT) in Hours, Load applied (L) in kg, sliding distance (SD) in meters, sliding speed (SS) in meter per second. The response of studied parameters has been taken as coefficient of friction (COF). To reveal the impact of chosen input parameters on wear, five levels of each parameter have been considered.
Table 3. L25 Orthogonal array with five levels values and six factors values.
Exp no.
Reinfor cement
(%wt)
Particle size (µm)
Aging time (Hr)
Load
(kg) (m) SD Speed (m/s)
1 4 250 0.5 1 1000 0.2 2 4 177 6 2 1500 0.4 3 4 149 12 3 2000 0.6 4 4 74 18 4 2500 0.8 5 4 125 24 5 3000 1
6 8 250 6 3 2500 1
7 8 177 12 4 3000 0.2 8 8 149 18 5 1000 0.4 9 8 74 24 1 1500 0.6 10 8 125 0.5 2 2000 0.8 11 12 250 12 5 1500 0.8 12 12 177 18 1 2000 1 13 12 149 24 2 2500 0.2 14 12 74 0.5 3 3000 0.4 15 12 125 6 4 1000 0.6 16 16 250 18 2 3000 0.6 17 16 177 24 3 1000 0.8 18 16 149 0.5 4 1500 1 19 16 74 6 5 2000 0.2 20 16 125 12 1 2500 0.4 21 20 250 24 4 2000 0.4 22 20 177 0.5 5 2500 0.6 23 20 149 6 1 3000 0.8 24 20 74 12 2 1000 1 25 20 125 18 3 1500 0.2
L25 Orthogonal array (OA) has been chosen for conducting the experimentation. It has been a 5 level OA with maximum number of six factors. The maximum degree of freedom can be 24 for L25 orthogonal array. For friction behaviour six
factors has been considered for conducting the experiments. L25 OA for six factors and five levels has been shown in Table 3. The six factors have been taken from factor A to Factor-F. The five levels have been taken from Level-1 to Level-5. Reinforcement percentage by weight has been taken from 4 % to 20 % after reviewing literature [31-33].
2.3 Sample fabrication
The composite under this study has been manufactured by using stir casting process. Total number of fifty castings has been done according to L25 orthogonal array with a repetition of two. In accordance with the design of experiments quantity of matrix material and reinforcement has been taken for castings. Aluminium 6061 has been melted at 800 oC in a
crucible made from graphite using electric muffle furnace shown in Fig. 1.
For melting aluminium 6061 pieces in the form of rod and angles has cut and placed inside the crucible. Weight of the Aluminium 6061 and red mud reinforcement has been done at institute laboratory before melting. Mechanical stirrer has been inserted in molten alloy for creating vortex. Red mud reinforcement particles preheated at 400 oC in a separate furnace has
been injected to vortex [34]. Vortex has been created for obtaining uniform spreading of red mud in the aluminium matrix. Magnesium in a small quantity (1 %) has been incorporated in the mixture for getting improved wettability of red-mud particles with molten matrix material. The molten mixture has been poured inside preheated cylindrical mild steel moulds. The obtained castings have been machined further to prepare the samples for conducting different experiments and tests.
2.4 Heat treatment
Heat treatment of the fabricated samples has been done to improve properties and more accurate results. Homogenizing of prepared alumium composite has been performed to achieve uniformity inmaterial structure and better properties. In homogenizing samples has been heated to a temperature of 525oC for eight hours
inside electric furnace[35].Quenching of heated composite has been done by water. After those samples has been dried and used for further operation. Aging heat treatment of the composite has been performed in electric furnace. Aging has been done at a temperature of 175 ±5oC. Aging
time duration has been 0.5, 6, 12, 18 and 24 hrs. Aging duration of the composite samples has been taken from the L25 orthogonal array prepared for current study. After ageing sample has been allowed to cool down in the furnace.
2.5 SEM analysis
SEM images of fabricated samples have been shown in figures below. SEM images have been taken at a zoom of 1000X, 1200X, 2000X, 15000X and 45000X. Whitish colour particles visible in the images have been red mud. The dark gray area visible in the images has been aluminium 6061. It can be seeninside the images (Fig. 2) that reinforcemnt red-mud have been uniform in aluminium matrix. Some particle clustering has been seen in image of 16 % and 20 % reinforcement.
(a) 4 % red-mud
(b) 8 % red-mud
(c) 12 % red-mud
(e) 20 % red-mud
Fig. 2. SEM photographs of casted aluminum 6061 matrix red-mud reinforcement composite.
2.6 EDS analysis
The red-mud reinforcemnt constituents has been shown in Energy dispersive spectroscopy (EDS) spactrum of studied aluminum red-mud samples. The EDS Spectrum of sample has been shown in Fig. 3. EDS results reveals the presence of Calcium (Ca), Oxygen (O), Iron (Fe), Sodium (Na), Zinc (Zn), vanadium (W), silicon (Si), Titanium (Ti), potassium (k) etc. inside the matrix. Selected area for EDS spectrum has been shown at right side of each image. Obtained EDS spectrums showing different elements have been shown at left side of each image.
(a) Spactrum area
(b) EDS spactrum
Fig. 3. EDS analysis of aluminum matrix red-mud reinforcement composite.
2.7 FRICTION TEST
Friction test has been performed using pin-on-disk wear tester (Model: TR-20LE-PHM-CHM400 from DUCOM Bangalore) displayed in Fig. 4. ASTM G99 test standerd has been used to perform the test.
Fig. 4. Pin on disk type wear and friction monitor.
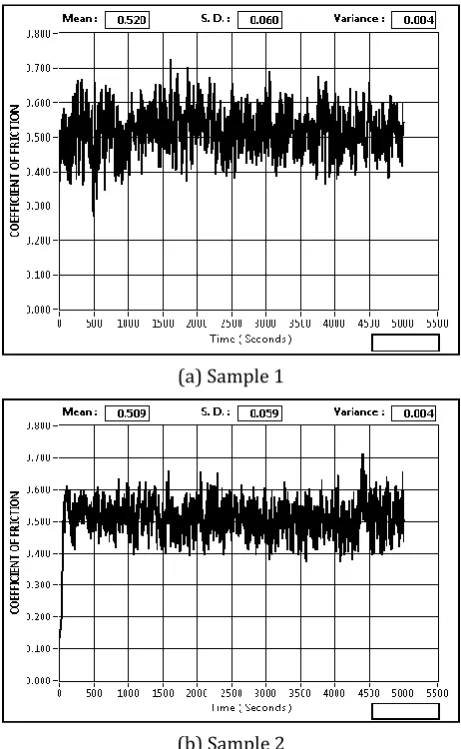
(a) Sample 1
(b) Sample 2
The equipment can be used for a wide range of loads up to 200 N and speed from 200 to 2000 rpm. The apparatus can be used to evaluate the friction and wear behaviour of a specimen under sliding contact for different test variations. The sliding contact happens to be between a stationary pin of composite samples under study and a movinghard material disc.The applied load that is normal to disk, rpm and track diameter on disk can be varied for a sample. Tangential force and wear have been observed using electronic sensors and recorded with computer. Studied parameters have been plotted as functions of load and speed. The disc is made up of EN-31 having a diameter of 100 mm and 8 mm thickness and a hardness value of 60 HRc (ground to surface roughness of 1.6 Ra). The specimens used are in the shape of cylindrical pin and have a diameter of 10 mm with 30 mm length. The mean coefficient of friction has been calculated by the computer software shown by Fig. 5.
3. RESULTS OF COEFFICIENT OF FRICTION
To evaluate the impact of selected input parameters on coefficient of friction, five levels have been considered. L25Taguchi OA has been
chosen for performing the experiments. Fifty number of experiments have been performedi.e. twice of each type shown in Taguchi OA. The calculated results for coefficient of friction have been reported in Table 4.
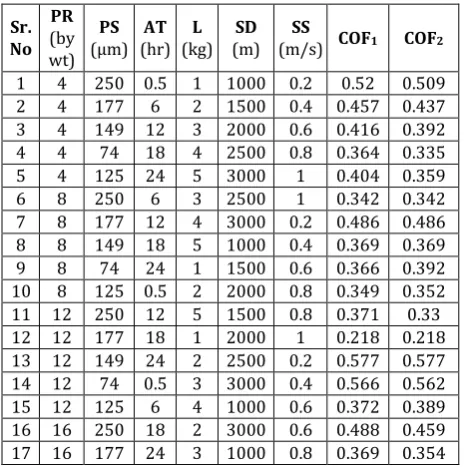
Table 4. Results of coefficient of friction for aluminum 6061 red-mud composite.
Sr. No PR (by wt) PS (µm) AT (hr) L (kg) SD (m) SS
(m/s) COF1 COF2 1 4 250 0.5 1 1000 0.2 0.52 0.509 2 4 177 6 2 1500 0.4 0.457 0.437 3 4 149 12 3 2000 0.6 0.416 0.392 4 4 74 18 4 2500 0.8 0.364 0.335 5 4 125 24 5 3000 1 0.404 0.359 6 8 250 6 3 2500 1 0.342 0.342 7 8 177 12 4 3000 0.2 0.486 0.486 8 8 149 18 5 1000 0.4 0.369 0.369 9 8 74 24 1 1500 0.6 0.366 0.392 10 8 125 0.5 2 2000 0.8 0.349 0.352 11 12 250 12 5 1500 0.8 0.371 0.33 12 12 177 18 1 2000 1 0.218 0.218 13 12 149 24 2 2500 0.2 0.577 0.577 14 12 74 0.5 3 3000 0.4 0.566 0.562 15 12 125 6 4 1000 0.6 0.372 0.389 16 16 250 18 2 3000 0.6 0.488 0.459 17 16 177 24 3 1000 0.8 0.369 0.354
18 16 149 0.5 4 1500 1 0.361 0.31 19 16 74 6 5 2000 0.2 0.518 0.425 20 16 125 12 1 2500 0.4 0.268 0.38 21 20 250 24 4 2000 0.4 0.508 0.528 22 20 177 0.5 5 2500 0.6 0.372 0.366 23 20 149 6 1 3000 0.8 0.41 0.37 24 20 74 12 2 1000 1 0.294 0.294 25 20 125 18 3 1500 0.2 0.422 0.422
In the table, values are given for percentage reinforcement (PR), Particle size (PS) in microns, aging time (AT) in Hours, Load applied (L) in kg, Sliding distance (SD) in meters, sliding speed (SS) in meter per second, coefficient of friction (COF) and Signal to noise ratio (S/N). Smaller is better criteria has been chosen for coefficient of friction study because smaller the friction more has been the utility of composite.
Table 5. Mean value of coefficient of friction and respective S/N ratio.
Sr. No PR (by wt) PS (µm) AT (hr) L (kg) SD (m) SS
(m/s) Mean S/N
1 4 250 0.5 1 1000 0.2 0.5145 5.7718 2 4 177 6 2 1500 0.4 0.4470 6.9917 3 4 149 12 3 2000 0.6 0.4040 7.8685 4 4 74 18 4 2500 0.8 0.3495 9.1236 5 4 125 24 5 3000 1 0.3815 8.3550 6 8 250 6 3 2500 1 0.3420 9.3195 7 8 177 12 4 3000 0.2 0.4860 6.2673 8 8 149 18 5 1000 0.4 0.3690 8.6595 9 8 74 24 1 1500 0.6 0.3790 8.4221 10 8 125 0 2 2000 0.8 0.3505 9.1062 11 12 250 12 5 1500 0.8 0.3505 9.0914 12 12 177 18 1 2000 1 0.2180 13.2309 13 12 149 24 2 2500 0.2 0.5770 4.7765 14 12 74 0 3 3000 0.4 0.5640 4.9744 15 12 125 6 4 1000 0.6 0.3805 8.3907 16 16 250 18 2 3000 0.6 0.4735 6.4895 17 16 177 24 3 1000 0.8 0.3615 8.8360 18 16 149 0 4 1500 1 0.3355 9.4611 19 16 74 6 5 2000 0.2 0.4715 6.4883 20 16 125 12 1 2500 0.4 0.3240 9.6613 21 20 250 24 4 2000 0.4 0.5180 5.7118 22 20 177 0 5 2500 0.6 0.3690 8.6592 23 20 149 6 1 3000 0.8 0.3900 8.1673 24 20 74 12 2 1000 1 0.2940 10.633 25 20 125 18 3 1500 0.2 0.4220 7.4938
4. DISCUSSION
4.1 Delta Analysis for coefficient of Friction
Delta analysis of the results has been done using Minitab software. Here, mean value of each parameter at each level has been calculated. Then the difference in maximum value of mean and minimum value of mean has been calculated. More has been the gap between the maximum mean and minimum mean of parameter more has been the influence of the parameter on output.
Table 6. Response Table for S/N Ratios for coefficient of friction.
Level Reinforcement (%by wt) Particle Size
(µm) Aging Time (hr) Load (kg) Sliding Distance (m) Speed (m/s) 1 7.622 7.928 7.595 9.051 8.458 6.160 2 8.355 8.601 7.872 7.599 8.292 7.200 3 8.093 7.787 8.704 7.698 8.481 7.966 4 8.187 8.797 8.999 7.791 8.308 8.865 5 8.133 7.277 7.220 8.251 6.851 10.20 Delta 0.733 1.520 1.779 1.451 1.630 4.040
Rank 6 4 2 5 3 1
Table 7. Response Table for Means of coefficient of friction.
Level Reinforcement (% by wt) Particle Size
(µm) Aging Time (hr) Load (kg) Sliding Distance (m) Speed (m/s) 1 0.4193 0.4116 0.4267 0.3651 0.3839 0.4942 2 0.3853 0.3717 0.4062 0.4284 0.3868 0.4444 3 0.4180 0.4151 0.3717 0.4187 0.3924 0.4012 4 0.3932 0.3763 0.3664 0.4139 0.3923 0.3604 5 0.3986 0.4397 0.4434 0.3883 0.4590 0.3142 Delta 0.0340 0.0680 0.0770 0.0633 0.0751 0.1800
Rank 6 4 2 5 3 1
The above Tables 6 and 7 displays the means of signal to noice ratios and mean values for coefficient of friction of the studiedaluminum red-mud composite at respective level. The above analysis concludes the sliding speed has highest influenceson the coefficient (rank 1) while percentage reinforcement has least effect (rank 6). Since the percentage reinforcement has least effect on output hence it is neglected for further analysis. Similar results have been reported by authors et al. [33].
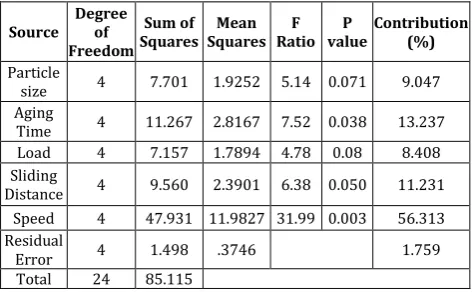
4.2 ANOVA Analysis for Coefficient of Friction
The ANOVA analysis found out that the parameter aging time, sliding distance, sliding speed have been significant but the impact of particle size and load are not significant enough. The significance order of the parameters has been Sliding speed, aging time, sliding distance, particle size and load.
Table 8. ANOVA table for coefficient of friction.
Source Degree of
Freedom Sum of
Squares Squares Mean Ratio F value P Contribution (%)
Particle
size 4 7.701 1.9252 5.14 0.071 9.047 Aging
Time 4 11.267 2.8167 7.52 0.038 13.237 Load 4 7.157 1.7894 4.78 0.08 8.408 Sliding
Distance 4 9.560 2.3901 6.38 0.050 11.231 Speed 4 47.931 11.9827 31.99 0.003 56.313 Residual
Error 4 1.498 .3746 1.759
Total 24 85.115
4.3 Estimation of optimum Coefficient of Friction
In this section optimum value of coefficient of friction and confidence interval of coefficient of friction have been predicted analytically by employing Taguchi’s technique. By recognising the effect of factors optimum value of coefficient of friction has been calculated.
The significant process parameters for weight loss due to wear have been SS1, SD1 and AT1. The mean
value of calculated coefficient of friction [37]:
𝑊µ = 𝑆𝑆1+ 𝑆𝐷5+ 𝐴𝑇4− 2𝑇µ (1)
where, Tµ is Average of all values of Coefficient
of Friction: 0.40288; SS5 Average value of
Coefficient of Friction at fifth level of sliding speed: 0.3142; SD1 Average value of Coefficient
of Friction at first level of sliding distance= 0.3839; AT4 Average value of Coefficient of
Friction at first level of Aging Time= 0.3664; Wµ
= 0.25874 Confidence interval has been calculated by Eq. (2) using following values: Predicted confidence interval has been evaluated using equation-2 [37]
𝐶𝐼 = √𝐹𝛼 (1, 𝑓𝑒)𝑉𝑒[𝑛1 𝑒𝑓𝑓+
1
𝑅] (2)
Here, the term CI= has been Confidence interval; Fα(1,fe) is the F-ratio having confidence level of
(1-α) at DOF=1 and at error degree of freedom (fe); Ve has been the Variance of error; R is the
sample size taken for confirmation experiment; Neff has been effective number of repetition= N/
[1+total degree of freedom for the estimation of mean]; N is the total number of results i.e. 50. Using the values: Ve= 0.001149; Total DOF for
estimation of mean are12; neff is equal to 3.8461;
F0.05 (1, 12) has value of 4.75.
The CI of estimated coefficient of friction at 95 % confidence Interval has been =0.259±0.004 (0.263-0.255).
The optimum level of input parameters for the best value of coefficient of friction using smaller the better criteria has been written as follows: Reinforcement level: 8 %, Particle size: 125-micron, Aging time: 18 Hr, Load: 1kg, Sliding Distance: 1000 m, Sliding Speed: 1.0m/s.
4.4 Confirmation experiments for coefficient of friction
The optimized results have been verified with conformation experiments at optimum level of input parameters. The mean coefficient of friction of confirmation experiments has been given in Table 9. The coefficient of friction result of confirmation experiments has been comes out near to the estimated results and lies between the limits of confidence interval predicted which is ± 0.004.
Table 9. Confirmation experiments result for coefficient of friction.
Response Characteristics
Optimum parameters
and respective
level
Predicted Optimum Value of coefficient
of friction
Confidence Interval at
95%
Experimental Value
Coefficient of
Friction A5, B5, C5 0.259 ±0.004 0.261
Coefficient of Friction (Base
Aluminum 6061)
0.351
4.5 Effect of Selected parameters on Coefficient of Friction
Impact of chosen parameters such as reinforcement, particle size, aging time, load, sliding distance, sliding speed on coefficient of friction has been discussed below.
4.5.1 Effect of percentage reinforcement on coefficient of friction
The value of coefficient of friction with respective percentage reinforcement has been displayed in Fig. 6 Coefficient of friction has been shown on y-axis and percentage reinforcement has been shown on x-axis. There has been arbitrary trend shown by percentage reinforcement on coefficient of friction. This may be due to dominance of different behaviour of
percentage reinforcement such as improvement in hardness with higher reinforcement percentage, clustering of particles with increase in percentage, formation of grooves, three body effect for reduction in friction.
Fig. 6. Mean values of COF at each level of percentage reinforcement.
Delta analysis shows percentage reinforcement (rank=6) has least effect on coefficient of friction. Similar trends have been reported by authors et al. [36].
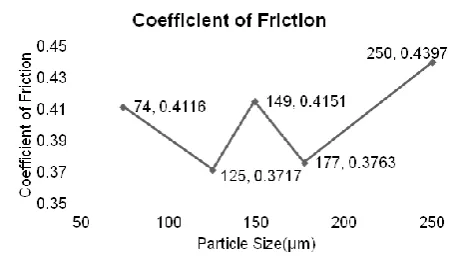
4.5.2 Effect of particle size on coefficient of friction
Graphical representation of coefficient of friction with respective particle size has been shown in Fig. 7. Y-axis represents coefficient of friction and x-axis denotes particle size. Particle size shows arbitrary trend for coefficient of friction. This variation again may be due to dominance of different behaviour at different levels such as three body effect of particles, hardness effect of particles with decrease in size, formation of grooves due to particles and clustering of particles.
Fig. 7. Mean value of COF at each level of particle size.
micrometer. The ANOVA analysis of the variables reports that the impact of particle size (P=0.071˃0.05) on coefficient of friction has been not found significant. Analysis also found that sliding speed (56.31 %), aging time (13.23 %), sliding distance (11.23 %) has been more effective than particle size and load (8.4 %) has been less effective.
4.5.3 Effect of aging time on coefficient of friction
The Figure 8 shows values of friction coefficient at different levels of aging time. COF has been shown on vertical axis and aging time has been shown on horizontal axis. Coefficient of friction reduced by increase in aging time but again increases for 24-hour aging time. Reduction in COF may be due to increase in hardness of the contact surface.
Fig. 8. Mean values of coefficient of friction at each level of aging time.
At 24-hour aging time, coefficient of friction increases and this may be because of formation of hard grooves on the mating surface and which in turn increases friction force. ANOVA analysis of the input parameters on coefficient of friction concluded that aging time (P=0.038≤0.05) has been a significant parameter affecting coefficient of friction. The analysis also reveals that aging time (13.23 %) has been second most effective parameter out of selected input parameters, affecting coefficient of friction after sliding speed.
4.5.4 Effect of load on coefficient of friction
The relation between coefficient of friction and applied load has been given in Fig. 9. Coefficient of friction has been represented on y-axis and load has been represented on x-axis. The friction coefficient first increasesby increasing applied load after that continuously decreasedwhen
further load increased. First increase in coefficient of friction may be due to increase in contact pressure and hence increase in friction force. But more increase in load reduces coefficient of friction that may be due to removal of reinforcement particles cause’s three body phenomena and reduces friction between the contact surfaces.
Fig. 9. Mean values of COF at each level of load.
The effect of load (P=0.08˃0.05) on coefficient of friction has not been reported significant by ANOVA analysis. Load (8.4%) has been found least effective parameter on coefficient of friction after percentage reinforcement by the above analysis.
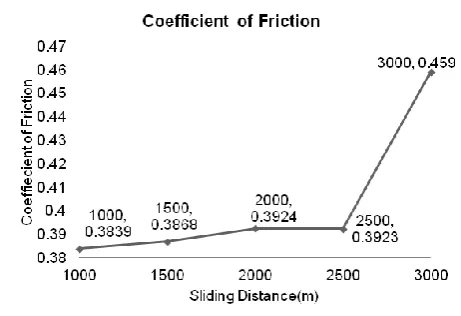
4.5.5 Effect of sliding distance on coefficient of friction
The variation of coefficient of friction at each level of sliding distance has been shown in Fig. 10. The figure shows coefficient of friction on ordinate axis and sliding distance on abscissa.
Fig. 10. Mean values of COF at each level of sliding distance.
sliding distance. This effect may be due with more sliding distance surface become rougher by formation of cavities in the contact surface due to removal of material and reinforcement particles. The ANOVA analysis of the input parameters on the coefficient of friction reports that the impact of sliding distance (P=0.05≤0.05) has been found significant. The analysis further reports that the sliding distance (11.23 %) has been more influential than the percentage reinforcement (rank=6), particle size (9.04 %) and load (8.4 %) but less influential than the sliding speed (56.31 %) and aging time (13.23 %).
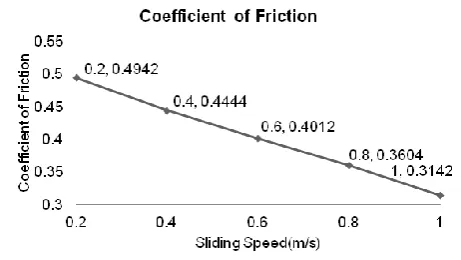
4.5.6 Effect of sliding speed on coefficient of friction
It can be observed from the Fig. 11 coefficient of friction decreases with increase in sliding speed. The may be due to increase in sliding speed, friction between pin and disk surface reduces hence coefficient of friction decreases.
Fig. 11. Mean values of coefficient of friction at each level of sliding speed.
ANOVA analysis of the input variables on the coefficient of friction reported that the effect of sliding speed (P=0.003≤0.05) has been found significant. The analysis also reveals that the sliding speed (56.31 %) has been most significant factor among all selected factors.
4.6 Mathematical model for Coefficient of Friction
By considering the Six parameters, namely percentage reinforcement as PR, Particle size as PS, Aging time as AT, Load as L, Sliding Distance as SD and Sliding speed as SS and using MINITAB software mathematical model has been developed for predicting the value of Coefficient of Friction. The regression equation for Coefficient of Friction has been as follows:
Coefficient of Friction = ‒ 8.509 + 0.1880 PR ‒
0.009481 PS ‒ 0.1975 AT ‒ 0.1557 L + 0.01533 SD ‒ 20.38 SS ‒ 0.000199 PR∙PS ‒ 0.01719 PR∙AT + 0.3470 PR∙L ‒ 0.000735 PR∙SD + 0.6116 PR∙SS ‒ 0.000858 PS∙AT + 0.005394 PS∙L + 0.000009 PS∙SD ‒ 0.02517 PS∙SS + 0.06564 AT∙L + 0.000010 AT∙SD + 0.4430 AT∙SS ‒ 0.003049 L∙SD ‒ 0.1205 L∙SS + 0.004882 SD∙SS + 0.004073 PR∙PR + 0.000010 PS∙PS + 0.002787 AT∙AT (3)
Where PR is percentage reinforcement, in weight %, PS is particle size in micrometers (µm), AT is aging time in hours (Hr), L is load in kg, SD is sliding distance in meters, SS is sliding speed in m/s.
Table 9. Predicted Results of Coefficient of Friction. PR
(by wt) (µm) PS (hr) AT (kg) L (m) SD (m/s) SS Mean COF Predicted COF 4 250 0.5 1 1000 0.2 0.5145 0.4888 4 177 6 2 1500 0.4 0.447 0.4210 4 149 12 3 2000 0.6 0.404 0.3816 4 74 18 4 2500 0.8 0.3495 0.3568 4 125 24 5 3000 1 0.3815 0.3741
8 250 6 3 2500 1 0.342 0.2795
8 177 12 4 3000 0.2 0.486 0.4560 8 149 18 5 1000 0.4 0.369 0.3953 8 74 24 1 1500 0.6 0.379 0.3854 8 125 0.5 2 2000 0.8 0.3505 0.3293 12 250 12 5 1500 0.8 0.3505 0.3647 12 177 18 1 2000 1 0.218 0.1923 12 149 24 2 2500 0.2 0.577 0.5732 12 74 0.5 3 3000 0.4 0.564 0.5733 12 125 6 4 1000 0.6 0.3805 0.4106 16 250 18 2 3000 0.6 0.4735 0.4194 16 177 24 3 1000 0.8 0.3615 0.3936 16 149 0.5 4 1500 1 0.3355 0.3638 16 74 6 5 2000 0.2 0.4715 0.5364 16 125 12 1 2500 0.4 0.324 0.3102 20 250 24 4 2000 0.4 0.518 0.5481 20 177 0.5 5 2500 0.6 0.369 0.4043 20 149 6 1 3000 0.8 0.39 0.3560
20 74 12 2 1000 1 0.294 0.3254
20 125 18 3 1500 0.2 0.422 0.4674
The predicted results of Coefficient of Friction by this mathematical model have been reported in Table 9. As it can be observed from the Table 9 that the predicted results show good agreement with the experimentally obtained results.
5. CONCLUSIONS
particle size and coefficient of friction has maximum value at 250 micrometer. There has been arbitrary trend shown by percentage reinforcement on coefficient of friction. Delta analysis shows percentage reinforcement has least effect on coefficient on coefficient of friction. Coefficient of friction decreases with increase in aging time but again increases for 24-hour aging time. By ANOVA, the parameters i.e. aging time, sliding distance, sliding speed have found significant while the impact of particle size and load have been not found significant. The order of significance of the factors has been Sliding speed (56.3 %), aging time (13.26 %), sliding distance (11.23 %), particle size (9.04 %) and load (8.4 %).
Acknowledgement
Authors are grateful for Science and Engineering Research Board, New Delhi (India) for their funding current research by Fast Track Young Scientist Engineering Science Scheme, their letter No. SB/FTP/ETA-148/2013, Dated: 31/10/2013.
REFERENCES
[1] M.J. Jebeen, I. Dinaharan, S.S. Joseph, Prediction of influence of process parameters on tensile strength of AA6061/TiCaluminum matrix composites produced using stir casting, Trans. Nonferrous Met. Soc. China, vol. 26, pp. 1498-1511, 2016, doi: 10.1016/S1003-6326(16)64256-5
[2] S. Li, Y. Su, X. Zhu, H. Jin, Q. Ouyang, D. Zhang, Enhanced mechanical behavior and fabrication of silicon carbide particles covered by in-situ carbon nanotube reinforced 6061 aluminum matrix composites, Materials and Design, vol. 107, pp. 130-138, 2016, doi: 10.1016/j.matdes.2016.06.021 [3] R.T. Mousavian, R.A. Khosroshahi, S. Yazdani, D.
Brabazon, A.F. Boostani, Fabrication of aluminum matrix composites reinforced with nano- to micrometer-sized SiC particles, Materials and Design, vol. 89, pp. 58-70, 2016, doi: 10.1016/j.matdes.2015.09.130
[4] T.S. Kumar, R. Subramanian, S. Shalini, J. Anburaj, P.C. Angelo, Synthesis, microstructure and mechanical properties of Al-Si-Mg alloy hybrid (zircon + alumina) composite, Indian Journal of engineering and Materials Sciences, vol. 23, pp. 20-26, 2016.
[5] J. Singh, A. Chauhan, Characterization of hybrid aluminum matrix composites for advanced applications – A review, Journal of Materials Research and Technology, vol. 5, iss. 2, pp. 159-169, 2016, doi: 10.1016/j.jmrt.2015.05.004 [6] K.R. Kumar, K. Kiran, V.S. Sreebalaji, Micro
structural characteristics and mechanical behaviour of aluminium matrix composites reinforced with titanium carbide, Journal of Alloys and Compounds, vol. 723, pp. 795-801, 2017, doi: 10.1016/j.jallcom.2017.06.309 [7] V. Bharath, M. Nagaral, V. Auradi, S.A. Kori,
Preparation of 6061Al-Al2O3 MMC's by Stir Casting
and Evaluation of Mechanical and Wear Properties, Procedia Materials Science, vol. 6, pp. 1658-1667, 2014, doi: 10.1016/j.mspro.2014.07.151
[8] M.S. Surya, G. Prasanthi, Tribological Behaviour of Aluminum Silicon Carbide Functionally Graded Material, Tribology in Industry, vol. 40, no. 2 pp. 247-253, 2018, doi: 10.24874/ti.2018.40.02.08 [9] B.P. Kumar, A.K. Birru, Tribological Behavior of
Aluminium Metal Matrix Composite with Addition of Bamboo Leaf Ash by GRA-Taguchi Method, Tribology in Industry, vol. 40, no. 2, pp. 311-325, 2018, doi: 10.24874/ti.2018.40.02.14
[10] S. Aribo, A. Fakorede, O. Ige, P. Olubambi, Erosion-corrosion behaviour of aluminum alloy 6063 hybrid composite, Wear, vol. 376, pp. 608-614, 2017, doi: 10.1016/j.wear.2017.01.034 [11] S. Sharma, T. Nanda, O.P. Pandey, Effect of particle
size on dry sliding wear behaviour of sillimanite reinforced aluminium matrix composites, Ceramics International, vol. 44, pp. 104-114, 2018, doi: 10.1016/j.ceramint.2017.09.132 [12] A. Pramanik, Effects of reinforcement on wear
resistance of aluminum matrix composites, Trans. Nonferrous Met. Soc. China, vol. 26, pp. 348-358, 2016, doi: 10.1016/S1003-6326(16)64125-0 [13] M. Uthayakumar, S. Aravindan, K. Rajkumar,
Wear performance of Al–SiC–B4C hybrid composites under dry sliding conditions, Materials and Design, vol. 47, pp. 456-464, 2016, doi: org/10.1016/j.matdes.2012.11.059
[14] S. Sahraeinejad, H. Izadi, M. Haghshenas, A.P. Gerlich, Fabrication of metal matrix composites by friction stir processing with different Particles and processing parameters, Materials Science & Engineering A, vol. 626, pp. 505-513, 2015, doi: 10.1016/j.msea.2014.12.077
International, vol. 42, pp. 56-81, 2016, doi: 10.1016/j.ceramint.2015.08.150
[16] K.K. Alaneme, T.M. Adewale, P.A. Olubambi, Corrosion and wear behaviour of Al–Mg–Si alloy matrix hybrid composites reinforced with rice husk ash and silicon carbide, Journal of Materials Research and Technology, vol. 3, iss. 1, pp. 9-16, 2014, doi: 10.1016/j.jmrt.2013.10.008
[17] N. Panwar, R.P. Poonia, G. Singh, R. Dabral, A. Chauhan, Effect of Lubrication on Sliding Wear of Red Mud Particulate Reinforced Aluminium Alloy 6061, Tribology in industry, vol. 39, iss. 3, pp. 307-318, 2017, doi: 10.24874/ti.2017.39.03.05 [18] R. Dabral, N. Panwar, R. Dang, R.P. Poonia, A.
Chauhan, Wear Response of Aluminium 6061 Composite Reinforced with Red Mud at Elevated Temperature, Tribology In Industry, vol. 39, iss. 3, pp. 391-399, 2017, doi: 10.24874/ti.2017.39.03.14 [19] N. Panwar, A. Chauhan, Optimizing the effect of
reinforcement, particle size and aging on impact strength for Al 6061-red mud composite using Taguchi technique, Sadhana, vol. 43, iss. 7, pp. 1-10, 2018, doi: 10.1007/s12046-018-0870-6 [20] S. Narayan, A. Rajeshkannan, Hardness, tensile
and impact behaviour of hot forged aluminium metal matrix composites, Journal of Materials Research and Technology, vol. 6, iss. 3, pp. 213-219, 2017, doi: 10.1016/j.jmrt.2016.09.006 [21] S. Selvakumar, I. Dinaharan, R. Palanivel, B.G.
Babu, Development of stainless steel particulate reinforced AA6082 aluminum matrix composites with enhanced ductility using friction stir processing,Materials Science & Engineering A vol. 685, pp. 317-326, 2017, doi: 10.1016/j.msea.2017.01.022
[22] V.P. Mahesh, P.S. Nair, T.P.D. Rajan, B.C. Pai, R.C. Hubli, Processing of surface-treated boron carbide-reinforced aluminum matrix composites by liquid–metal stir-casting technique, Journal of Composite Materials, vol. 45, pp. 2371-2378, 2011, doi: 10.1177/0021998311401086
[23] L. Yuan, J. Han, J. Liu, Z. Jiang, Mechanical properties and tribological behaviour of aluminium matrix composites reinforced with in-situ AlB2 particles, Tribology International, vol. 98, pp. 41-47, 2016, doi: 10.1016/j.triboint.2016.01.046
[24] J.M. Mistry, P.P. Gohil, An overview of diversified reinforcement on aluminum metal matrix composites: Tribological aspects, Proceedings of the Institution of Mechanical Engineers, Part J: Journal of Engineering Tribology, vol. 231, pp. 1-23, 2017, doi: 10.1177/1350650116658572 [25] S. Karabulut, H. Karakoç, R. Çıtak, Influence of
B4C particle reinforcement on mechanical and
machining properties of Al6061/B4C composites, Composites Part: B, vol. 101, pp. 87-98, 2016, doi: 10.1016/j.compositesb.2016.07.006
[26] M.O. Bodunrin, K.K. Alaneme, L.H. Chown, Aluminium matrix hybrid composites: a review of reinforcement philosophies; mechanical, corrosion and tribological characteristics, Journal of Materials Research and Technology, vol. 4, pp. 434-445, 2015, doi: 10.1016/j.jmrt.2015.05.003 [27] K.S. Prakash, A. Kanagaraj, P.M. Gopal, Dry
sliding wear characterization of Al 6061/rock dust composite, Trans. Nonferrous Met. Soc. China, vol. 25, pp. 3893-3903, 2015, doi: 10.1016/S1003-6326(15)64036-5
[28] M. Jayaraman, R. Sivasubramanian, V. Balasubramanian, A.K. Lakshminarayanan, Optimization of process parameters for friction stir welding of cast aluminium alloy A319 by Taguchi method, Journal of scientific & industrial research, vol. 68, pp. 36-43, 2009.
[29] S. Koksal, F. Ficici, R. Kayikci, O. Savas, Experimental optimization of dry sliding wear behavior of in situ AlB2/Al composite based on Taguchi’s method, Materials and Design, vol. 42, pp. 124-130, 2012, doi: 10.1016/j.matdes.2012.05.048
[30] S. Dharmalingam, R. Subramanian, M. Kok, Optimization of abrasive wear performance in aluminium hybrid metal matrix composites using Taguchi–grey relational analysis, Proceedings of the Institution of Mechanical Engineers, Part J: Journal of Engineering Tribology, vol. 227, pp. 749-760, 2013, doi: 10.1177/1350650112467945 [31] C. Garcia-Cordovilla, J. Narcisoand, E. Louis,
Abrasive wear resistance of aluminium alloy /ceramic particulate composites, Wear, vol. 192, pp. 170-177, 1996, doi: 10.1016/0043-1648(95)06801-5
[32] A. Baradeswaran, A. Elaya Perumal, Influence of B4C on the tribological and mechanical properties of Al 7075–B4C composites, Composites: Part B, vol. 54, pp. 146-152, 2013, doi: 10.1016/j.compositesb.2013.05.012
[33] R. Raj, D. Singh, G. Thakur, Qualitative and quantitative assessment of microstructure in Al-B4C metal matrix composite processed by modified stir casting technique, archives of civil and mechanical engineering, vol. 1, iss. 6, pp. 949-960, 2016, doi: 10.1016/j.acme.2016.07.004
[35] K.S. Arunagiri, N. Radhika, Studies on Adhesive Wear Characteristics of Heat Treated Aluminium LM25/AlB2 Composites, Tribology in Industry, vol. 38, iss. 3, pp. 277-285, 2016.
[36] S. Baskaran, V. Anandakrishnan, Statistical analysis of Co-efficient of friction during dry sliding wear behaviour of TiC reinforced
Aluminium Metal Matrix Composites, Materials Today: Proceedings, vol. 5, pp. 14273–14280, 2018, doi: 10.1016/j.matpr.2018.03.009