COMPUTER SCIENCE & TECHNOLOGY
www.computerscijournal.org
December 2016, Vol. 9, No. (3): Pgs. 235-245 An International Open Free Access, Peer Reviewed Research Journal
Published By: Oriental Scientific Publishing Co., India.
INTRODUCTION
In today’s digital world the important and convenient source of information is the digital image. Due to their ease of acquisition and storage they convey information in the fastest means. In the court of law the images can be used as proof or evidence. Digital images are having large applications ranging from military to medical and from art piece to user photography. Hence the digital image forensic evolve as fast growing need for society. The image needs to be authentic. Now a days due to advancement in computers and easiness in availability of low cost tools that is hardware and software. It becomes very
Copy Move Image Forgery Detection Using SIFT
PRIYANkA R. RUIkAR*
1and PRAvIN S. PATIL
21Department of Electronics, SSVPS’s BSD COE, Dhule, Maharashtra, India.
2Department of Electronics & Communication, SSVPS’s BSD COE, Dhule, Maharashtra, India.
*Corresponding author E-mail: [email protected] http://dx.doi.org/10.13005/ojcst/09.03.09
(Received: December 20, 2016; Accepted: December 29, 2016)
AbSTRACT
In recent years the digital form of data allowing ease on to manipulation & storage due to progress in technology. But this progress in technology has lots of risks especially when it comes to the security of the digital data & files. Basically, image forgery means malfunctioning & playing with images or manipulating data fraudulently. In that case, some important data may get hidden in the original image. In particular, many organizations worry for digital forgery, because it is easier to create fake & fraudulent images without leaving any Tampering traces. A copy-move is a specific form of image forgery operation & it is considered one of the most difficult problems in that case for this a part of any image is copied & pa tested on another location of an image that may be a same or different image, to obfuscate undesirable objects in the scene. In this paper, the method is proposed which automatically detects & identifies the duplicated regions in the image. In that process first image segmentation takes place & by identifying the local characteristics of the images (points of interest) the duplication is detected using SIFT (Scale Invariant Feature Transform).
keywords: Segmentation, Key point extraction, Copy move forgery detection, SIFT1.
include SIFT description and SIFT descriptor. The low response features are discarded by applying SIFT algorithm. The widely used technique to edit the digital images is copy move image forgery. Copy move simply requires the pasting the portion of image in input image and hiding some important information or element from the image. Thus the originality of the image changes and violates the authenticity of that image. It becomes very difficult to detect forgery when the copied portions are from the same image because they have similar properties of input image. The copied portion of image which is used to forge the image is called snippet. Correlation between the original image area and the copied content is introduced by a copy move forgery. Before pasting to create a convincing a forgery the post processing of snippet is necessary to perform. Good forgery detection method should be robust to post processing operations such as scaling and rotation. No of algorithms are available which focusing on post processing on snippet.
In SIFT algorithm a four stage filtering approach is used.
1) Detection of the interest key points that is scale space extrema.
2) By considering only the stable key points, localization of key points takes place.
3) Orientation assignment is performed to the selected key points.
4) Key point descriptor.
After matching key points it may happen that the region of an image may have the same feature as original. Then clustering of key points and forgery detection takes place. And finally if tampering has been done then estimates geometric transformation.
Literature Survey
Image forgery’s history has recorded on early as on 1840. The first person to create fake image was Hippolyta barnyard. There is an iconic portrait of u.S. president Abraham lincoln was made in 1860, which is a composite of lincoln’s head and the John Calhoun’s body who was southern politician. The famous photographer Mathew Brady captured one photo in 1865; in that photo General Sherman is seen posing with his Generals. In the original photograph General Fran’s P.Blair was not there in the image, but he was added far right in the image. Osama bin laden was killed by u.S. forces in 2011,in Pakistan on May 2nd .laden’s photo was reported and shown on Pakistani television, however the photo is a composite of two different photos in which the top portion is of an another person and lower portion is of an alive laden.
There are various techniques which can be classified into two categories:
1) Block based
2) feature based method.
block based method
This method requires original image area and the pasted area, by splitting the image into overlapping blocks and then a feature extraction process is applied through which the image blocks represented by a low dimensional representation. In the literature different block based representation has been proposed such as DCT (Discrete cosine transform), PCA (Principal component analysis) and DWT (Discrete wavelet transform) for both process of image splicing and copy move detection. Recently, the study proposed an approach of duplication detection which can adopt two robust features based on KPCA (Kernel Principal
Fig.1: basic block diagram for key-point based CMFD
Component analysis) and DWT (Discrete wavelet transform). Different kind of features are available but the authors choose the averages of Red, Green and Blue components with other features, which computed on overlapping blocks by the energy distribution of luminous along four different directions. In the recent literature more robust methods have been proposed to reflection, rotation and scaling. Overlapping consists of blocks of pixels which are mapped on log-Polar coordinates and along the angle axis their summation takes place, to obtain one dimensional descriptor which is invariant to reflection and rotation. Also we have studied some existing systems for the comparison purpose1, 2.
DWT (Discrete Wavelet Transform) - Due to inherent multi-resolution characteristics, the wavelet decomposition of the image is used. To reduce the size of the image at each level the idea of DWT is used for example the reduction of a square image of size 2j×2j pixels at level l to the size 2(j/2)×2(j/2) pixels at level l+1. Different types of a wavelet are applied in different type of methods. The image is decomposed at each level into four sub images. They are labelled as ll, lH, Hl and HH. ll corresponds to the approximation image which is used for further decomposition. lH, Hl and HH correspond to the vertical, horizontal and diagonal components of the image respectively. The forgery can be detected by DWT method but the method is block based and after segmentation overlapping blocks are formed by dividing the input
image. That’s why forgery detection using DWT is infeasible10.
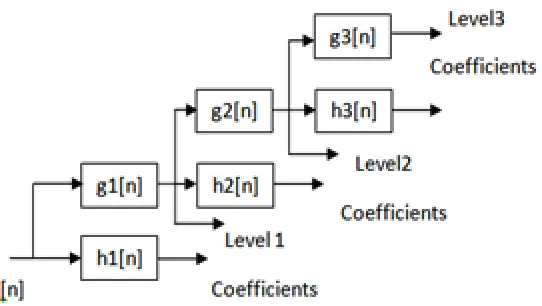
SWT (Stationary Wavelet Transform) - There is one other type of wavelet transform is available, which is designed to overcome the lack of translation invariance of the DWT called as SWT (Stationary Wavelet Transform). By removing the up samples and down sample translation invariance is achieved in the DWT and up sampling of filter coefficients takes place. As the output of each level of SWT have the same no. of samples as the input hence SWT is inherently redundant scheme. So, for a decomposing of N levels there are a redundancy of N in the wavelet coefficients. In French this algorithm is famously known as “Algorithme a traus” (traus means holes) which refers to inserting zeros in the filters. Holschneider introduced it.
Proposed System
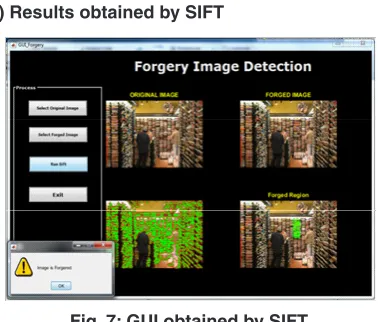
Here first GuI formation in MATlAB takes place using GuIDE (GuI development environment).Then initialization code executes before GuI_FORGERY is made visible then particular input image is selected and using pushbutton that particular input image is displayed in GuI similarly forged image is also displayed on GuI using pushbutton then resizing of the original input image and forged image is takes place after that segmentation of both the input image and forged image is done. When segmentation of input image is done then SIFT (scale invariant feature transform) algorithm is applied as explained in
Fig. 2: Level filter bank for SWT
section I. Similarly SIFT is applied on the forged image and erode image is obtained. When we applied SIFT algorithm on both the images at that time key-points for that images are obtained and by comparing this key-points forgery is detected then diffimmask is find out using the formula of
diffimmask= sum(abs(resize forged image – input image double),3)>90 .
And forgery threshold is set as 300. And diffimmask and forgery threshold are compared to
Flowchart for proposed system
Initialize GUI
Read Inputimage Read Forged Image
Write Original Image Write Forget Image
Display Original Image
Display Forged image
Resize Original Image Resize Forged Image
Apply Segmentation Apply Segmentation
Apply SIFT Algorithm Apply SIFT Algorithm
Is Kp1=Kp2?
Forgery Not Detected Forgery Detected
Find Diffimmaak
Is Diffimmak>F orgy Threshold
Image is not forged Image is forged
NO
NO Yes
detect whether the image is forged or not. And then finally forged region is detected.
EXPERIMENTAL RESULTS
Basically in this work we created such a system that gives us proper results to detect copy move forgery which done in the input image and for that we used different images and calculated the accuracy of this particular code which precisely detects forgery made. Also, here we used MATlAB software for coding purpose .MATlAB
(Matrix laboratory) allows matrix manipulation, implementation of algorithms, plotting of functions and creation of user interface by using different-different toolbox. Also same image applied to DWT and SWT and observed the results as follows. Here we have used 4 input images and results obtained.
Performance Metrics
To compare image compression quality two error metrics are used that are MSE (Mean Squared Error) and PSNR (Peak Signal to Noise
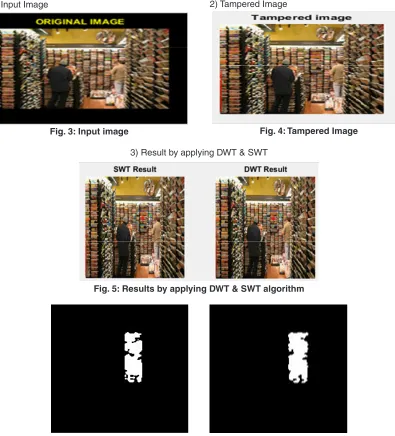
Fig. 6: binary Image obtained by DWT & SWT respectively Fig. 3: Input image
1) Input Image
Fig. 4: Tampered Image
2) Tampered Image
Fig. 5: Results by applying DWT & SWT algorithm
Fig. 7: GUI obtained by SIFT 4) Results obtained by SIFT
Table1: Result Table for Image 1
Sr. Parameters Methods
No DWT SWT SIFT
1 Accuracy in % 85.982143 87.183805 97.42874
2 MSE 0.0056 0.0054 0.001
3 PSNR 70.6371 70.7933 77.9387 4 Entropy 0.1407 0.1533 0.1412
5 Recall 0.9967 0.9979 0.999
6 Precision 0.9977 0.9967 1
7 F1 0.9972 0.9973 0.9995
8 Similarity 0.9944 0.9946 0.999
Fig. 8: Graphical representation for PSNR Fig. 9: Graphical representation for Accuracy
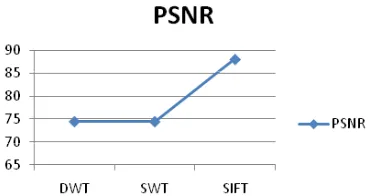
Graphical representation for PSNR readings is shown in below graph
Graphical representation of Accuracy readings is shown in below graph
Ratio). The MSE represents the cumulative square error between the original image and the compressed one whereas PSNR represents a measure of the peak error. As lower the value of MSE is obtained means lower error is present. Value of MSE is required to calculate the PSNR so, 1st we have to calculate MSE and then go for the PSNR.
MSE = (∑M,N[I1(m,n)-I2(m,n)]2 )/ (M×N)
Here M and N are the number of rows and columns respectively in the input images.
Fig.10: Input Image 5) Input Image 2
Fig.13: binary Image obtained by DWT & SWT 8) binary Image obtained by DWT & SWT respectively
Fig.14. GUI obtained by SIFT 9) Results obtained by SIFT
Fig.12: Results by applying DWT & SWT algorithm
7) Results Obtained by DWT & SWT
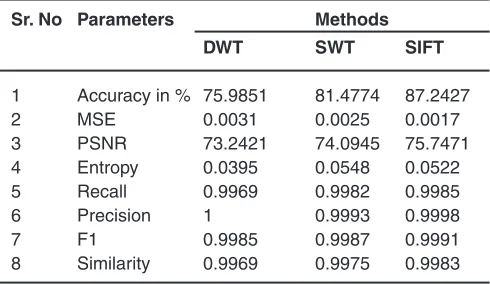
Table 2: Result Table for Input Image 2
Sr. No Parameters Methods
DWT SWT SIFT
1 Accuracy in % 75.9851 81.4774 87.2427
2 MSE 0.0031 0.0025 0.0017
3 PSNR 73.2421 74.0945 75.7471 4 Entropy 0.0395 0.0548 0.0522
5 Recall 0.9969 0.9982 0.9985
6 Precision 1 0.9993 0.9998
7 F1 0.9985 0.9987 0.9991
8 Similarity 0.9969 0.9975 0.9983
Fig.16: Graphical representation for Accuracy
Graphical representation of Accuracy readings is shown in below graph
Fig.15: Graphical representation for PSNR
Graphical representation for PSNR readings is shown in below graph
Then compute the PSNR using the following equation:
2
10
10log
R
PSNR
MSE
=
In the previous equation, R is the maximum fluctuation in the input image.
When third input image is applied then following results obtained as follows.
Fig.17: Input Image
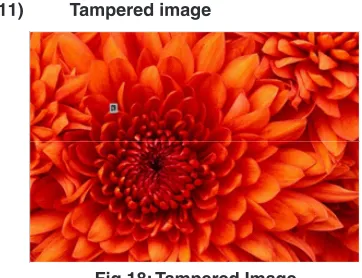
10) Input Image 3 11) Tampered image
Fig.18: Tampered Image
14) Results obtained by SIFT
Fig. 21: GUI obtained by SIFT
13) binary Image obtained by DWT & SWT respectively
Fig. 20: binary Image obtained by DWT & SWT Fig. 19: Results by applying
DWT & SWT algorithm 12) Results Obtained by DWT & SWT
is also called as detection rate which gives the percentage of detected true positives to the total no. of true positives and false negative in the image.
Recall = tp/(tp+fn)
To compare different methods alone recall is not enough and is generally used in combination
with precision also called as positive prediction that gives the percentage of detected true positive values to the total no. of detected items by the method.
Precision = tp/(tp+fp)
There is one other performance metric which combines precision and recall used to rank the different method called as F1.
Fig.22: Graphical representation for PSNR
Graphical representation for PSNR readings is shown in below graph
Graphical representation of Accuracy readings is shown in below graph
Fig. 23: Graphical representation for Accuracy
When fourth input image is applied then following results obtained as follows.
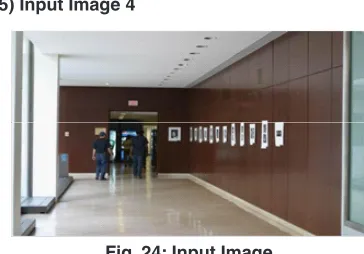
15) Input Image 4
Fig. 24: Input Image Fig. 25: Tampered Image 16) Tampered Image
Table 3: Result Table for Input Image 3
Sr. No Parameters Methods
DWT SWT SIFT
1 Accuracy in % 49.3514 52.5401 74.3323
2 MSE 0.0014 0.0014 8.3669e-4
3 PSNR 76.6108 76.8017 78.9052
4 Entropy 0.0057 0.0064 0.0118
5 Recall 0.9986 0.9986 0.9992
6 Precision 1 1 1
7 F1 0.9993 0.9993 0.9996
8 Similarity 0.9986 0.9986 0.9992
CONCLUSIONS
To create digital data digital technology is used for example Digital camera, scanners etc. Also this technology is used for manipulating the
17) binary Image obtained by DWT & SWT respectively
Fig. 26: binary Image obtained by DWT & SWT
2) Results obtained by SIFT
Fig. 28: GUI obtained by SIFT
Here for this input image 4 both DWT & SWT are unable to detect the forgery properly.
1) Results Obtained by DWT & SWT
Fig.27. Results by applying DWT & SWT algorithm
Table 4: Result Table for Input Image 4
Sr. No Parameters Methods
DWT SWT SIFT
1 Accuracy in % Nan Nan 97.833
2 MSE 0.0023 0.0023 1.020e-004
3 PSNR 74.4487 74.4487 88.0431
4 Entropy 0 0 0.0235
5 Recall 0.9977 0.9977 0.999
6 Precision 1 1 1
7 F1 0.9988 0.9988 0.999
8 Similarity 0.9977 0.9977 0.9999 carried out on different types of images. And we find
the accuracy for Proposed method and compare the results with other two existing methods DWT & SWT also we calculated different parameters using different performance metrics for these three
Graphical representation of Accuracy readings is shown in below graph
Fig. 30: Graphical representation for Accuracy
Fig. 29: Graphical representation for PSNR
Graphical representation for PSNR readings is shown in below graph
1. Jian li, Xiaolong li, Bin Yang, And Xingming Sun,Senior Member, IEEE “segmentation-based image copy-move forgery detection scheme” IEEE Trans. Inf. Forensics And Security, Vol. 10, No. 3, (2015).
2. S.-J. Ryu, M. Kirchner, M.-J. lee, And H.-K. lee, “Rotation Invariant localization Of Duplicated Image Regions Based On Zernike Moments,” IEEE Trans. Inf.Forensic Security, Vol. 8, No. 8, Pp. 1355–1370, (2013).
3. V. Christlein, C. Riess, J. Jordan, C. Riess, And E. Angelopoulou,“An Evaluation Of Popular Copy-Move Forgery Detection Approaches”,IEEE Trans. Inf. Forensics Security, Vol. 7, No. 6, Pp. 1841–1854, (2012).
4. J. Redi, W. Taktak, And J.-l. Dugelay, “Digital Image Forensics: A Booklet For Beginners,”
Multimedia Tools And Applications, Vol. 51, No. 1, Pp. 133–162, (2011).
5. S. Khan And A. Kulkarni, “Detection Of Copy-Move Forgery using Multiresolution Characteristic Of Discrete Wavelet Transform,” In Proc. Int. Conf. Workshop Emerg. Trends Technol. (Icwet), New York,
Ny, usa, Pp. 127–131, (2011).
6. S. Bayram, H. Sencar, And N. Memon, “An Efficient And Robust Method For Detecting Copy-Move Forgery,” In IEEE International Conference On Acoustics, Speech, And Signal Processing, Pp. 1053–1056,(2009). 7. M. Bashar, K. Noda, N. Ohnishi, And K.
Mori, “Exploring Duplicated Regions In Natural Images,” IEEE Transactions On Image Processing, Mar. 2010, Accepted For Publication.
8. S. Bravo-Solorio And A. K. Nandi, “Exposing Duplicated Regions Affected by reflection, Rotation And Scaling,” In Proc. IEEE Int. Conf. Acoustic., Speech Signal Process. (Icassp), May 2011, Pp. 1880–1883. (2005).
9. J. Fridrich, D. Soukal, And J. luk´AˇS, “Detection Of Copy-Move Forgery Indigital Images,” In Proceedings Of Digital Forensic Research Workshop,(2003).
10. Saiqa Khan,Arun Kulkarni” Reduced Time Complexity For Detection Of Copy-Move Forgery using Discrete Wavelet Transform” International Journal Of Computer Applications, (0975 – 8887) Vol.6: No.7, (2010).