Remote Monitoring of the Heart Condition of Athletes
by Measuring the Cardiac Action Potential Propagation Time
Using a Wireless Sensor Network
S.Ananthi
1,*, V.Vignesh
1, R.Hariprakash
2, and K.Padmanabhan
31Department of Network Systems and Information Technology, University of Madras, India. 2
Arulmegu Meenakshi Amman College of Engineering, Kancheepuram, India
3
AC College of Technology, Chennai, India
Received 15 January 2016; received in revised form 24 February 2016; accepted 24 March 2016
Abstract
Highly performing athletes are susceptible to cardiac damage of several kinds which may be irreversible. The monitoring of heart rate and ECG waveforms from such subjects by wireless sensor networks has been reported in health and sports care documents. However, a more decisive parameter for instant to instant changes would be the time of Cardiac Action Potential Propagation. This time, which can be between 15-20 ms would shoot suddenly in acute stress in highly performing athletes for short durations. Repeated incidents of such rising values will tend to cause irreversible damage to the heart. We developed the technique of measuring this time and reporting it through a wireless sensor network to monitoring station.
Keywords: wireless sensor networks, prophylactic athlete monitoring, ECG action potential time, ischemia
1.
Introduction
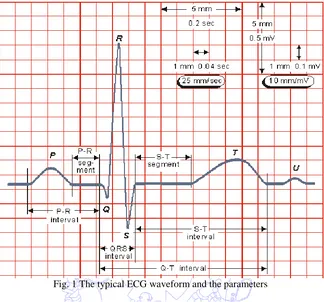
The extreme physical throughput under stressed conditions in highly competing games for athletes needs instantaneous medical attention. Too much stress has a direct effect on hormonal balance, and eventually stress affects our entire metabolism and immune system. Physical demands, psychological demands, expectations and pressure to perform to a high standard all are causative in increasing the load on the heart. In a general arousal of the body, Heart rate increases, blood is rushed to the muscles, blood pressure and muscle tension increase [1]. The ECG waveform (Fig. 1) will show elevated S-T segment and temporary Q waves might appear in the waveform [2]. These wave changes will take place over very short durations of a few seconds and the same may revert back soon. It is not feasible easily to observe the ECG wave from each successive beat and from the various ECG lead positions. In clinically recorded ECG, what is observed is the standard 12 lead waveforms, which are not all taken from one and same heart beat, but over a staggered period which may be even one or two minutes. In intensive care Cardiac bedside monitors, they observe just the single ECG from a so called rhythm strip electrode set.
Highly trained athletes show striking LV cavity enlargement, with end-diastolic dimensions ≥60 mm, similar in
magnitude to that evident in pathological forms of dilated cardiomyopathy. Over the last several years, sudden deaths of
trained athletes, usually associated with exercise, have become highly visible events [3]. It is also reported that this risk can
be reduced or minimized by either temporary or permanent withdrawal from sports [4]. It is usually thought that a basic heart
rate reporting through wireless network would suffice for the purpose of continous monitoring while athelets are in the brim
of intense performance. An increase in heart rate with the ECG waveforms being not abnormal in any of the leads is of no
concern. However, within a few seconds of the peak performance attempted by the exerting athelets, the observation of the
ECG leads remotely is not simple enough because it needs a specific physician to continously observe the changes as they
happen during that critical period. There is preliminary evidence that the disqualification strategies of the Bethesda
Conference [5] and the ESC may minimize risk and thereby reduce the number of sudden deaths in young athletes.
Fig. 1 The typical ECG waveform and the parameters
The use of wireless sensor networks for health care monitoring specifically for performing athletes is an important
concern and is reported [6]. A wireless ECG acquisition sub-system with warning signal based on MSP430, a central monitoring sub-system based on ARM and ECG analysis software on PC are described in [7] using wireless sensor network with nRF905 wireless transceivers. Generally, ISM band at 2.45 GHz (centre frequency) has indicated some wireless transmission standards that may be used for sports monitoring.
In this paper, we describe a technique for trnsmiting a single important parameter, which has been possible to determine from successive heart beats, even under high beat rates of performing athelets.
We describe the essentials of the method in Section 3 and the devices in Section 4 as employed for the purpose. Section 5 just illustrates the application of a wireless module with an FPGA for testing and evaluation with patients and also performing athletes.
2.
Importance of Cardiac Action Potential Propagation Time in the Ventricles
Time measurements on a full ECG of a heart beat have been made in several ways and even automatic analysis of variations attempted [11]. But what we deal with in this paper is the time of AP propagation, which is initiating the compression of the ventricle.
The effect of a traveling wave of this action potential is seen as the familiar ECG waveform. The wave is generated not by electronic conduction as in a wire, but by electronic conduction. In it, the QRS complex is a representation of the rising AP. Several models for QRS complex estimation have also been reported as signal processing exercises [11].
The propagation of the action potential impulse through the ventricle is via nexus or gap junctions [12-13] and the specific subcellular distribution of the gap junctions packed by rod shaped cardio myocytes causes continuous conduction [14]. In a pathological condition, the substrate associated with Myocardial infarction (MI) contains islands of surviving myocardium interconnected by narrowed strands with reduced coupling through nexus junctions. In diseased heart, structural non homogeneities are present [15] which cause delay in the AP Propagation. Assessment of myocardial injury is indicated by the external ECG waveforms through Q wave changes, T wave abnormality, ST deviation present long after a MI and so on. Myocardial infarction recognized through just ST elevation (STEMI) is not very decisive in assessing MI and methods of vector cardiography alone could detect delays in AP propagation [16].
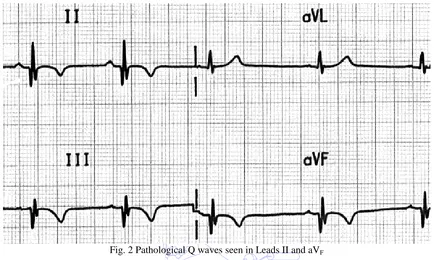
Q waves with amplitude more than one fourth of the R wave in Einthoven and Wilson leads are taken as pathological. It is stated [17] that patients with Q wave MI had worse prognosis compared to those without Q wave MI and hence warrant a closer follow up. With or without a Q wave, for STEMI or NSTEMI patients, the presence of MI certainly cause local delay in the AP propagation and hence the time course of its propagation is a vital diagnostic aid in cardiac care.
At higher heart rates, the AP propagation time was not found by our measurements to decrease. Since it depends only on the anatomy of the ventricular fibres, MI causes AP delay which is almost the same even at higher heart rates. But, because of conduction contraction coupling [18], fibrillation may set in with MI and high rates. A slow conducting segment will contract incongruously with the rest of the myofibres, leading to fibrillation. The AP propagation time measurement and its continuous trend observation will help a long way to avert events.
2.1. Synchronous Recording technique and Measurement of AP Propagation Time
Digital display and electronic circuits have all along been used for various ECG applications, but as yet, we do not find any such measuring electronic instrument for the above measurement. Single action potential records from in-vitro cardiac Purkinje fibers from sheep have been displayed with digital electronic circuitry [19] and the maximum rate of rise of the AP has been measured by McGillvray et al [20], but so far, non-invasively, AP propagation time has not been measured with any instrument. An instrument to measure and display this propagation time in every heart beat is described in what follows.
Changes from 25 ms little by little, down to 15 ms, as the heart recovers can be observed as for example when an athlete relaxes after a peak performance. This is also useful to understand the efficacy of suitable drugs administered in the care unit. An instrument of this kind has not been described or manufactured for cardiac care so far.
Fig. 2 Pathological Q waves seen in Leads II and aVF
Suppose we place electrodes on the chest wall similar to the Frank System or the usual precordial V leads; in each heart beat, the action potential which propagates through the heart is sensed by the lead electrodes and the QRS complex spiky wave of the propagating action potential through the ventricular volume moves from the right to the left electrode within a time of about 15- 20 ms. For this purpose, we have to record all the electrode signals, say, those of the V leads, simultaneously. Usually, ECG waveforms for the Leads 1-3, the Auxiliary leads and the precordial leads are taken independently. Though these waveforms do not pertain to one and the same heart beat, the recorded waves indicate the pathology because there are not such fast changes in the beat to beat waveforms. The current ECG technique of recording with ECG Recording apparatus does not ordinarily use simultaneous recording.
When we arrange all the V lead electrodes all at once on the chest and record the waveforms differentially from the sets of leads, we are able to do a synchronous recording. Such a recording from several leads is able to indicate the propagation of the R wave from one set of electrodes to another. Since the sharp rising R wave on the external skin electrode coincides with the first rise of the intracellular action potential, we could follow the propagation of the AP through the ventricle in each and every heart beat. By measuring the time difference between the R waves in the first and the last V electrode, the propagation time is found. The value of this time is displayed directly in milliseconds, once in every two beats.
3. Cardiac Action potential propagation time – a Vital Single Parameter in Performing Hearts
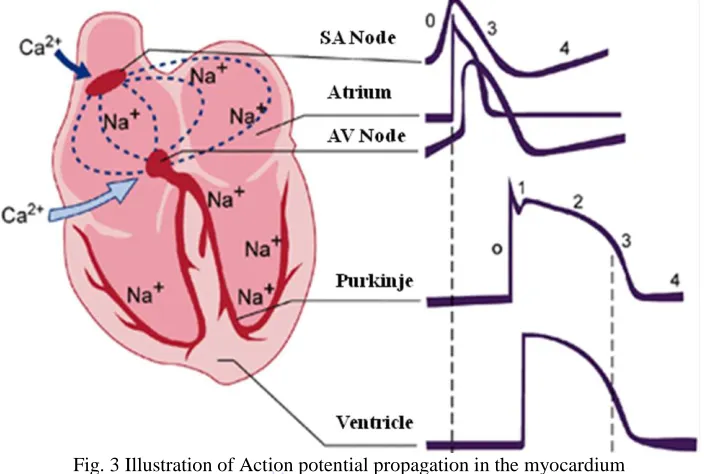
The action potential propagation in the ventricles is shown in the sketch of the anatomical figure given below. The wave propagates and completes it tour through the ventricle within a time of 10-20 ms and only in case of high stress and/or pathology, this time increases.
information about these symptoms sufficiently early. Thus far, the ECG has remained as the fundamental and first observation of the condition of a patient’s heart.
Fig. 3 Illustration of Action potential propagation in the myocardium
A delay in the AP Propagation is very useful for assessment of myocardial injury. This has been noted from the external ECG waveforms through Q wave changes, T wave abnormality, ST deviation and Q_T interval. Usually, Q wave width and height are the vital parameters for assessing myocardial injury. But, from the ECG waveform, one cannot note small changes in the Q wave width in its very small record. Also, one has to note such Q waves from among the several leads of ECG records. Thus, if we want to transmit the ECG based information, it is necessary to transmit the digital data of the waveforms from at least six ECG leads. But the positions of the leads in the standard pattern of ECG leads is cumbersome for an athlete. If we use a chest belt for recording the usual precordial leads (the so called V Leads), then also we need to worry about the fixing the electrodes on the chest for the person, which is rather infeasible. Further, by using the records from the V leads we can get only waveforms for V1 to V6, which would not pertain to either one and the same heart beat or even successive beats. What is required for a very useful monitoring in the tense moments of an athlete, say running a race, are the beat to beat changes. Beat to beat ECG recording is infeasible for the two reasons mentioned, viz., impossibility of placing the electrodes in the specified skin positions and the time gap that happens while recording the V1 to V6 waveforms.
So, in our technique, we had to find out an electrode set or system which is easy to wear and does not disturb the athlete in any way. For this purpose, we employed the recently developed EPICTM sensor tiny chips from Plessey Microelectronics.
These sensor chips come as integrated electrode cum preamplifier in a very small size. The person wears a small light belt on the chest. This belt has fixed electrode sensors (EPIC) such that they span the chest from right to left at positions which are fixed on the belt.
which is amplified by a total gain of 10 x 50 =500. This yields 500 mV to 2.5V. The sensors need Dual 5Volt supply at a very low current only and this could be obtained by a pair of 5 V Zener diodes connected to the +6 V supply. The 6 Volts supplies were obtained from rechargeable mini- Li-ion batteries in series.
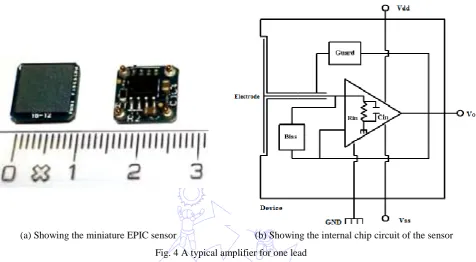
As the action potential propagates as shown in Fig. 4, the voltages picked up on the six electrodes are all simultaneously recorded in memory in a microcontroller module.
(a) Showing the miniature EPIC sensor (b) Showing the internal chip circuit of the sensor Fig. 4 A typical amplifier for one lead
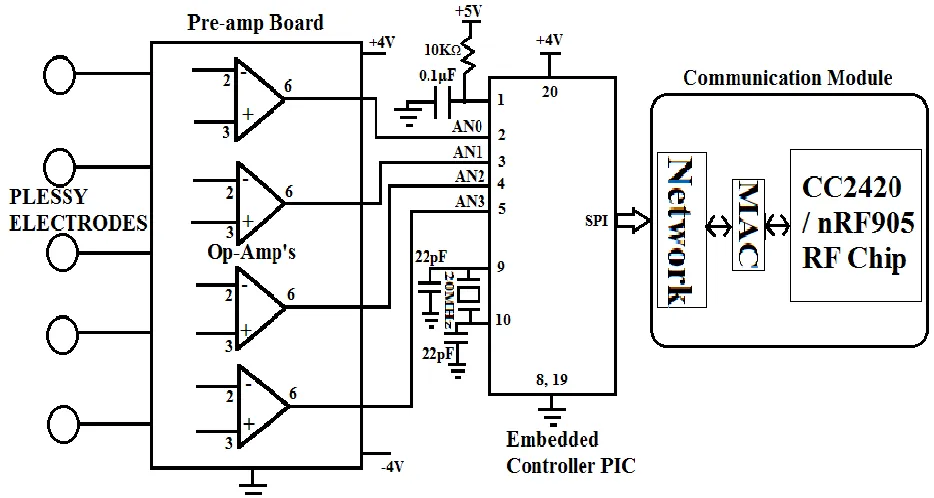
The circuit diagram of the same is as shown in Fig. 5. Here we are using PIC18F2550 microcontroller for acquiring the ECG signal and transmitting the propagation time delay through its communication port. To acquire the ECG signals from the body five EPIC electrodes are placed on the surface of the chest at equal distance positions in the transverse plane from right side to left side. The four Op-amp differential amplification signals are connected to the analog to-digital converters on the PIC18F2550 microcontroller pins 2 to 5. To get a level shifting, either a zener diode or ordinary silicon (IN4148) diodes are wired in series. The same signals were also wired to a four channel Agilent model Digital Storage Oscilloscope.
The program, in essence, finds the maximum point (QRS peak) of the four signals. The time differences between the signals are calculated based on the sampling rate. Amplified signals are processed by PIC microcontroller to find out the QRS peaks of each signal for every heart beat. Because of our heart beat range is 60 to 150, for a single ECG, the signal time is between 1 second to 0.4s. The ranges are digital values are 0 to 255 for 0 to VREF.
It was by taking the recorded digital values through an USB on the above instrument to the computer laptop and through Matlab programs, that we could get the displays and enumerate the time between the several wave peaks of QRS as well as the time course of propagation of the action potential from right side to the left side of the heart. 50 Hz noise is removed using Matlab filter program. The figure taken from MATLAB is for example, shown below.
through its multichannel fast ADC the samples of the signals from the electrode sets. Since the ADC time is just 50microseconds, the several channels are almost taken simultaneously, compared to the time of propagation which varies from 10-40ms, A local LCD module could be used to display the time of APP optionally. Since the circuit board comprising of these parts and battery is held in a small sized wallet along with RF communication unit, the same could be worn with little discomfort and weight.
Fig. 5 Schematic of EPIC sensor Electrodes, Differential Amplifier and Embedded controller
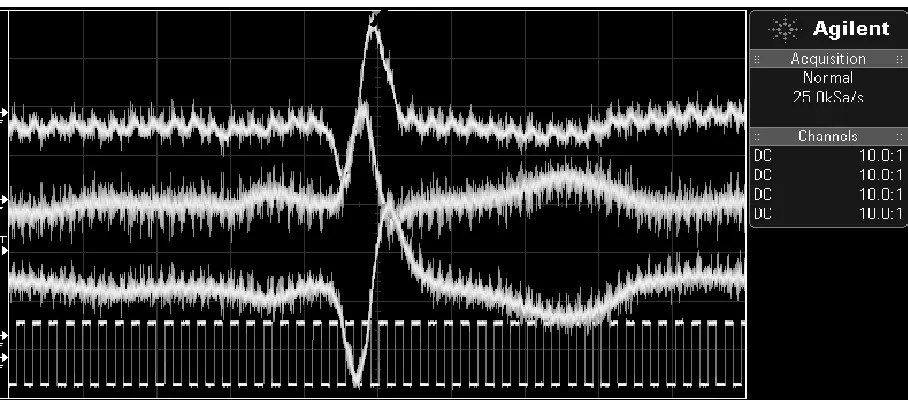
An example of the waveforms of three of these voltages (these waveforms are not transmitted at all) observed on a digital scope appears as in Fig. 6. This figures is given only to indicate how there is a time of propagation as noticeable from the peak positions.
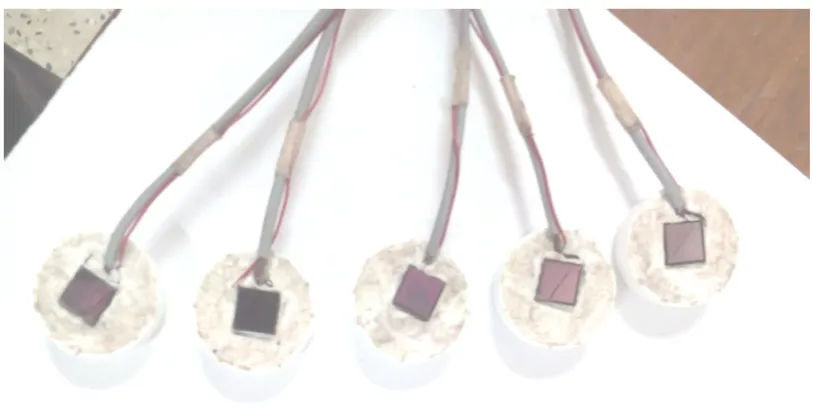
The six sensors used are fixed on a wearable light belt (Fig. 7) and connected by thin cables to the module worn by the athlete on a neck hanging band. The module houses the embedded controller which reads the signals from electrode pairs 1-2, 2-3, 3-4, 4-5 and 5-6. From the peak positions of the signals in each heart beat, the time difference from the 1-2 signal to the 5-6 signal indicates the propagation time of the ventricular action potential.
Since the EPIC s sensors possess the extreme advantage of not requiring any contact resistance reducing jelly as in the usual ECG electrodes, the mere wearing the belt on the unprepared chest of the athlete is sufficient to pick the voltages. The signal is capacitively coupled in this sensor through a very high input impedance integrated circuit amplifier built into it. A light touch on the skin is all that is needed.
Fig. 7 These miniature EPRI sensors and wires are connected to the neck module worn by the athlete These sensors are fixed with tape on a wearable light chest belt
This single parameter alone is able to indicate any sudden changes in the heart function, including onset of ischemia, or even a Myocardial Infarction (MI).
For this purpose, clinical tests on out-patients of cardiac pathology in a hospital were tested and the results indicate, as shown in a table below, as to how the action potential propagation time (APPT) is related to the usually observed parameters like Q wave width, S-T elevation/depression, which are indicative of cardiac stress leading to a pathological condition.
Table 1 Excerpt from Clinical Tests on Cardiac patients Pathology as per
ECG of patients
No. of patients examined
APP TIME T- inversion 2 10-15 ms RBB with Mild Q 3 30-40 ms RBB without Q 2 20-25 ms STEMI 4 25-30 ms NSTEMI 3 30-45ms
As far as patients with known conductance disturbance with or without Q wave of significance, the time delay due to Bundle Branch Block pathology gives readings in the 20-25ms for those without Q waves and 30-40ms with those who have an associated infarction at the time of their heart attack. Patients with T wave inversion are not gullible at all because T wave inversion due to Ischemia does not very much increase the TAPP. Thus from a group of patients, thus far it is learnt
that the TAPP will increase in the case of infarction and RBB and is a more decisive parameter for pathological classification
simultaneously, compared to the time of propagation which varies from 10-40ms. With a suitable reference voltage for the ADC, the accuracy of the time can be achieved up to 0.2 millisecond for the observed values.
3.1 Evaluating running race athletes
The APP time increases as the athlete is stressing to perform his best. This is because of the insufficient temporary blood supply to the ventricular tissue at the increased heart rate. It should also be mentioned that the APP time is independent of the heart beat time normally, but when ischemia sets in at the higher heart rate and the extreme stress put in by the performing athlete, the time increases from the normal 15 ms to 20, 21, 23, 25 ms and so on. We examined sportsmen in running race for a length of time and we could get the results of the changes in the APP time on the remote unit. However, unlike the cases of patients with cardiac pathology, the time did not go beyond 25 ms in the subjects tested. In case, it does exceed the normal value, the athlete is required to undergo a full cardiac diagnosis with an echocardiograph.
4. Wearable module for Wireless connectivity
The athlete, in addition to the chest nylon belt worn by him has a cell phone like module hanging on his neck belt and held concealed in his clothing. This module houses the following;
(1) The embedded controller for ADC and data acquisition from the electrodes (2) The battery set which is a pair of flat Li ion cells of capacity 1500mAh (3) The wireless transmitter module.
Several such modules are available. Kohvakka [21] has listed a set of then available transceiver of low power for connecting to a nearby node.
A wireless transceiver is based either on Radio Frequency (RF) .Most commercial short-range radio transceivers CC1000, CC1020 nRF905. We made our prototype with one such wireless transceiver module CC2420.
The schematic of the same is shown in Fig. 8.
Fig. 8 The schematic of the wireless transceiver Module
The following gives a short description of the C2400 – 2483.5 MHz RF Transceiver (2.4.GHz): (1) Direct Sequence Spread Spectrum (DSSS) transceiver
(3) O-QPSK with half sine pulse shaping modulation (4) On-chip VCO, LNA and PA
(5) Low supply voltage (2.1 – 3.6 V) with on-chip voltage regulator (6) Programmable output power
(7) I/Q low-IF soft decision receiver (8) I/Q direct up-conversion
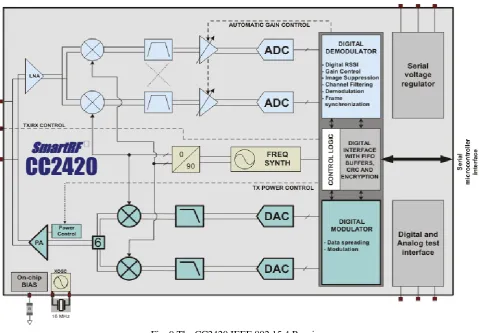
CC2420 features a low-IF receiver (Fig. 9). The received RF signal is amplified by the low noise amplifier (LNA) and down-converted in quadrature (I and Q) to the intermediate frequency (IF). At IF (2 MHz), the complex I/Q signal is filtered and amplified, and then digitized by the ADCs. Automatic gain control, final channel filtering, de-spreading, symbol correlation and byte synchronization are performed digitally.
Fig. 9 The CC2420 IEEE 802.15.4 Receiver
The CC2420 is based on direct up-conversion. The data is buffered in a 128 byte transmit FIFO (separate from the receive FIFO). The preamble and start of frame delimiter are generated by hardware. Each symbol (4 bits) is spread using the IEEE 802.15.4 spreading sequence to 32 chips and output to the digital-to-analog converters (DACs). An analog low pass filter passes the signal to the quadrature (I and Q) up-conversion mixers. The RF signal is amplified in the power amplifier (PA) and fed to the antenna. The internal T/R switch circuitry makes the antenna interface and matching easy. The RF connection is differential. A balun may be used for single-ended antennas. The biasing of the PA and LNA is done by connecting TXRX_SWITCH to RF_P and RF_N through an external DC path. The frequency synthesizer includes a completely on-chip LC VCO and a 90 degrees phase splitter for generating the I and Q LO signals to the down-conversion mixers in receive mode and up-conversion mixers in transmit mode. The VCO operates in the frequency range 4800 – 4966 MHz, and the frequency is divided by two when split in I and Q.
voltage. The voltage regulator may be enabled /disabled through a separate pin. A battery monitor may optionally be used to monitor the unregulated power supply voltage. The battery monitor is configurable through the SPI interface synthesizer. A digital lock signal is available from the PLL. The digital baseband includes support for frame handling, address recognition, data buffering and MAC security.
5. Conclusion
The paper gives a description of an experimental prototype for an instant to instant heart condition monitoring based on a single vital parameter – the Action Potential Propagation Time. It is proposed as a very useful system for athletes under high performance. The prophylactic advantage is the main theme and the same is served through the WSN and our novel method of cardiac function monitoring using the Action potential propagation time, in lieu of multiple lead ECG waveforms. It is very easy to estimate the changes as seen from the numbers of millisecond values of what we transmit rather than looking up the several ECG waveforms. Further, ECG waveforms are not taken all from one and the same heart beat. In a highly stressed and performing athlete, the beat to beat variations themselves are of concern and only our technique of seeing this value remotely through the WSN will prove to be good. The description of an experimental prototype for a instant to instant heart condition monitoring based on a single vital parameter – the Action Potential Propagation Time – as a very useful system for athletes under high performance.
References
[1] “Athletic stress: developing coping skills through sports,”
http://www.bethpageswimming.com/Various%20Docs/developing_coping_skills.pdf
[2] B. J. Maron and A. Pelliccia, “The heart of trained athletes: cardiac remodelling and the risks of sports, including sudden death,” Circulation, vol.114, no. 15, pp. 1633-1644, October 2006.
[3] B. J. Maron, “Sudden death in young athletes: lessons from the hank gathers affair,” New England of Medicine, vol. 329, pp. 55-57, July 1993.
[4] D. Corrado, C. Basso, A. Pavei, M. Schiavon, and G. Thiene, “Decline of sudden cardiac death in young competitive athletes after implementation of Italian pre-participation screening,” Circulation, vol. 112, no. 2, pp. 604-605, 2005. [5] B. J. Maron and D. P. Zipes, “Eligibility recommendations for competitive athletes with cardiovascular abnormalities,”
36th Bethesda Conference, Journal of American College of Cardiology, vol. 45, no. 8, pp. 1318-1321, April 2005. [6] A. Dhamdhere, H. Chen, A. Kurusingal, V. Sivaraman, and A. Burdett, “Experiments with wireless sensor networks
for real-time athlete monitoring,” Proc. IEEE Conference on Local Computer Networks, Oct. 2010, pp. 938-945. [7] X. Yong, “Design of the athlete's electrocardiogram monitoring and evaluation system based on wireless sensor
network,” Proc. Of IEEE First International Workshop on complexity and Data mining (IWCOM2011), September 2011, pp. 60-63.
[8] M. LeGoff, “ECG using wrist-mounted EPIC sensors,” Plessey Semiconductors Application Note 291465 Issue 1, pp. 1-2, http://www.plesseysemiconductors.com, 2010.
[9] S. Armstrong, “Wireless connectivity for health and sports monitoring: a review,” British Journal of Sports Medicine, vol. 41, no. 5, pp. 285-289, May 2007.
[10] R. Plonsey, “Bioelectric phenomena,” McGraw Hill Inc., 1970.
[11] P. Laguna, R. Jane, S. Olmos, N. V. Thakor, H. Rix, and P. Caminal, “Adaptive estimation of QRS complex wave features of ECG signal,” Medical & Biological Engineering & Computing, vol. 34, no. 1, pp. 58-68, January 1996. [12] I. K. Daskalov and I. I. Christov, “Automatic detection of ECG T wave end,” Medical & Biological Engineering &
Computing, vol. 37, pp. 348-354, May 1999.
[13] K. Padmanabhan, “Circuit to explain cardiac conduction and propagation,” Medical & Biological Engineering & Computing, vol. 15, no. 6, pp. 604-610, November 1977.
[14] S. Rohr, “Role of gap junctions in the propagation of cardiac action potential,” Cardiovascular Research, vol. 62, pp. 309-322, May 2004.
[16] R. M. Karim, H. A. Khawaja, S. Naz, S. S. Merchant, I. A. Momin, I. Lalani, and Asif A. Sewani , “Q wave and non Q wave myocardial infarction - a multivariate analysis,” Journal of Pakistan Medical Association, vol. 49, no. 6, pp. 149-154, June 1999.
[17] M. Goernig, B. Hoeffling, S. Lau, and H. R. Figulla, “T-vector and loop characteristics improve detection of
myocardial injury after infarction,” Medical & Biological Engineering & Computing, vol. 35, pp. 381-386, June 2015. [18] K. Padmanabhan and S. Ananthi, “Analysis of fibrillation and defibrillation to develop minimal energy defibrillator,”
Journal of Institution Engineers (India), vol. 89, no. 5, pp. 3-10, May 2008.
[19] M. B. Waxman, N. D. Berman, and E. Downer, “A method for on-line automatic beat to beat digital display of cardiac action potential duration,” Medical & Biological Engineering & Computing, vol. 14, no. 2, pp. 136-140, March 1976. [20] R. M. McGillvray and R. W. Wald, “Measurement of the maximum rate of rise of the cardiac AP,” Medical &
Biological Engineering & Computing, vol. 22, no. 3, pp. 275-276, May 1984.