_____________________________________________________________________________________________________
*Corresponding author: Email: [email protected];
6(3): 1-13, 2019; Article no.JERR.50396
The Design, Construction and Testing of an
Intelligent Device for Coating Flaws and Crack
Detection in Pipelines
A. R. Lana
1*and N. Idusuyi
11Department of Mechanical Engineering, University of Ibadan, Ibadan, Nigeria.
Authors’ contributions
This work was carried out in collaboration between both authors. Authors ARL and NI designed the study. Author ARL performed the statistical analysis, wrote the protocol and wrote the first draft of the manuscript. Author NI managed the analyses of the study and the literature searches.
Both authors read and approved the final manuscript.
Article Information
DOI: 10.9734/JERR/2019/v6i316952 Editor(s): (1) Dr. Heba Abdallah Mohamed Abdallah, Associate Professor, Department of Chemical Engineering, Engineering Research Division, National Research Centre, Egypt. Reviewers: (1) Danny Faturachman, Darma Persada University, Indonesia. (2)Kiran Devade, Pune University, India. (3)Rajinder Tiwari, Jammu University, India. (4)Makanjuola Oki, Landmark University, Nigeria. Complete Peer review History:http://www.sdiarticle3.com/review-history/50396
Received 17 May 2019 Accepted 27 July 2019 Published 06 August 2019
ABSTRACT
The major pollutant induced by pipeline failure in Oil and Gas industry has been mitigated over the years using non-destructive techniques like liquid penetrant, magnetic particles, radiographic, ultrasound and eddy current testing. The eddy current technique’s advantage over the other testing devices remains the best suitable in the design and construction of the devices due to the nature of the pipeline materials. For this present work, a pre-test-post-test experimental design was used to test devices on a defect free pipe and a pipe with machined defects of known dimensions and different orientation (longitudinal and axial) after construction. The defect detection was done using electromagnetic technique of eddy current by exciting a coil with power supply and placed close to the tested pipe surface, as a micro-controller was used to track the irregularities on the material surface by computer systems. The device set up for the test was a coil with a power supply of a DC battery connected with micro-controller of a quantization level of 4.88mV. For visual display,
Lana and Idusuyi; JERR, 6(3): 1-13, 2019; Article no.JERR.50396
result obtained indicates no variation in the amplitude of the pulse as demonstrated by a pipe with no defect while variations (deeps) occurred in the pipe with defects as the coil was traversed over the defect. The orientation had no significant effects on the sensitivity and effectiveness of the device. Results validation was done using a non-destructive technique by visual inspection. Thus, device has shown its effectiveness in detecting defects irrespective of the orientation. Similarly, the size of the defects is a determinant in the amplitude variation of the pulse displayed which implies at higher sensitivity, a high frequency is required.
Keywords: Eddy current; DC battery; micro controller; crack detection; pipeline failure; pipeline testing; non-destructive technique; quantization level.
1. INTRODUCTION
1.1 Background of the Study
It has been established that pipelines happened to be about the safest and most economical (in terms of energy usage) means for transporting products over any distance [1]. A high range of products from non-hazardous products like water to highly inflammable products like petroleum products are transported with pipelines [2]. The safety and integrity of pipelines are a matter of
principal importance due to the highly
inflammable nature of some of its transported substances [3]. Should a pipeline fail, the
transported content can cause extensive
environmental damage and also affect the population living and working by the pipeline. Furthermore, pipeline failure is linked with repair and excavation costs, cleaning costs, and loss of content [4]. The suspected origin of pipe failure was usually detected using a non-destructive technique, stress corrosion cracking (SCC) were observed on the failed pipe [5].Thus, this project entails the instigation of failure in pipelines as caused by flaws by adopting a suitable technique
like eddy current non-destructive testing
approach.
1.2 The Eddy Current Testing
Eddy current testing (ECT) technique is a widely applied non-destructive test (NDT) to detect defects and access structural reliability in pipelines materials [6]. The testing technique has nearly been perfected to detect cracks, sub-surface and coating flaws [7] using the electromagnetic principle. The range of thickness that ECT can handle is usually from the level of micrometres to the level of millimetres. The changes in the properties of the coil in conductivity and permeability condition when in contact with the material are detected by the eddy current testing device [8]. The substitution of the probes with the ring of coils will enable the
detection of possible surface detects without pipeline obstructions [9]. The choice of check parameters should be done with a deep understanding of the nature and technique of flaws. The device can handle a wide range of flaws such as coating flaws, cracks and so on. The in-depth understanding of this mentioned
flaws gave birth to the non-destructive
techniques, which is useful in the detection and identification of defects [10]. Thus, the present work design construct and test intelligent device with options for visual display benchmarking against existing non-destructive techniques for
testing flaws, identified and implemented
algorithms to detect coating flaws and cracks in pipeline structures in the intelligent device [11].
1.3 Crack Induced Due to Stress
Corrosion
Early detection of cracks induced by stress corrosion cracking and coating flaws will mitigate against the disastrous and sudden failure of pipelines [12]. Most oil and gas industries have been plagued in the recent years with spillage which has caused grave environmental pollution over the year which is estimated to have cost about $614billion and may span through a period of about 30years to clean up the affected environment [13].
Lana and Idusuyi; JERR, 6(3): 1-13, 2019; Article no.JERR.50396
1.4 Non-destructive Test Techniques for Pipelines
The non-destructive techniques are majorly used for research in mechanics of materials and maintenance check in the industry, this technique doesn’t in any way affect the structure of the material [16]. The most widely used non-destructive techniques that would be reviewed in the paper are electromagnetic, ultrasonic and liquid penetrant testing [17]. One of the conventional electromagnetic methods utilized for the inspection of conductive materials like copper, aluminium or steel is eddy current non-destructive testing which as shown in this work to be the most versatile and effective techniques of all the other techniques used for pipeline inspection.
When selecting an NDT technique, the first issue to be addressed is the type and size of the defect(s) that must be found as postulated in [18]. This was typically based on experience or, increasingly commonly, on fracture mechanics calculations. Visual inspection by production or maintenance personnel is the most widely applied NDT technique and is often used in conjunction with other methods. It frequently does not involve the purchase of specific NDT equipment. Depicted in Table 1 below are the most commonly used non-destructive techniques and a summary of their capabilities and demerits as sourced from Guriong, et al. [19].
1.5 The Ultrasonic Testing for Pipeline Defects
Defects can be detected using the principle of the propagation of sound waves in a material [20]. In the case of ultrasonic testing which is a very competent and reliable non-destructive testing technique, ultra-high-frequency sonic energy above the audible range is used in
locating and identifying defects in materials that are at any point in the pipeline materials
[21].
Research have shown that most ultrasonic testing in pipelines are done within the range of 1 – 5 MHz, but frequency range of 100MHz to 20KHz is used in specialist applications. Both shear and compression waves are mostly used and they detect defects through the change in acoustic impedance produced (product of density and speed of sound) in the path of the ultrasonic beam [22].
Ultrasonic testing is commonly used in the industries because of its ease to use, accuracy and its ability not to affect a material in any way for several purposes, one of which is quality control. It is also very useful in testing the integrity of materials used in the formation of pipes [23]. Ultrasonic waves require a medium to transmit its ultrasonic waves because it does not transmit well through air, solids or gels. It has been discovered over the years that water or
grease would conduct ultrasonic sounds
effectively between the transducer and the material to be tested [24]. Devices called pigs have been developed using ultrasonic waves to detect defects in the in-service pipelines, this has overcome the problem of getting the transducer into contact with an insulated pipe to be tested because it works from the inside of the
pipe by developing the device for assessing the inner walls of the underwater oil pipeline.
Lamb waves which is also an option of the waves that could be used for ultrasonic testing is
preferred for a very thick material just like the electromagnetic waves within a waveguide
[25].
1.5.1Merits and demerits of ultrasonic testing in pipelines
This can be deduced based on comparative or similar studies of ultrasonic testing and its application, likewise that its versatility and flexibility avails it for use on a wide range of materials. It poses no form of environmental hazard with very reliable, accurate and fast subsurface flaws detection when compared to the others [26]. It is important to mention the demerits which could pose certain limitations to the use of this device for defects detection on pipelines. A high level of expertise is required while operating the device and cracks parallel to the direction of the wave travelling through the material would not be detected [27]. It is a very expensive test which also requires couples (water or grease) as a medium for the transducer to transmit and receive waves.
1.6 Radiography Testing
Lana and Idusuyi; JERR, 6(3): 1-13, 2019; Article no.JERR.50396
Table 1. Commonly used NDT techniques
Technique Capabilities Limitation
Visual inspection Macroscopic surface flaws. Small flaws are difficult to detect, no
subsurface flaws.
Radiography Subsurface flaws Smallest defect detectable is 2% of the
thickness; radiation protection. No subsurface flaws not for porous materials.
Dye penetration Surface flaws No subsurface flaws not for porous
materials
Ultrasonic Subsurface flaws Material must be good conductor of
sound.
Magnetic particles Surface / near surface and
layer flaws.
Limited subsurface capability, only for ferromagnetic materials.
Eddy current for metals Surface and near surface
flaws
Difficult to interpret in some applications; only for metals.
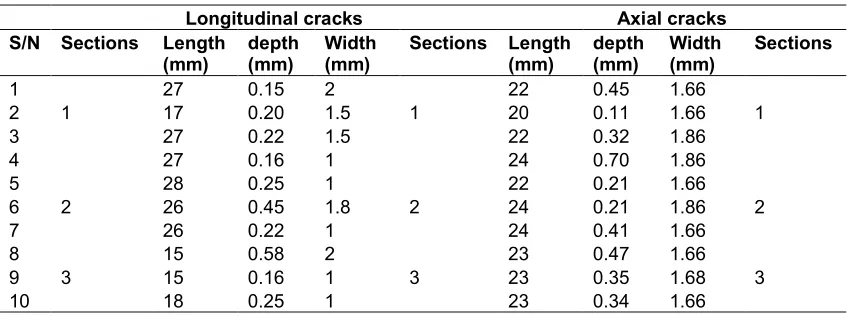
Table 2.Showing the longitudinal, axial cracks and their dimensions machined on the galvanized pipe
Longitudinal cracks Axial cracks S/N Sections Length
(mm)
depth (mm)
Width (mm)
Sections Length (mm)
depth (mm)
Width (mm)
Sections
1 1
27 0.15 2
1
22 0.45 1.66
1
2 17 0.20 1.5 20 0.11 1.66
3 27 0.22 1.5 22 0.32 1.86
4
2
27 0.16 1
2
24 0.70 1.86
2
5 28 0.25 1 22 0.21 1.66
6 26 0.45 1.8 24 0.21 1.86
7 26 0.22 1 24 0.41 1.66
8 3
15 0.58 2
3
23 0.47 1.66
3
9 15 0.16 1 23 0.35 1.68
10 18 0.25 1 23 0.34 1.66
seen as a light area in the image produced while an inclusion of higher density than the
parent material will appear darker [30].
Radiography tests can be carried out in several different forms and each has its specific applications. Below are different radiography tests. This includes the conventional radiograph which is the most appropriate for when the materials to be tested are not too dense or too thin. These types of radiography are useful in detecting large voids, inclusions, trans-laminar cracks, non-uniform fiber distribution, and fiber mis-orientation such as fiber wrinkles or weld lines [31]. The gamma ray radiography test which is good for dense materials because the gamma
rays have shorter wavelengths and the
penetrant-enhanced radiography which is
employed specifically to detect small matrix cracks and delamination in the material to be tested [32].
1.6.1 Varieties of radiographic testing method and applications
There are varieties of radiographic testing
methods for different applications. These
methods are film radiography, computed
radiography [28], computed tomography [9], and
digital radiography [3]. X-ray Computed
Tomography (XCT) is a non-destructive
Lana and Idusuyi; JERR, 6(3): 1-13, 2019; Article no.JERR.50396
disadvantage of radiography is the health hazard posed by radiation. It is expedient to know that radiation imaging method of NDE enjoys an advantage over many other NDE methods in that it is inherently pictorial and interpretation is to some extent intuitive. Analyzing and interpreting the images requires skill and experience but the casual user of radiation imaging services can easily recognize the item being imaged and can often recognize discontinuities without expert interpretation. Also, X-ray NDE is not as limited to the type of material it can study, unlike other NDE methods [34]. Radiation methods are suitable for sensing changes in elemental composition. It is especially applicable to finding voids, inclusions and open cracks and is often the method of choice for verification of internal assembly details. Radiation is dangerous and also high voltage is needed to generate most X-rays can be dangerous as well as the difficulty in
using heavy shielding materials. Also,
radiography is limited in utility for detecting cracks. For a crack to affect the transmission of radiation there must be an opening resulting in a local absence of material. A closed crack is not detectable using radiation. In addition, even when the crack has a finite opening, it will generally only be detectable in a radiograph at certain orientations [35]. Ideally the long dimension of the crack is parallel to the direction of radiation travel, i.e., this maximizes the radiation-crack interaction. Surface defects are often hard to distinguish with 2-D radiography [36]. Finally, they are very expensive and time consuming and require the use of highly trained
safety conscious engineers, scientists or
technicians.
1.6.2 Other crack testing methods in pipelines
Several other defect testing methods in pipelines include the use of liquid penetrants for detecting flaws has been validated in several literatures. The penetrant is usually applied by an aerosol and is drawn into small openings by capillary action. Following a dwell time, excess penetrant is removed from the surface and a developer in liquid or powder form is applied in Stander, et al. [37]. This developer absorbs penetrant drawn from discontinuities. Liquid penetrant inspection is used for testing critical parts and articles in aircraft building, ship building, power and
agricultural machine building, in railway
transport, and in other branches of industry. The merit and demerits of this method is that penetrant testing is a simple, inexpensive, and
sensitive non-destructive testing method. It allows the inspection of a large variety of materials, component parts, and systems for discontinuities that are open to the surface. Liquid penetrant is portable, it is often used in remote locations.it has been observed that it does not require high level of expertise compared to some other NDT methods, even
though careful attention to cleanliness,
procedures, and processing time is needed, and also comprehensive knowledge of types of discontinuities that may occur in the parts to be tested.
1.7 The Eddy Current Testing Principle
This testing uses the fact that when an alternating current coil induces an electro-magnetic field into a conductive test piece, a small current is created around the magnetic flux field; much like a magnetic field is generated around an electric current. The principle of eddy current is based on electromagnetic induction; this is best captured using the Maxwell equations.
D = εE (1)
B = µH (2)
J = σE (3)
The complex parameters in the above equations 1 to 3 are D, B, E, H and J and they represent electric flux density, magnetic flux density, electric field, magnetic field strength and current density respectively with ρ as electric charge density. With additional parameters of ε, μ and σ
which are electric permittivity, magnetic
permeability and electric conductivity. The flow pattern of this secondary current, called an "eddy" current, will be affected when it encounters a discontinuity in the test piece, and the change in the eddy current density can be
detected and used to characterize the
discontinuity causing that change.
2. EXPERIMENTAL PROCEDURE
2.1 Materials and Methods
Lana and Idusuyi; JERR, 6(3): 1-13, 2019; Article no.JERR.50396
parameters, including the magnetic field range, the operating frequency band and sensor dimensions that permit the selection of the most suitable sensor type for eddy current testing. After the broad discussion of the five most commonly used non- destructive techniques, Eddy current proved to be the most appropriate considering the property of the availed test material and the nature of the test to be conducted on it. For effective research and analysis, the system is divided into three modules, namely power source, microcontroller and data acquisition. In addition, the application of the eddy current technique in the device design, the experimental design for the test of the intelligent device and its procedures is well highlighted. The concluding part of this work focused on the signal processing of the output data for a good result.
2.2 Coil and Power Source
The power of this system was sourced from a direct current 12V battery which controls supply channel for the individual components. The advantages of using coils as sensors for the eddy currents are the simplicity of their construction, the huge dynamic range and the possibility of focusing the sensor which is confirmed by De Haan, et al. [11]. The coils used as the probe sensor is made of copper wires and circular in design. Special profile encircling probes are designed for researchers and manufacturers to control surface and sub-surface defects in products with special profiles and shapes. The four coils in total are homogenous in dimensions and properties, these coils are connected in series to form a chain round the pipe for easy and complete testing of the pipe. The inner and external diameters of the coils stand at 5mm and 15mm respectively. The length of each of the coils are 110mm with resistance of 40Ω and excitation current of 50mA. All this was done to achieve the required sensitivity of the probe which is vital in flaw detection. Tian, et al. [38] took the relationship between coil size and sensitivity into account and proposed a method for reconstructing the flaw in order to determine the crack’s depth. The coil had 600 number of turns and are connected to the microprocessor where the change in impedance experienced in the coil is filtered to leave only useful signal for processing as shown in Fig. 2.
The calibration of the device was done to ensure that the coils were sensitive enough to detect defects and to ascertain if the micro controller
was able to take the change of the impedance on the coil from analogue to digital for visual display which eases interpretation of the result.
2.2.1 The micro-controller
The micro controller chip was used to receive the analogue signals from the coil and remove noisy signals (through the use of common mode rejection ratio), process and concurrently send signals to the computer system for visual display. Its major constituency is the analogue to digital converter. The two important steps taken by this chip to perform its function includes:
Signal quantization: This step took the output voltage signal from the coil and the discretized it into resolution signals of 4.88mV. Thus, this can be mathematically shown:
= (4)
Where,
L (Number of analogues to digital converter bits) =10
Maximum voltage (Vmax) = 5V Minimum voltage (Vmin) = 0V
Encoding: This involves the conversion of resolution signals of 4.88mV into digital resolution. This was done with the use of the Arduino Nano device connected via a USB port to aid the transfer of the digital representation of the signal to the computer system for further review and analysis.
2.2.2 Visual display
Fig.1 (a). The metal plate used to calibrate the device
2.2.3 Experimental design for test
The device was initially calibrated with a steel plate 260mm by 35mm with 12 holes machined on it. The holes have dimensions of 12mm by 4mm and are evenly spaced along the surface of the plate with equidistance of 8mm. The dis on the screen showed clearly the effect of the holes on the coil that is been moved along the surface of the plate. The metal plate and also result from the calibration of the device using the steel plate are depicted in Fig. 1.
2.3 Designs for Eddy Current Testing Device
The result from the calibration was validated by doing a visual inspection of the metal plate, this was followed by testing the device on a pipe.
Fig. 2. Flow diagram denotes principal for eddy current testing device
Coil and power
Source
Signal conditioning
Analog to digital
Converter
Digital processing
(Arduino
Graphical user interface
(Processing 3)
(a)
Lana and Idusuyi; JERR, 6(3): 1-13, 2019; Article no.
(a). The metal plate used to calibrate (b) Result showing the twelve holes on tested device
Experimental design for test
The device was initially calibrated with a steel plate 260mm by 35mm with 12 holes machined on it. The holes have dimensions of 12mm by 4mm and are evenly spaced along the surface of the plate with equidistance of 8mm. The display on the screen showed clearly the effect of the holes on the coil that is been moved along the surface of the plate. The metal plate and also result from the calibration of the device using the
Current Testing
The result from the calibration was validated by doing a visual inspection of the metal plate, this was followed by testing the device on a pipe.
Two Galvanized test pipes were purchased and cut into smaller lengths of
internal diameter of 30 mm and external diameter of 31.72 mm. These measurements were done with a ruler and digital Vernier
caliper respectively while the abrasions
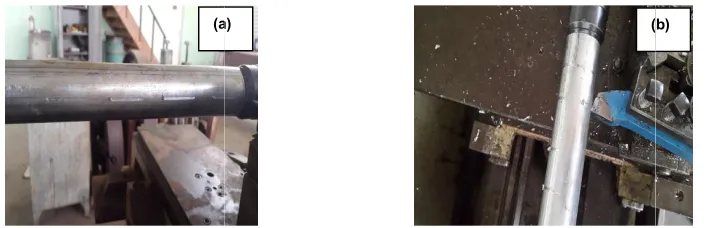
machined using the lathe machine. This is done to imitate a pipeline with cracks on it for the device to detect. The galvanized steel pipes were chosen because of its close similarity to the pipeline in terms of the material which is steel with resistivity of 1.43x10 7ρ (Ω.m) and conductivity of 6.99x10⁶ σ (s/m). Below are the two orientations of cracks (longitudinal and axial cracks) with their dimensions and also the machining processing that was done on each of the pipes as shown in Fig. 3.
diagram denotes principal for eddy current testing device
Signal conditioning
Analog to digital
Converter
Digital processing
Arduino Nano)
Micro controller
USB
Graphical user interface Processing 3)
(a) (b)
; Article no.JERR.50396
(b) Result showing the twelve holes on tested
Two Galvanized test pipes were purchased and cut into smaller lengths of 300mm with
mm and external mm. These measurements
were done with a ruler and digital Vernier
caliper respectively while the abrasions
machined using the lathe machine. This is done to imitate a pipeline with cracks on it for the device to detect. The galvanized steel pipes were chosen because of its close
similarity to the pipeline in terms of the ith resistivity of
1.43x10⁻⁷ρ (Ω.m) and conductivity of 6.99x10⁶ σ (s/m). Below are the two orientations of cracks (longitudinal and axial cracks) with their dimensions and also the machining processing that was done on each of the pipes as shown in
diagram denotes principal for eddy current testing device
Micro controller
Fig. 3. Different side view of the tested cracked device (a) Longitudinal (b) Axial
3. RESULTS AND DISCUSSION
This present work was done using an indigenous design for a compact and effective eddy current device and connecting coils in series for outer surface of pipe inspection using eddy current testing device. The non-destructive technique of eddy current testing was the basic principle on which this intelligent testing device
and constructed [39. The device was able to induce eddy current on the pipe (test material) through a coil and also give a visual display of the result from the change in impedance on the coil on computer system software (Processing 3) through a micro controller connected to it. The set up for the device constructed is shown below. This device does not only detect defects but will also help in monitoring and evaluating defe pipes.
3.1 Defects in Conductive Materials
The presence of a defect in a conductive material implies a region where electrical conductivity is null. If electrical currents are generated in the conductive material, in these regions they do not exist and paths are disturbed. In an open surface defect eddy currents can go around it, moving at the same horizontal plane, or can even immerse, passing underneath the crack [38]. Each of these behavioural occurrences depends on the crack length, on the crack depth and on the standard depth of penetration determined by the operating frequency and the electrical conductivity [39]. In this present work, experimental tests were performed on the test pipes containing machined axial and longitudinal defects with t
scanning an area over the crack. An operating frequency of 100 Hz was imposed to the excitation coil.
3.2 Eddy Current Testing Device
The device is basically made up of a circular coil with parameters as earlier stated in the
(a)
Lana and Idusuyi; JERR, 6(3): 1-13, 2019; Article no.
Fig. 3. Different side view of the tested cracked device (a) Longitudinal (b) Axial
DISCUSSION
This present work was done using an indigenous design for a compact and effective eddy current device and connecting coils in series for outer surface of pipe inspection using eddy current destructive technique esting was the basic principle on which this intelligent testing device was designed The device was able to induce eddy current on the pipe (test material) through a coil and also give a visual display of impedance on the coil on computer system software (Processing 3) through a micro controller connected to it. The set up for the device constructed is shown below. This device does not only detect defects but will also help in monitoring and evaluating defects on
Defects in Conductive Materials
The presence of a defect in a conductive material implies a region where electrical conductivity is null. If electrical currents are generated in the conductive material, in these regions they do not t and paths are disturbed. In an open surface defect eddy currents can go around it, moving at the same horizontal plane, or can even immerse, passing underneath the crack [38]. Each of these behavioural occurrences depends on the crack k depth and on the standard depth of penetration determined by the operating frequency and the electrical conductivity [39]. In this present work, experimental tests were performed on the test pipes containing machined axial and longitudinal defects with the setup in scanning an area over the crack. An operating frequency of 100 Hz was imposed to the
Eddy Current Testing Device
The device is basically made up of a circular coil with parameters as earlier stated in the
methodology which is powered by a direct current battery and also a micro controller that converts the analogue signals to digital and filters noisy signals [40]. This is connected to a computer system software (Processing 3) which displays the effect of the surface of the pipe on the coils. The complete set up of the eddy current device as shown in Fig. 4.
3.3 Experimental Test Design
A pre-test and post-test experimental design was employed in the testing of galvanized steel pipes. The pre-test was done on the galvanized pipe after which the post-test was done on a galvanized pipe with machined defects of both axial and longitudinal orientations as developed in the models.. First, the result of the pre
a defect free pipe is presented showing response of the coil to the impedance encountered on the pipe. Second, the result of the post-test on the pipe with both the longitudinally and axially machined defects showing the response of the coil to the impedance caused by the defects. Then lastl the test result from a half-coated pipe is also presented. All the cases mentioned involves scanning the surface of the pipe with the coils. A very strong algorithm was also developed to filter, magnify output response and also visually display an easy to interpret result. Validation was carried out using a Non-destructive technique.
3.3.1 Test on Defect Free Galvanized Steel Pipe
This test shows the response of the coil on a defect free pipe. At the start of the test lift off caused a little change in the pulse signal but as the test progressed it was eliminated by maintaining a constant distance between the coil and the pipe. The relatively straight pulse signal shown on the screen of the computer system was expected as the impedance on the coil was
(a) (b)
; Article no.JERR.50396
Fig. 3. Different side view of the tested cracked device (a) Longitudinal (b) Axial
methodology which is powered by a direct current battery and also a micro controller that converts the analogue signals to digital and filters noisy signals [40]. This is connected to a computer system software (Processing 3) which he surface of the pipe on the coils. The complete set up of the eddy
Experimental Test Design
test experimental design was employed in the testing of galvanized steel pipes. done on the galvanized pipe test was done on a galvanized pipe with machined defects of both axial and longitudinal orientations as developed First, the result of the pre-test on a defect free pipe is presented showing the response of the coil to the impedance encountered on the pipe. Second, the result of test on the pipe with both the longitudinally and axially machined defects showing the response of the coil to the impedance caused by the defects. Then lastly coated pipe is also presented. All the cases mentioned involves scanning the surface of the pipe with the coils. A very strong algorithm was also developed to filter, magnify output response and also visually o interpret result. Validation was
destructive technique.
Test on Defect Free Galvanized Steel
This test shows the response of the coil on a defect free pipe. At the start of the test lift off caused a little change in the pulse signal but as the test progressed it was eliminated by maintaining a constant distance between the coil relatively straight pulse signal shown on the screen of the computer system was expected as the impedance on the coil was
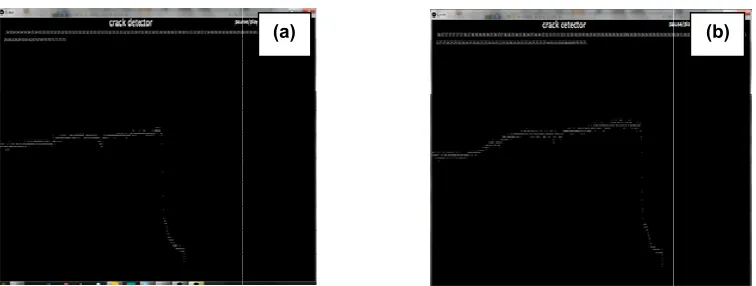
relatively constant and was not and altered in anyway due to absence of any form of defect on the test pipe. Shown below in Fig. 5 and are the visual display of the test conducted using the Processing 3 software on a computer system. The numbers at the top of the screen is just to show the numerical values of the nverse of the change in impedance on the coil which is in line with the pulse signal displayed.
Fig. 4. (a) Complete set-up of an eddy current test device (b) The Micro
Fig. 5.Result from the tested done galvanized pipe (a) without defects (b) with longitudinal
Fig. 6. Result from tested devices done galvanized pipe with longitudinal defects in
Lana and Idusuyi; JERR, 6(3): 1-13, 2019; Article no.
relatively constant and was not and altered in anyway due to absence of any form of defect on the test pipe. Shown below in Fig. 5 and Fig. 6 are the visual display of the test conducted using the Processing 3 software on a computer system. The numbers at the top of the screen is just to show the numerical values of the nverse of the change in impedance on the coil which is
the pulse signal displayed.
3.3.2 Test on axial cracks on a steel pipe
During the post-test carried out on the galvanized steel pipe at the first section lift off was completely eliminated which gave a more regular pulse signal compared to the longitudinal defects test. Pulse signal showed significant low amplitude at the points where the coil
up of an eddy current test device (b) The Micro-controller
Result from the tested done galvanized pipe (a) without defects (b) with longitudinal defects in section 1
Fig. 6. Result from tested devices done galvanized pipe with longitudinal defects in (a) section 2 (b) section 3
(a)
(a)
(a)
; Article no.JERR.50396
on a galvanized
test carried out on the galvanized steel pipe at the first section lift off was completely eliminated which gave a more regular pulse signal compared to the longitudinal defects signal showed significant low amplitude at the points where the coil
controller
Result from the tested done galvanized pipe (a) without defects (b) with longitudinal
Fig. 6. Result from tested devices done galvanized pipe with longitudinal defects in (b) (b)
Fig. 7. Result from tested devices
Fig. 8(a). Showing a half-coated pipe tested for coating flaws (b) Result of test galvanized pipe
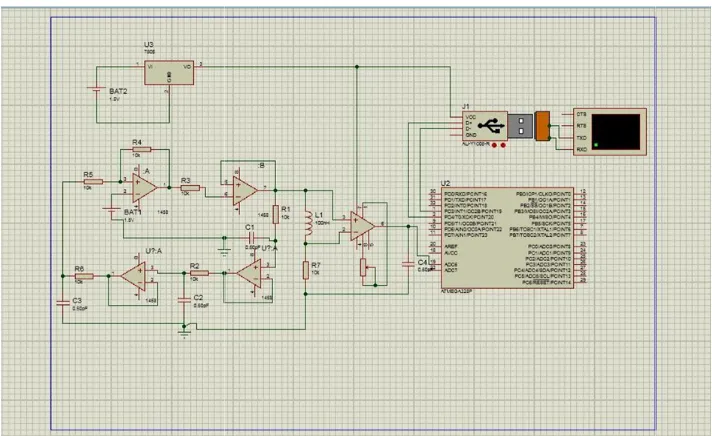
Fig. 9. Showing the circuit diagram for the micro controller
encountered defects which was a strong indication. The test on the second section showed also complete elimination of lift off with the pulse signal regular till defects were encountered by the coil. This was indicated
(a)
Lana and Idusuyi; JERR, 6(3): 1-13, 2019; Article no.
tested devicesdone galvanized pipe with axial defects in (a) section 1 (b) section 2 (c) section 3
pipe tested for coating flaws (b) Result of test galvanized pipe with coating flaws
. Showing the circuit diagram for the micro controller
encountered defects which was a strong indication. The test on the second section showed also complete elimination of lift off with the pulse signal regular till defects were encountered by the coil. This was indicated
distinctively by the low amplitude th
on the display. The third test carried out in the third section of the pipe also showed no visible lift off on the display. The pulse signal showed the expected low amplitude at the points of
(b)
(a)
; Article no.JERR.50396
done galvanized pipe with axial defects in (a) section 1
pipe tested for coating flaws (b) Result of test galvanized pipe
distinctively by the low amplitude that was seen on the display. The third test carried out in the third section of the pipe also showed no visible lift off on the display. The pulse signal showed the expected low amplitude at the points of
(c)
Lana and Idusuyi; JERR, 6(3): 1-13, 2019; Article no.JERR.50396
defects. The visual display of the results can be seen from Fig. 7 below, also showing the numerical values at the top of each of the display which is the inverse of the impedance on the coil as the test was been carried on and it is in line with the pulse signal displayed.
3.3.3 Test on coating flaws on a galvanized steel pipe
Coating flaws which is function of the variation in the thickness of coats on a pipe to keep it from rusting was also detected by testing the device on a pipe that was half coated with gloss paint as shown in Fig. 8(a) and the result from this test can be seen in the displayed in Fig. 8(b) below. There was no lift off experienced during the test and the test was done from the part not coated to the part coated. The gradual low amplitude on the pulse signal was an indication of gradual increase in the impedance which is as a result of the increase in thickness of the area covered by the coil as it moves on the surface of the pipe.
3.4 Validate of Test Device
All the result of the defects tested for on the galvanized pipe as depicted in was validated by using a non-destructive test of visual inspection and it was validated that though the change in pulse signal was not relative to the size of the defects being detected due to low sensitivity of the coil but it was effective in detection.
4. CONCLUSION
This present study gives a solution from the experimental test result that was done on pipelines with longitudinal defects, axial defects and coating flaws. The results confirmed that the designed and constructed intelligent device is able to detect these types of defect or flaws.
From the present experimental investigation, the following conclusions can be made:
The detection rate for this device on these
types of defect is relatively high and reliable. This indicates the proposed intelligent device is sensitive for different defect orientations and nature.
Detailed analysis on the signals for coating
flaws, axial and longitudinal defects shows that the indicating change in amplitude of the pulse signal is not affected by the orientation or nature of the defect.
Comparing the result from the calibration to that of the test it can be deduced that
different sizes of defect generate different pulse signal response, which is useful for defect classification.
The experimental design validated by the
visual inspection method of
non-destructive techniques shows the
effectiveness of the device.
COMPETING INTERESTS
Authors have declared that no competing interests exist.
REFERENCES
1. Carvalho AA, Robello J, Souza M, Segrilo L, Soares S. Reliability of non-destructive test techniques in the inspection of pipelines usedin the oil industry. Inter-national Journal of Pressure Vessels and Piping. Elsevier Limited. 2008;85(11):745– 751.
DOI: 10.1016/j.ijpvp.2008.05.001
2. Chesnokova AA, Kalayeva SZ, Ivanova
VA. Development of a flaw detection material for the magnetic particle method. Journal of Physics: Conference Series. 2017;881(1):120-122.
Available:http://stacks.iop.org/1742-6596/881/i=1/a=012022
3. Bernieri A, Betta G, Ieee M. Metrological characterization of an eddy-current-based system. 2000;1608–1611.
4. Chevil K. Investigation of corrosion and
crack morphology behavior under
disbonded coatings on pipelines; 2015. DOI: 10.1017/CBO9781107415324.004 5. Filipe RCM. Eddy current method for the
assessment of crack depths in metallic non-ferromagnetic plates, publishes thesis
for master degree in aerospace
engineering, portuguese science and technology university (FCT), Portugal; 2015.
6. Darvell BW. Radiography, materials
science for dentistry, woodhead publishing series in biomaterials. Tenth Edition. 2018; 665–698.
DOI:https://doi.org/10.1016/B978-0-08-101035-8.50026-2
7. Rifai D, Abdalla AN, Khamsah N, Aizat M, Fadzli M. Subsurface defects evaluation using eddy current testing. Indian Journal of Science and Technology. 2016;9(9):1-10.
DOI: 10.17485/ijst/2016/v9i9/88724
8. García-Martín J, Gómez-Gil J,
Lana and Idusuyi; JERR, 6(3): 1-13, 2019; Article no.JERR.50396
based on eddy current testing, sensors. 2011;11(3):2525–2565.
DOI: 10.3390/s110302525
9. Michaels JE. Detection, localization and
characterization of damage in plates with an in-situ array of spatially distributed ultrasonic sensors. 2008;1(17).
DOI: 10.1088/0964-1726/17/3/035035 10. Glazkov YA. Evaluation of material quality
for liquid-penetrant inspection based on the visibility of the indicator patterns of flaws. Russian Journal of Non-destructive Testing. 2012;48(4):208–217.
DOI: 10.1134/S1061830912040067
11. De Haan VO, De Jonga P. Towards
material characterization and thickness measurements using pulsed eddy currents implemented with an improved giant magneto resistance magnetometer, Ecndt. 2006;1–8.
Available:http://citeseerx.ist.psu.edu/viewd oc/summary?doi=10.1.1.159.3424
12. Jin-Su B, Sang-Young K. Hot wire
iinspection using eddy current,
proceedings of the 18th IEEE
Instrumenta-tion and Measurement Technology
Conference. Rediscovering Measurement in the Age of Informatics (Cat. No.01CH 37188). IEEE. 2001;962–965.
DOI: 10.1109/IMTC.2001.928222
13. Yokohama K, Onda T, Nagasaka T.
Environmental assessment of land-fill mining by using dynamic extension of waste input-output analysis. Journal of Life Cycle Assessment, Japan. 2006;2(1):73– 79.
DOI: 10.3370/lca.2.73
14. Yamada S, Chomsuwan K, Iwahara M.
Application of giant magnetoresistive
sensor for non-destructive evaluation. 5th IEEE Conference on Sensors. IEEE. 2006; 927–930.
DOI: 10.1109/ICSENS.2007.355618
15. Achebe CH, Nneke UC, Anisiji OE.
Analysis of oil pipeline failures in the oil and gas industries in the niger delta area of Nigeria; 2017.
16. Verma SK, Bhadauria SS, Akhtar S.
Review of nondestructive testing methods for condition monitoring of concrete structures. 2013;2(4):8-15.
17. Glazkov YA. Evaluation of material quality for liquid-penetrant inspection based on the visibility of the indicator patterns of flaws. Russian Journal of Non-destructive Testing. 2012;48(4):208–217.
DOI: 10.1134/S1061830912040067
18. Mgonja CT. Evaluation on use of industrial
radiography for weld joints inspection in Tanzania. 2017;8(5):65–74.
19. Guirong X, Xuesong G, Yuliang Q, Yan G.
Analysis and innovation for penetrant
testing for airplane parts, procedia
engineering. Elsevier. 2015;99(1):1438-1442.
DOI: 10.1016/j.proeng.2014.12.681
20. Wilkinson S, Duke SM. Comparative
testing of radiographic testing, ultrasonic testing and phased array advanced ultrasonic testing non destructive testing techniques in accordance with the AWS D1.5 Bridge Welding Code BDK84-977-26. 2014;38.
21. Shull PJ. Non-destructive evaluation:
Theory, techniques, and applications; 2002.
Available:http://allaboutmetallurgy.com/wp/
wp- content/uploads/2016/11/Nondestructive- Evaluation-Theory-Techniques-And-Applications_By_Peter_J_Shull.pdf 22. Xu B, Hong H. Intelligent eddy current
crack detection system design based on neuro-fuzzy logic Concordia University Examiner; 2014.
23. Alobaidi WM, Alkuam EA, Al-Rizzo HM,
Sandgren E. Applications of ultrasonic techniques in oil and gas pipeline industries: A review. American Journal of Operations Research. 2015;5(4):274– 287.
DOI: 10.4236/ajor.2015.54021
24. Rao BPC, Raj B, Jayakumar T,
Kalyanasundaram P, Arnold W. A new approach for restoration of eddy current
images. Journal of Nondestructive
Evaluation, Springer Link. 2001;20(2):61– 62.
DOI: 10.1023/A:1012292124404
25. Zhou HT, Hou K, Pan HL, Chen JJ, Wang
QM. Study on the optimization of eddy current testing coil and the defect detection sensitivity. Procedia Engineering. 2015; 130:1649–1657.
DOI: 10.1016/j.proeng.2015.12.331
26. Yi n W, Binns R, Dickinson SJ, Davis
Claire. Analysis of the liftoff for effect of phase spectra for eddy current sensors, instrumentation and measurement. IEEE Transactions. 2008;1(56):2775–2781. DOI: 10.1109/TIM.2007.908273
Lana and Idusuyi; JERR, 6(3): 1-13, 2019; Article no.JERR.50396
of Science and Technology. 2016;9(9):1-10.
DOI: 10.17485/ijst/2016/v9i9/88724
28. Yahaghi E, Movafeghi A, Mohmmadzadeh
N. Enhanced radiographic imaging of defects in aircraft structure materials with the dehazing method, non-destructive testing and evaluation. Taylor and Francis. 2015;30(2):138–146.
DOI: 10.1080/10589759.2015.1018254
29. Sigma Industrial Service. Liquid Penetrant;
2018.
Available:http://sigmaindustrial.co.za/liquid-penetrant-inspection
(Accessed: 14 August 2018)
30. ASNT. No Title, Introduction to NDT; 2017.
Available:https://www.asnt.org/MinorSiteSe ctions/AboutASNT/Intro-to-NDT
31. De Beer FC. Neutron- and x-ray
radio-graphy or tomoradio-graphy: Non-destructive analytical tools for the characterization of nuclear materials. Journal of the Southern African Institute of Mining and Metallurgy. The Southern African Institute of Mining and Metallurgy. 2015;115:10:913–924. DOI: 10.17159/2411-9717/2015/v115n10a3
32. Fahmy MNI, Hashish EA, Elshafiey I,
Jannound I. Advanced system for
automating eddy-current non-destructive
evaluation.ProceedingsoftheSeventeenth
National Radio Science Conference. 17th NRSC'2000 (IEEE Cat. No.00EX396), Minufiya, Egypt. 2000;H5/1-H5/8.
DOI: 10.1109/NRSC.2000.838977
33. Abushanab W. Oil transmission pipelines
condition monitoring using wavelet
analysis and ultrasonic techniques,
engineering. 2013;5(6):551-555. DOI: 10.4236/eng.2013.56066
34. Kasai N, Takada A, Fukuoka K, Aiyamam
H. Quantitative investigation of a standard test shim for magnetic particle testing. NDT and Elsevier International. 2011; 44(5):421–426.
DOI: 10.1016/j.ndteint.2011.03.004
35. Yang R, Yunze H, Zhang H. Progress and
trends in nondestructive testing and evaluation for wind turbine composite
blade. Journal of Renewable and
Susutainable Energy Review, Elsevier Publication. 2016;60(1):1225-1250. DOI: 10.1016/j.rser.2016.02.026
36. Yu YT, Zou Y, Al-Hosani M, Tian GY.
Conductivity invariance phenomenon of
eddy current NDT: Investigation,
verification, and application. IEEE
Transactions on Magnetics. 2017;53(1):1– 7.
DOI: 10.1109/TMAG.2016.2616328 37. Stander J. A novel multi-probe resistivity
approach to inspect green- state metal powder compacts. 1997;16(4):205–206. 38. Tian G, Li Y, Mandache C. Study of lift-off
invariance for pulsed eddy-current signals, magnetics, IEEE Transactions. 2009;1(45): 184–191.
39. Yokohama K, Onda T, Nagasaka T.
Environmental assessment of land-fill mining by using dynamic extension of waste input-output analysis. Journal of Life Cycle Assessment, Japan. 2006;2(1):73– 79.
DOI: 10.3370/lca.2.73
40. Rocha T, Pasadas D, Ribeiro AL, Ramos
HM. Characterization of defects on rivets using a eddy current technique with GMRs. IEEE International Instrumentation and Measurement Technology; 2012.
© 2019 Lana and Idusuyi; This is an Open Access article distributed under the terms of the Creative Commons Attribution License (http://creativecommons.org/licenses/by/4.0), which permits unrestricted use, distribution, and reproduction in any medium, provided the original work is properly cited.
Peer-review history: