On Equivalence Relationships Between Classification and
Ranking Algorithms
S¸eyda Ertekin [email protected]
Cynthia Rudin [email protected]
MIT Sloan School of Management Massachusetts Institute of Technology Cambridge, MA 02142, USA
Editor: Yoav Freund
Abstract
We demonstrate that there are machine learning algorithms that can achieve success for two sepa-rate tasks simultaneously, namely the tasks of classification and bipartite ranking. This means that advantages gained from solving one task can be carried over to the other task, such as the abil-ity to obtain conditional densabil-ity estimates, and an order-of-magnitude reduction in computational time for training the algorithm. It also means that some algorithms are robust to the choice of evaluation metric used; they can theoretically perform well when performance is measured either by a misclassification error or by a statistic of the ROC curve (such as the area under the curve). Specifically, we provide such an equivalence relationship between a generalization of Freund et al.’s RankBoost algorithm, called the “P-Norm Push,” and a particular cost-sensitive classification algorithm that generalizes AdaBoost, which we call “P-Classification.” We discuss and validate the potential benefits of this equivalence relationship, and perform controlled experiments to under-stand P-Classification’s empirical performance. There is no established equivalence relationship for logistic regression and its ranking counterpart, so we introduce a logistic-regression-style algo-rithm that aims in between classification and ranking, and has promising experimental performance with respect to both tasks.
Keywords: supervised classification, bipartite ranking, area under the curve, rank statistics, boost-ing, logistic regression
1. Introduction
The success of a machine learning algorithm can be judged in many different ways. Thus, algo-rithms that are somehow robust to multiple performance metrics may be more generally useful for a wide variety of problems. Experimental evaluations of machine learning algorithms tend to reflect this by considering several different measures of success (see, for example, the study of Caruana and Niculescu-Mizil, 2006). For instance, classification algorithms are commonly judged both by their classification accuracy and the Area Under the ROC curve (AUC), even though these algorithms are designed only to optimize the classification accuracy, and not the AUC.
Macready, 1997), we are not claiming that one algorithm can solve all problems. We instead point out that it is possible to optimize two objectives simultaneously if they have an overlapping set of optima. The objectives in this case are convexified versions of the performance metrics for classifi-cation and ranking. In this work, we show that a particular equivalence relationship exists between two algorithms: a ranking algorithm called the P-Norm Push (Rudin, 2009), which is a general-ization of RankBoost (Freund et al., 2003) that aims to maximize a weighted area under the curve, and a classification algorithm that we call P-Classification, which is a generalization of AdaBoost (Freund and Schapire, 1997) that aims to minimize a weighted misclassification error. Specifically, we show that P-Classification not only optimizes its objective, but also optimizes the objective of the P-Norm Push (and vice versa, the P-Norm Push can be made to optimize P-Classification’s ob-jective function). Thus, P-Classification and the P-Norm Push perform equally well on both of their objectives; P-Classification can be used as a ranking algorithm, and the P-Norm Push can be made into a classification algorithm. This equivalence relationship allows us to: 1) obtain conditional density estimates for P(y=1|x)for the P-Norm Push (and thus RankBoost as a special case), 2) ob-tain solutions of the P-Norm Push an order of magnitude faster without sacrificing the quality of the solution at all, and 3) show a relationship between the P-Norm Push’s objective and the “precision” metric used in Information Retrieval. This relationship will allow us to conduct a set of controlled experiments to better understand P-Classification’s empirical performance. It is not clear that such an equivalence relationship holds between logistic regression and its ranking counterpart; in fact, our experiments indicate that no such relationship can hold.
Bipartite ranking problems are similar to but distinct from binary classification problems. In both bipartite ranking and classification problems, the learner is given a training set of examples
{(x1,y1), . . . ,(xm,ym)} consisting of instances x∈
X
that are either positive (y=1) or negative (y=−1). The goal of bipartite ranking is to learn a real-valued ranking function f :X
→Rthat ranks future positive instances higher than negative ones. Bipartite ranking algorithms optimize rank statistics, such as the AUC. There is no decision boundary, and the absolute scores of the examples do not matter, instead the values of the scores relative to each other are important. Classification algorithms optimize a misclassification error, and are they are not designed to optimize rank statis-tics. The “equivalence” is where a classification (or ranking) algorithm aims to optimize not only a misclassification error, but also a rank statistic.esti-mates, and computing solutions faster. In Section 6 we discuss the relationship of P-Classification’s objective to the “precision” metric, and evaluate several parameters influencing the performance of P-Classification. As a result, we are able to suggest improvements to boost performance. Section 7 introduces a new logistic-regression-style algorithm that solves a problem in between classification and ranking, in the hopes of performing better than AdaBoost on both counts. Note that this work does not relate directly to work on reductions (e.g., Balcan et al., 2008), since in this work, the same set of features are used for both the classification and ranking problems without any modification. Another recent work that addresses the use of classification algorithms for solving ranking problems is that of Kotlowski et al. (2011), who show loss and regret bounds on the ranking performance of classifiers. Their analysis is useful when equivalence relationships, such as the ones we show here, do not hold.
2. Definitions
We denote the set of instances with positive labels as {xi}i=1,...,I, and the set of instances with negative labels as{x˜k}i=1,...,K, where xi,x˜k∈
X
. Throughout most of the paper, the subscripts i andk will be used as indices over positive and negative instances, respectively. We assume that(xi,yi) are drawn from a joint distribution D on
X
× {−1,1}. Our goal is to construct a scoring functionf :
X
→R which gives a real valued score to each instance inX
. LetF
denote the hypothesis space that is the class of convex combinations of features{hj}j=1...n, where hj:X
→ {−1,1}. The function f ∈F
is then defined as a linear combination of the features:f :=fλ:=
∑
jλjhj,
whereλ∈R
n will be chosen to minimize (or approximately minimize) an objective function. We
always include a y-intercept (feature that is 1 for all x), assigned to the index ¯j. This y-intercept term is important in the equivalence proof; in order to turn the P-Norm Push into a classification algorithm, we need to place a decision boundary by adjusting the y-intercept.
In bipartite ranking, the goal is to rank positive instances higher than the negative ones. The quality of a ranking function is often measured by the area under the ROC curve (AUC). The as-sociated misranking loss, related to 1−AUC, is the number of positive instances that are ranked below negative instances:
standard misranking loss(f) = I
∑
i=1K
∑
k=11[f(xi)≤f(xk˜)]. (1)
The ranking loss is zero when all negative instances are ranked below the positives instances. In binary classification, the goal is to correctly predict the true labels of positive and negative examples. The loss is measured by the misclassification error:
standard misclassification loss(f) = I
∑
i=11[f(xi)≤0]+ K
∑
k=11[f(xk˜)≥0]. (2)
and Schapire, 1997) is one such example:
R
AB(λ):=I
∑
i=1e−fλ(xi)+
K
∑
k=1efλ(xk˜)=:
R
AB+ (λ) +
R
−AB(λ). (3)The ranking counterpart of AdaBoost is RankBoost (Freund et al., 2003). RankBoost’s objective function is a sum of exponentiated differences in scores, a convexified version of (1):
R
RB(λ):=I
∑
i=1K
∑
k=1e−(fλ(xi)−fλ(xk˜))
= I
∑
i=1e−fλ(xi)
K
∑
k=1efλ(xk˜)
=
R
+AB(λ)R
−AB(λ). (4)A generalization of RankBoost that is considered in this paper is the P-Norm Push (Rudin, 2009), which minimizes the following objective:
R
PN(λ):=K
∑
k=1I
∑
i=1e−(fλ(xi)−fλ(xk˜))
!p
.
By increasing p, one changes how hard the algorithm concentrates on “pushing” high scoring neg-ative examples down from the top of the list. The power p acts as a soft maximum for the highest scoring negative instance. When p=1, P-Norm Push’s objective reduces to RankBoost’s objective. We also investigate the equivalence relationship between logistic regression and its ranking counterpart, which we call “Logistic Regression Ranking” (LRR). Logistic regression minimizes the objective:
R
LR(λ):=I
∑
i=1log1+e−fλ(xi)
+ K
∑
k=1log1+efλ(xk˜)
, (5)
whereas LRR is defined with the following objective:
R
LRR(λ):=I
∑
i=1K
∑
k=1log
1+e−(fλ(xi)−fλ(xk˜))
. (6)
LRR bears a strong resemblance to the algorithm RankNet (Burges et al., 2005) in that its objective (6) is similar to the second term of RankNet’s objective (Equation 3 in Burges et al., 2005). LRR’s objective (6) is an upper bound on the 0-1 ranking loss in (1), using the logistic loss log(1+e−z)to upper bound the 0-1 loss1z≤0.
3. Equivalence Relationships
We now introduce P-Classification, which is a boosting-style algorithm that minimizes a weighted misclassification error. Like the P-Norm Push, it concentrates on “pushing” the negative examples down from the top of the list. Unlike the P-Norm Push, it minimizes a weighted misclassification error (rather than a weighted misranking error), though we will show that minimization of either objective yields an equally good result for either problem. P-Classification minimizes the following loss:
R
PC(λ):=I
∑
i=1e−fλ(xi)+1 p
K
∑
k=1efλ(xk˜)p=
where fλ=∑jλjhj. P-Classification is a generalization of AdaBoost, in that when p=1 (i.e., no emphasis on the top-scoring negatives), P-Classification’s loss reduces exactly to that of Ada-Boost’s. We implemented P-Classification as coordinate descent (functional gradient descent) on
R
PC(λ). Pseudocode is presented in Figure 1, using the notation of Collins et al. (2002), where i is the index over all examples (not just positive examples), and M is the “game matrix” for Ada-Boost, where Mi j=yihj(xi). AdaBoost was originally shown to be a coordinate descent algorithm by Breiman (1997), Friedman et al. (2000), R¨atsch et al. (2001), Duffy and Helmbold (1999) and Mason et al. (2000).1. Input: examples {(xi,yi)}im=1, where (xi,yi)∈
X
× {−1,1}, features{hj}nj=1, hj:X
→R, number of iterations tmax, parameter p.2. Define: Mi j:=yihj(xi)for all i,j,
φi:=1{yi=1}+p1{yi=−1}for all i.
3. Initialize:λ1,j=0 for j=1, . . . ,n, d1,i=1/m for i=1, . . . ,m. 4. Loop for t=1, ...,tmax
(a) jt∈argmaxj∑mi=1dt,iMi j
(b) Perform a linesearch forαt. That is, find a valueαt that minimizes:
m
∑
i=1dt,iMi,jte−αtφiMi,jt
!2
(c) λt+1,j=λt,j+αt1j=jt
(d) dt+1,i=dt,ie−αtφiMi,jt for i=1, . . . ,m (e) dt+1,i=∑dt+1,i
idt+1,i
5. Output:λt max
Figure 1: Pseudocode for the P-Classification algorithm.
There are other cost-sensitive boosting algorithms similar to P-Classification. Sun et al. (2007) introduced three “modifications” of AdaBoost’s weight update scheme, in order to make it cost sensitive. Modifications I and II incorporate an arbitrary constant (a cost item) for each example somewhere within the update scheme, where the third modification is a blend of Modifications I and II. Since Sun et al. (2007) consider the iteration scheme itself, some of their modifications are not easy to interpret with respect to a global objective, particularly Modification II (and thus III). Although no global objective is provided explicitly, Modification I seems to correspond to approx-imate minimization of the following objective: h∑iCi1e−(Mλi)Ci
i
is another cost-sensitive variation of AdaBoost, however it is not associated with a global objective and in our experiments (not shown here) it tended to choose the intercept repeatedly as the weak classifier, and thus the combined classifier was also the intercept. Lozano and Abe (2008) also use
ℓpnorms within a boosting-style algorithm, but for the problem of label ranking instead of example ranking. However, their objective is totally different than ours; for instance, it does not correspond directly to a 0-1 misranking loss like (1).
We will now show that the P-Norm Push is equivalent to P-Classification, meaning that mini-mizers of P-Classification’s objective are also minimini-mizers of the P-Norm Push’s objective, and that there is a trivial transformation of the P-Norm Push’s output that will minimize P-Classification’s objective. This trivial transformation simply puts a decision boundary in the right place. This proof will generalize the result of Rudin and Schapire (2009), but with a simpler proof strategy; since there are pathological cases where minimizers of the objectives occur only at infinity, the result of Rudin and Schapire (2009) used a Bregman distance technique to incorporate these points at infin-ity. Our proof does not handle the cases at infinity, but does handle, in a much simpler way, all other cases. These points at infinity occur because the objectives
R
PC andR
PN are not strictly convex (though they are convex). For AdaBoost, there is work showing that the minimization problem can be essentially split into two subproblems, one which handles examples near the decision boundary and is strictly convex, and the other which handles examples that become infinitely far away from the boundary (Mukherjee et al., 2011).The forward direction of the equivalence relationship is as follows:
Theorem 1 (P-Classification minimizes P-Norm Push’s objective)
IfλPC∈argminλ
R
PC(λ)(assuming minimizers exist), thenλPC∈argminλR
PN(λ).The corresponding proof within Rudin and Schapire (2009) used four main steps, which we follow also in our proof: 1) characterizing the conditions to be at a minimizer of the classification objective function, 2) using those conditions to develop a “skew” condition on the classes, 3) characterizing the conditions to be at a minimizer of the ranking objective function and 4) plugging the skew condition into the equations arising from step 3, and simplifying to show that a minimizer of the classification objective is also a minimizer of the ranking objective.
Proof Step 1 is to characterize the conditions to be at a minimizer of the classification loss. Define
λPCto be a minimizer of
R
PC(assuming minimizers exist). AtλPCwe have: for all j=1, . . . ,n:0=∂
R
PC(λ)∂λj
λ
=λPC = K
∑
k=1ep∑jλPCj hj(xk˜)h j(x˜k) +
I
∑
i=1e−∑jλPCj hj(xi)(−h j(xi))
= K
∑
k=1vkphj(x˜k) + I
∑
i=1qi(−hj(xi)) (8)
where vk:=efλPC(xk˜)and qi:=e−fλPC(xi).
Step 2 is to develop a skew condition on the classes. When j is ¯j then hj(xi) =1 for all i, and
hj(x˜k) =1 for all k. Using this, we can derive the skew condition:
0= K
∑
k=1vkp−
I
∑
i=1Step 3 is to characterize the conditions to be at a minimizer of the ranking loss. First we simplify the derivatives:
∂
R
PN(λ)∂λj
= K
∑
k=1p
I
∑
i=1e(−fλ(xi)−fλ(xk˜))
!p−1"
I
∑
i=1e−(fλ(xi)−fλ(xk˜))[−(h
j(xi)−hj(x˜k))]
#
= p
K
∑
k=1efλ(xk˜)p
I
∑
i=1e−fλ(xi)
!p−1
hj(x˜k) I
∑
i=1e−fλ(xi)
−
I
∑
i=1hj(xi)e−fλ(xi)
!
= p
I
∑
i=1e−fλ(xi)
!p−1"
K
∑
k=1hj(x˜k)efλ(x˜k)p I
∑
i=1e−fλ(xi)
−
K
∑
k=1efλ(xk˜)p
I
∑
i=1hj(xi)e−fλ(xi)
#
. (10)
To be at a minimizer, the derivatives above must all be zero. Continuing to step 4, whenλ=λPC,
we have:
∂
R
PN(λ)∂λj
λ
=λPC = p I
∑
i=1qi
!p−1"
K
∑
k=1hj(x˜k)vkp I
∑
i=1qi− K
∑
k=1vkp
I
∑
i=1hj(xi)qi
#
.
Using the skew condition (9), and then (8),
∂
R
PN(λ)∂λj
λ
=λPC = p I
∑
i=1qi
!p−1
I
∑
i=1qi
! "
K
∑
k=1hj(x˜k)vkp− I
∑
i=1hj(xi)qi
#
= p
I
∑
i=1qi
!p
∂
R
PC(λ)∂λj
λ
=λPC =0. (11)
This means thatλPCis a minimizer of the P-Norm Push’s objective.
The backwards direction of the equivalence relationship is as follows:
Theorem 2 (The P-Norm Push can be trivially altered to minimize P-Classification’s objective.)
Let ¯j index the constant feature h¯j(x) =1 ∀x. TakeλPN ∈argminλ
R
PN(λ)(assuming minimizersexist). Create a “corrected”λPN,corras follows:
λPN,corr=λPN+b·e¯j,
where
b= 1
p+1ln
∑ie−fλPN(xi)
∑kefλPN(xk˜)p
. (12)
Then,λPN,corr∈argminλ
R
PC(λ).show that the corrected vector λPN,corr satisfies the skew condition; then by deriving an expres-sion similar to (11), we show that if the corrected P-Norm Push’s derivatives are zero, then so are P-Classification’s derivatives at the corrected P-Norm Push’s solution.
Proof We will first show that the skew condition is satisfied for corrected vector λPN,corr. The
condition we need to prove is:
I
∑
i=1qcorri = K
∑
k=1(vcorrk )p (skew condition), (13) where vcorrk :=efλPN,corr(xk˜)and qcorr
i :=e−fλPN,corr(xi). From (12), we have:
e−b=
"
∑kefλPN(xk˜)p
∑ie−fλPN(xi)
#p+11
.
The left side of (13) thus reduces as follows:
I
∑
i=1qcorri = I
∑
i=1e−fλPN(xi)−b=e−b I
∑
i=1e−fλPN(xi)
=
"
∑K
k=1efλPN(xk˜)p
∑I
i=1e−fλPN(xi)
#p+11
I
∑
i=1e−fλPN(xi)
=
"
I
∑
i=1e−fλPN(xi)
#p+p1"
K
∑
k=1efλPN(xk˜)p
#p+11
. (14)
Now consider the right side:
K
∑
k=1(vcorrk )p=
∑
K k=1efλPN(xk˜)pebp
= K
∑
k=1efλPN(xk˜)p
"
∑I
i=1e−fλPN(xi)
∑kefλPN(xk˜)p
#p+p1
=
"
I
∑
i=1e−fλPN(xi)
#p+p1"
K
∑
k=1efλPN(xk˜)p
#p+11
. (15)
Expression (14) is equal to expression (15), so the skew condition in (13) holds. According to (10), atλ=λPN,corr,
∂
R
PN(λ)∂λj
λ
=λPN,corr =p
∑
i
qcorri
!p−1"
∑
khj(x˜k)(vcorrk )p
∑
iqcorri
−
∑
k
(vcorrk )p
∑
ihj(xi)qcorri
#
.
Incorporating (13),
∂RPN(λ)
∂λj
λ
=λPN,corr=p
∑
i
qcorri
!p"
∑
khj(x˜k)(vcorrk )p−
∑
ihj(xi)qcorri
#
which includes the derivatives of
R
PC:∂
R
PN(λ)∂λj
λ
=λPN,corr=p
∑
i
qcorri
!p
∂
R
PC(λ)∂λj
λ
=λPN,corr
.
By our assumption that λPN,corr exists, ∑iqcorr
i is positive and finite. Thus, whenever
∂RPN(λ)
∂λj
λ
=λPN,corr =0 for all j we have
∂
R
PC(λ)∂λj
λ
=λPN,corr=0.
We need only that ∂R∂λPN(λ) j
λ
=λPN,corr=0, ∀j. This is not difficult to show, since the correction
b never influences the value of
R
PN, that is,R
PN(λ) =R
PN(λcorr).As an alternative to P-Classification, we consider a simple weighted version of AdaBoost. The objective for this algorithm, which we call “Cost-Sensitive AdaBoost,” is a weighted combination of
R
−ABandR
+AB. The objective is:R
CSA(λ):=I
∑
i=1e−fλ(xi)
+C
K
∑
k=1efλ(xk˜)
=:
R
+AB(λ) +CR
−AB(λ).Cost-Sensitive AdaBoost can be implemented by using AdaBoost’s usual update scheme, where the only change from AdaBoost is the initial weight vector: d0is set so that the negatives are each weighted C times as much as the positives.
No matter what C is, we prove that Cost-Sensitive AdaBoost minimizes RankBoost’s objective. This indicates that Cost-Sensitive AdaBoost is not fundamentally different than AdaBoost itself. To show this, we prove the forward direction of the equivalence relationship between Cost-Sensitive AdaBoost (for any C) and RankBoost. We did not get this type of result earlier for P-Classification, because P-Classification produces different solutions than AdaBoost (and the P-Norm Push pro-duces different solutions than RankBoost). Here is the forward direction of the equivalence rela-tionship:
Theorem 3 (Cost-Sensitive AdaBoost minimizes RankBoost’s objective.)
IfλCSA∈argminλ
R
CSA(λ)(assuming minimizers exist), thenλCSA∈argminλR
RB(λ).The proof follows the same four steps outlined for the proof of Theorem 1.
Proof DefineλCSAto be a minimizer of
R
CSA(assuming minimizers exist). AtλCSAwe have:0=∂
R
CSA(λ)∂λj
λ
=λCSA =
∂
R
+AB(λ)∂λj
+C∂
R
AB
− (λ)
∂λj
= I
∑
i=1qi(−hj(xi)) +C K
∑
k=1vkhj(x˜k) (16)
where vk :=efλCSA(xk˜) and q
i:=e−fλCSA(xi). The next step is to develop a skew condition on the
0=C
K
∑
k=1vk− I
∑
i=1qi:=C
R
−AB(λCSA)−R
+AB(λCSA). (skew condition)We now characterize the conditions to be at a minimizer of the ranking loss. We plug the skew condition into the derivatives from RankBoost’s objective, which is given in (4):
∂
R
RB(λ)∂λj
= K
∑
k=1hj(x˜k)vk I
∑
i=1qi− K
∑
k=1vk I
∑
i=1hj(xi)qi
= K
∑
k=1hj(x˜k)vk
"
C
K
∑
k=1vk # − " K
∑
k=1vk
#
I
∑
i=1hj(xi)qi
=
"
K
∑
k=1vk
# "
C
K
∑
k=1hj(x˜k)vk− I
∑
i=1hj(xi)qi
#
.
To be at a minimizer, the derivative must be zero. Whenλ=λCSA, from (16) we have:
∂
R
RB(λ)∂λj
λ
=λCSA =
"
K
∑
k=1vk
#
∂
R
CSA(λ)∂λj
λ
=λCSA =0.
This means thatλCSAis a minimizer of RankBoost’s objective, regardless of the value of C.
4. Verification of Theoretical Results
The previous section presented theoretical results; in this section and in the following sections we demonstrate that these results can have direct implications for empirical practice. The equivalence of P-Classification and P-Norm Push can be observed easily in experiments, both in the special case
p=1 (AdaBoost and RankBoost are equivalent, Section 4.2) as well as for their generalizations when p>1 (in Section 4.3). We further investigated whether a similar equivalence property holds for logistic regression and Logistic Regression Ranking (“LRR,” defined in Section 2). We present empirical evidence in Section 4.4 suggesting that such an equivalence relationship does not hold between these two algorithms. Both algorithms have been implemented as coordinate descent on their objectives. Coordinate descent was first suggested for logistic regression by Friedman et al. (2000).
4.1 Data Sets
Data Set # Training examples # Test examples # Features
Letter Recognition 1000 4000 15
MAGIC 1000 4000 11
Yeast 500 984 9
Banana 1000 4000 5
Table 1: Sizes of training/test sets used in the experiments. The number of features column repre-sents the total number of features for the data sets, including the intercept.
protein. Banana is an artificial data set with a banana-shaped distribution of two classes, represented by two features.
For MAGIC, Letter Recognition, and Yeast data sets, the weight of each feature hj(xi) was quantized into -1 or +1 based on thresholding on meanihj(xi). The MAGIC data set was not further pre-processed beyond this, and “hadrons” were used as the positive class. For the Letter Recognition data set, we transformed the data set to two distinct categories, where the letter A represents the positive class and the remaining letters collectively form the negative class. This transformation created a highly imbalanced data set and presented a challenge in our experimental setup for the RankBoost algorithm, which, in its original implementation uses an analytical solution for the line search for αt at each iteration. In particular, the analytical solution requires that the fraction in the expression for αt (Equation 2 in Freund et al., 2003) is neither zero nor infinity. To ensure this, each feature hj in the training set must have at least one positive example where hj=1 and a negative example where hj =−1, and similarly, the training set should also contain at least one positive example where hj =−1 and a negative example where hj =1. Our random sampling of the training sets for the Letter Recognition data set did not often satisfy the requirement on the positive examples for “x2bar” and “x-ege” features; we thus removed these two features. Note that we could not use RankBoost in its original form, since our features are{−1,1}-valued rather than
{0,1}-valued. We simply rederived Equation 2 in Freund et al. (2003) to accommodate this. For the Yeast data set, from the 10 different classes of localization sites, we used CYT (cytosolic or cytoskeletal) as the positive class and combined the remaining 9 classes as the negative class. We used the 8 numerical features of the Yeast data set and omitted the categorical feature. We increased the number of features of the Banana data set by mapping the original two features{x1,x2}to a new four-dimensional feature space{x′1,x′′1,x′2,x′′2}by thresholding the original feature values at values of−4 and−2. Namely, we used the mapping:
x′i=
(
+1 if xi>−2
−1 otherwise and x
′′
i =
(
+1 if xi>−4
−1 otherwise.
for i=1,2. The experimental results reported in this section are averaged over 10 random and distinct train/test splits. The size of train/test splits for each data set and the number of features are presented in Table 1.
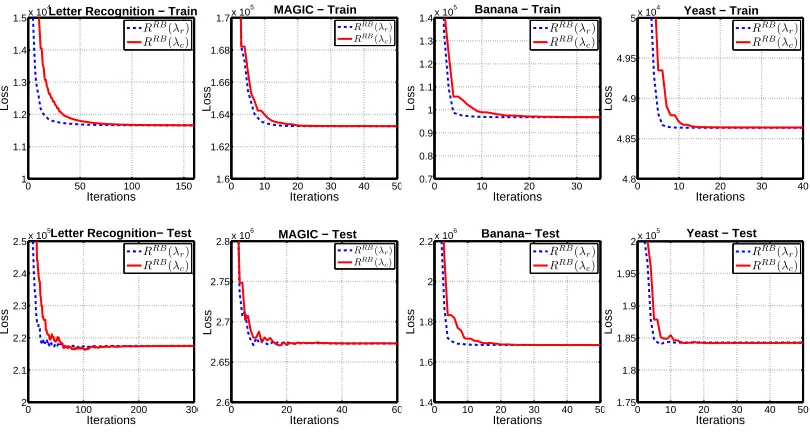
4.2 Equivalence of AdaBoost and RankBoost
0 50 100 150 1 1.1 1.2 1.3 1.4 1.5x 10
4
Iterations
Loss
Letter Recognition − Train
RRB(λr) RRB(λc)
0 10 20 30 40 50
1.6 1.62 1.64 1.66 1.68
1.7x 10
5
Iterations
Loss
MAGIC − Train
RRB
(λr)
RRB
(λc)
0 10 20 30
0.7 0.8 0.9 1 1.1 1.2 1.3 1.4x 10
5
Iterations
Loss
Banana − Train
RRB(λr) RRB(λc)
0 10 20 30 40
4.8 4.85 4.9 4.95
5x 10
4
Iterations
Loss
Yeast − Train
RRB(λr)
RRB(λc)
0 100 200 300
2 2.1 2.2 2.3 2.4 2.5x 10
5
Iterations
Loss
Letter Recognition− Test
RRB(λr)
RRB(λ c)
0 20 40 60
2.6 2.65 2.7 2.75
2.8x 10
6
Iterations
Loss
MAGIC − Test
RRB(λr)
RRB(λc)
0 10 20 30 40 50
1.4 1.6 1.8 2 2.2x 10
6
Iterations
Loss
Banana− Test
RRB(λr)
RRB(λ c)
0 10 20 30 40 50
1.75 1.8 1.85 1.9 1.95
2x 10
5
Iterations
Loss
Yeast − Test
RRB(λr) RRB(λc)
Figure 2: Verifying the forward direction of the equivalence relationship for AdaBoost and Rank-Boost
regime of convergence is reached. We present empirical evidence to support the forward direction of the theoretical equivalence relationship for p=1, on both the training and test splits, for all data sets described above.
In Figure 2,{λr}rand{λc}cdenote sequences of coefficients produced by RankBoost and
Ada-Boost respectively; the subscripts r and c stand for ranking and classification. The figure illustrates both the convergence of AdaBoost and the convergence of RankBoost, with respect to RankBoost’s objective RRB. The x-axis denotes the number of iterations. The illustration supports the conver-gence of AdaBoost to a minimizer of RankBoost’s objective. Because of the way that RankBoost is designed,
R
RB(λr)converges more rapidly (in terms of the number of iterations), thanR
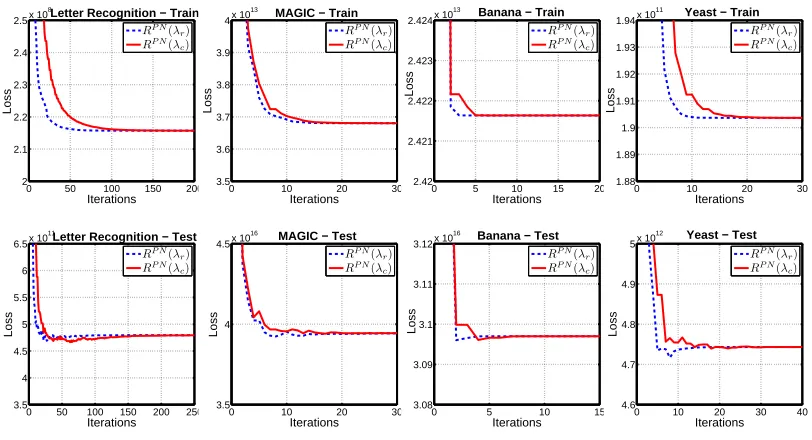
RB(λc).4.3 Equivalence of P-Classification and P-Norm Push
In the same experimental setting, we now validate the equivalence of P-Classification and P-Norm Push. In Figure 3,{λr}rand{λc}cdenote sequences of coefficients produced by the P-Norm Push
The next experiment verifies the backwards direction of the equivalence relationship. We demonstrate that a sequence of correctedλ’s minimizing P-Norm Push’s objective also minimizes
P-Classification’s objective. At each iteration of the P-Norm Push, we compute b as defined in (12) and updateλr accordingly. The sequences of
R
PC values for{λc}c and the corrected {λr}r are shown in Figure 4.
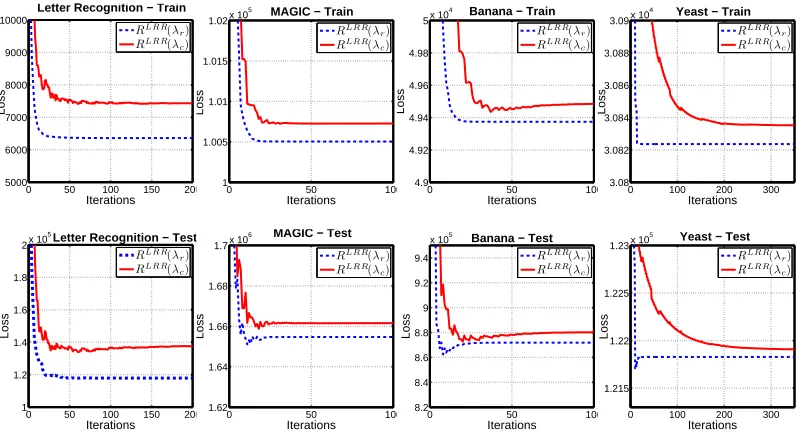
4.4 Equivalence Does Not Seem To Hold For Logistic Regression and Logistic Regression Ranking
We implemented a coordinate descent algorithm for minimizing LRR’s objective function (6), where pseudocode is given in Figure 5. Note that the pseudocode for minimizing logistic regression’s objective function would be similar, with the only change being that the definition of the matrix M is the same as in Figure 1.
Figure 6 provides evidence that no such equivalence relationship holds for logistic regression and Logistic Regression Ranking. For this experiment,{λr}rand{λc}cdenote sequences of
coef-ficients produced by LRR and logistic regression respectively. Convergence is illustrated for both algorithms with respect to LRR’s objective. Even after many more iterations than the earlier ex-periments, and after LRR’s objective function values have plateaued for the two algorithms, these values are not close together.
0 50 100 150 200
2 2.1 2.2 2.3 2.4 2.5x 10
8
Iterations
Loss
Letter Recognition − Train
RP N(λr)
RP N(λc)
0 10 20 30
3.5 3.6 3.7 3.8 3.9
4x 10
13
Iterations
Loss
MAGIC − Train
RP N(λr)
RP N(λc)
0 5 10 15 20
2.42 2.421 2.422 2.423 2.424x 10
13
Iterations
Loss
Banana − Train
RP N(λr)
RP N(λc)
0 10 20 30
1.88 1.89 1.9 1.91 1.92 1.93 1.94x 10
11
Iterations
Loss
Yeast − Train
RP N(λr)
RP N(λc)
0 50 100 150 200 250
3.5 4 4.5 5 5.5 6 6.5x 10
11
Iterations
Loss
Letter Recognition − Test
RP N(λr) RP N(λc)
0 10 20 30
3.5 4 4.5x 10
16
Iterations
Loss
MAGIC − Test
RP N(λr) RP N(λc)
0 5 10 15
3.08 3.09 3.1 3.11 3.12x 10
16
Iterations
Loss
Banana − Test
RP N(λr) RP N(λc)
0 10 20 30 40
4.6 4.7 4.8 4.9
5x 10
12
Iterations
Loss
Yeast − Test
RP N(λr) RP N(λc)
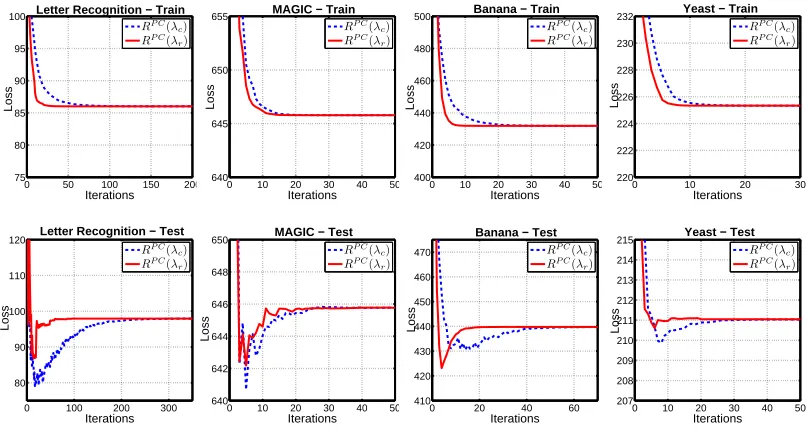
5. Benefits of the Equivalence Relationship
Four major benefits of the equivalence relationship are (i) theoretical motivation, using an algo-rithm that optimizes classification and ranking objectives simultaneously (ii) gaining the ability to estimate conditional probabilities from a ranking algorithm, (iii) much faster runtimes for rank-ing tasks, by passrank-ing to a classification algorithm and usrank-ing the equivalence relationship, and (iv) building a relationship between the P-Norm Push and the “precision” performance metric through P-Classification’s objective (discussed in Section 6). We have already discussed theoretical motiva-tion, and we will now discuss the other two benefits.
5.1 Estimating Probabilities
The main result in this section is that the scoring function fλ(x)can be used to obtain estimates of the conditional probability P(y=1|x). This result relies on properties of the loss functions, including smoothness, and the equivalence relationship of Theorem 2. Note that the conditional probability estimates for AdaBoost are known not to be very accurate asymptotically in many cases (e.g., see Mease et al., 2007), even though AdaBoost generally provides models with high classification and ranking accuracy (e.g., see Caruana and Niculescu-Mizil, 2006). In other words, even in cases where the probability estimates are not accurate, the relative ordering of probability estimates (the ranking) can be accurate.
0 50 100 150 200
75 80 85 90 95 100 Iterations Loss
Letter Recognition − Train
RP C(λc)
RP C(λr)
0 10 20 30 40 50
640 645 650 655 Iterations Loss
MAGIC − Train
RP C(λc)
RP C(λr)
0 10 20 30 40 50
400 420 440 460 480 500 Iterations Loss
Banana − Train
RP C(λc)
RP C(λr)
0 10 20 30
220 222 224 226 228 230 232 Iterations Loss
Yeast − Train
RP C(λc)
RP C(λr)
0 100 200 300
80 90 100 110 120 Iterations Loss
Letter Recognition − Test
RP C(λc) RP C(λr)
0 10 20 30 40 50
640 642 644 646 648 650 Iterations Loss
MAGIC − Test
RP C(λc) RP C(λr)
0 20 40 60
410 420 430 440 450 460 470 Iterations Loss
Banana − Test
RP C(λc) RP C(λr)
0 10 20 30 40 50
207 208 209 210 211 212 213 214 215 Iterations Loss
Yeast − Test
RP C(λc) RP C(λr)
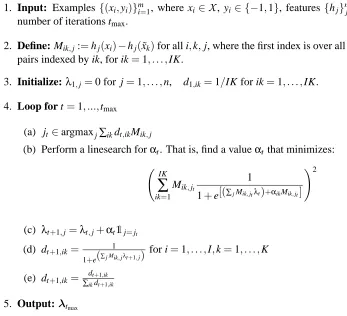
1. Input: Examples {(xi,yi)}mi=1, where xi∈
X
, yi∈ {−1,1}, features{hj}nj=1, hj :X
→R
, number of iterations tmax.2. Define: Mik,j:=hj(xi)−hj(x˜k)for all i,k,j, where the first index is over all positive-negative pairs indexed by ik, for ik=1, . . . ,IK.
3. Initialize:λ1,j=0 for j=1, . . . ,n, d1,ik=1/IK for ik=1, . . . ,IK. 4. Loop for t=1, ...,tmax
(a) jt∈argmaxj∑ikdt,ikMik,j
(b) Perform a linesearch forαt. That is, find a valueαt that minimizes:
IK
∑
ik=1Mik,jt
1
1+e[(∑jMik,jtλt)+αikMik,jt]
!2
(c) λt+1,j=λt,j+αt1j=jt (d) dt+1,ik= 1
1+e(∑j Mik,jλt+1,j) for i=1, . . . ,I,k=1, . . . ,K (e) dt+1,ik=∑dt+1,ik
ikdt+1,ik
5. Output:λt max
Figure 5: Pseudocode for the Logistic Regression Ranking algorithm.
Theorem 4 Probability estimates for P-Classification and for the P-Norm Push algorithm (withλ
corrected trivially as in Theorem 2) can be obtained from the scoring function fλ(x)as follows:
ˆ
P(y=1|x) = 1
1+e−fλ(x)(1+p).
Proof This proof (in some sense) generalizes results from the analysis of AdaBoost and logistic regression (see Friedman et al., 2000; Schapire and Freund, 2011). A general classification objective function can be regarded as an estimate for the expected loss:
R
true(f):=Ex,y∼D[l(y,f(x))],where expectation is over randomly selected examples from the true distribution
D
. This quantity can be split into two terms, as follows:Ex,y∼D[l(y,f(x))] =Ex
Ey
|x[l(y,f(x)|x)]
=Ex[P(y=1|x)l(1,f(x)) + (1−P(y=1|x))l(−1,f(x))].
At each x, differentiating the inside with respect to f(x)and setting the derivative to 0 at the point
f(x) = f∗(x), we obtain:
0 50 100 150 200 5000 6000 7000 8000 9000 10000 Iterations Loss
Letter Recognition − Train
RLR R(λr)
RLR R(λc)
0 50 100
1 1.005 1.01 1.015
1.02x 10
5
Iterations
Loss
MAGIC − Train
RLR R(λr)
RLR R(λc)
0 50 100
4.9 4.92 4.94 4.96 4.98
5x 10
4
Iterations
Loss
Banana − Train
RLR R(λr)
RLR R(λc)
0 100 200 300
3.08 3.082 3.084 3.086 3.088
3.09x 10
4
Iterations
Loss
Yeast − Train
RLR R(λr)
RLR R(λc)
0 50 100 150 200
1 1.2 1.4 1.6 1.8
2x 10
5
Iterations
Loss
Letter Recognition − Test
RLR R(λr) RLR R(λc)
0 50 100
1.62 1.64 1.66 1.68
1.7x 10
6
Iterations
Loss
MAGIC − Test
RLR R(λr)
RLR R(λc)
0 50 100
8.2 8.4 8.6 8.8 9 9.2 9.4
x 105
Iterations
Loss
Banana − Test
RLR R(λr)
RLR R(λc)
0 100 200 300
1.215 1.22 1.225
1.23x 10
5
Iterations
Loss
Yeast − Test
RLR R(λr)
RLR R(λc)
Figure 6: Doubt on equivalence relationship for logistic regression and LRR
and solving this equation for P(y=1|x),
P(y=1|x) = 1 l′(1,f∗(x)) −l′(−1,f∗(x))+1
. (17)
P-Classification’s objective is an empirical sum over the training instances rather than an expectation over the true distribution:
R
PC(λ) = I∑
i=1e−fλ(xi)
+ K
∑
k=11
pe
fλ(xk˜)p
.
Thus, estimates of the conditional probabilities ˆP(y=1|x)can be obtained using (17) where:
l(1,f(x)) =e−f(x)and l(−1,f(x)) = 1
pe
f(x)p,
and instead of f∗(x), which cannot be calculated, we use fλ(x). To do this, we first find derivatives:
l(1,f(x)) =e−f(x) ⇒ l′(1,f(x)) =−e−f(x)
l(−1,f(x)) = 1
pe
f(x)p ⇒ l′(−1,f(x)) =ef(x)p.
Substituting into (17), we obtain estimated conditional probabilities as follows:
ˆ
P(y=1|x) = 1 1+ l′(1,fλ(x))
−l′(−1,fλ(x))
= 1
1+−e−fλ(x)
−efλ(x)p
= 1
1+e−fλ(x)(1+p).
This expression was obtained for P-Classification, and extends to the P-Norm Push (withλ
cor-rected) by the equivalence relationship of Theorem 2.
Letter Recognition
Algorithm Objective # of Iterations(for .05%) Time (sec.)
1
K
T
ra
in
AdaBoost
R
RB 123.4±21.6 0.1±0.0RankBoost
R
RB 50.2±10.4 1.1±0.3P-Classification
R
PN 132.5±23.9 0.6±0.1PNormPush
R
PN 43.3±7.0 3.3±0.6Logistic Regression
R
LRR N/A N/ALRR
R
LRR 50.0±11.9 8.0±3.03
K
T
ra
in
AdaBoost
R
RB 112.3±28.5 0.1±0.0RankBoost
R
RB 43.7±9.3 10.7±2.7P-Classification
R
PN 136.5±36.4 1.3±0.3PNormPush
R
PN 44.0±8.8 29.3±6.5Logistic Regression
R
LRR N/A N/ALRR
R
LRR 43.8±11.4 65.8±18.25
K
T
ra
in
AdaBoost
R
RB 108.9±18.8 0.1±0.0RankBoost
R
RB 43.2±7.5 29.2±7.8P-Classification
R
PN 138.3±29.4 1.7±0.3PNormPush
R
PN 41.9±6.2 72.0±12.5Logistic Regression
R
LRR N/A N/ALRR
R
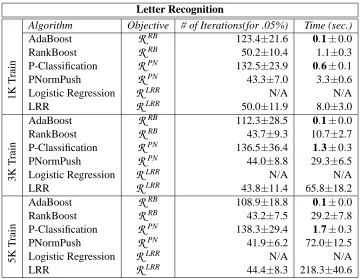
LRR 44.4±8.3 218.3±40.6Table 2: Comparison of runtime performances over varying training set sizes. p =4 for P-Classification and P-Norm Push.
5.2 Runtime Performances
Faster runtime is a major practical benefit of the equivalence relationship proved in Section 3. As we have shown in Sections 4.2 and 4.3, when comparing how ranking algorithms and classification algorithms approach the minimizers of the misranking error, the ranking algorithms tend to converge more rapidly in terms of the number of iterations. Convergence with fewer iterations, however, does not translate into faster convergence. Each iteration of either algorithm requires a search for the optimal weak hypothesis j. For the P-Norm Push, each comparison requires quadratic space (involving a vector multiplication of size I×K). In contrast, P-Classification’s comparisons are
linear in the number of examples (involving a vector multiplication of size I+K). For RankBoost,
note that a more efficient implementation is possible for bipartite ranking (see Section 3.2 of Freund et al., 2003), though a more efficient implementation has not previously been explored in general for the P-Norm Push; in fact, the equivalence relationship allows us to use P-Classification instead, making it somewhat redundant to derive one.
p=1. The results are presented for the Letter Recognition data set, which is the largest data set in our experimental corpus. To assess the scalability of the algorithms, we generated 10 training sets each of sizes 1000 examples, 3000 examples, and 5000 examples (30 total training sets). For each algorithm, we report the mean and variance (over 10 training sets) of the number of iterations and the time elapsed (in seconds) for the ranking loss to be within 0.05% of the asymptotic minimum ranking loss. The asymptotic value was obtained using 200 iterations of the corresponding ranking algorithm (for AdaBoost and RankBoost, we used RankBoost; for P-Classification and the P-Norm Push, we used the P-Norm Push; and for logistic regression and LRR, we used LRR). Note that logistic regression may never converge to within 0.05% of the ranking loss obtained by LRR (there is no established equivalence relationship), so “N/A” has been placed in the table when this occurs.
Comparing the runtime performances of classification and ranking algorithms in Table 2, Ada-Boost and P-Classification yield dramatic improvement over their ranking counterparts. Despite the fact that they require more than double the number of iterations to obtain the same quality of solution, it only takes them a fraction of the time. Further, AdaBoost and P-Classification appear to scale better with the sample size. Going from 1K to 5K, AdaBoost’s run time roughly doubles, on average from 0.08 to 0.14 seconds, whereas RankBoost takes over 27 times longer (29.19/1.08
≈27). Similarly, P-Classification’s run time on the 5K data set is slightly more than twice the run time on the 1K data set, as opposed to approximately 22 times longer (72/3.32≈21.7) for P-Norm Push on the 5K data set. Thus, the equivalence relationship between classification and ranking al-gorithms enables us to pass the efficiency of classification alal-gorithms to their ranking counterparts, which leads to significant speed improvement for ranking tasks.
6. Experiments on Prediction Performance
When evaluating the prediction performance of the P-Classification algorithm, we chose
preci-sion as our performance metric, motivated by a specific relationship between precipreci-sion and
P-Classification’s objective that we derive in this section. In Information Retrieval (IR) contexts, precision is defined as the number of relevant instances retrieved as a result of a query, divided by the total number of instances retrieved. Similarly, in a classification task the precision is defined as
Precision := TP TP+FP
where TP (true positives) are the number of instances correctly labeled as belonging to the positive class and FP (false positives) are the number of instances incorrectly labeled as belonging to the positive class. In a classification task, 100% precision means that every instance labeled as belong-ing to the positive class does indeed belong to the positive class, whereas 0% precision means that all positive instances are misclassified.
In order to derive the relationship between precision and P-Classification’s objective, consider P-Classification’s objective:
R
PC(λ) =I
∑
i=1e−fλ(xi)+1 p
K
∑
k=1efλ(xk˜)p.
There is a potential for the second term to be much larger than the first term when p>1, so we consider:
R
PC(λ)≥1p
∑
k efλ(xk˜)p (19)
≥1
p
∑
k e γp1[fλ(xk˜)≥γ]=
1
pe γp
∑
k
1[fλ(xk˜)≥γ]. (20)
Transitioning from (19) to (20) uses the fact that efλ(xk˜)>eγpwhen fλ(x˜
k)≥γ, ∀γ. Let ¯Ifλ>γ,K¯fλ>γ
denote the number of positive and negative instances that score higher than the cutoff thresholdγ, respectively. Then,
∑
k1[fλ(xk˜)≥γ] = K¯fλ≥γ
= I¯f
λ≥γ+K¯fλ≥γ
1− I¯fλ≥γ
¯
Ifλ≥γ+K¯fλ≥γ
= I¯fλ≥γ+K¯fλ≥γ
(1−Precision@(fλ=γ)). (21)
Note that ¯Ifλ≥γ+K¯fλ≥γ is simply the number of all instances with scores greater thanγ. Plugging
(21) into (20) yields
R
PC(λ)≥ 1pe γp I¯
fλ≥γ+K¯fλ≥γ
(1−Precision@(fλ=γ))
which indicates that minimizing P-Classification’s objective may yield solutions that have high precision. Through the equivalence of the P-Norm Push and P-Classification, a similar relationship with precision also exists for the P-Norm Push.
6.1 Effect of p:
In this section, we explore the prediction performance of the P-Classification algorithm with respect to p, for various levels ofγ, whereγis the cutoff threshold for calculating precision. We have three hypotheses that we want to investigate, regarding the relationship between p and precision.
Hypothesis 1: The presence of exponent p in the second term in (18) enables P-Classification to achieve improved prediction performance.
The first term of (18) can be much smaller than the second term, due mainly to the presence of p in the exponent. This means that the bound in (19) becomes tighter with the presence of p. This may indicate that the exponent p can influence the algorithm’s performance with respect to precision. The empirical analysis that we present later in this section investigates the influence and impact of the exponent p on precision accuracy.
Hypothesis 2: Increasing p in P-Classification’s objective yields improved prediction perfor-mance.
As p increases, the bound in (19) becomes tighter and the largest terms in
R
PCcorrespond to the highest scoring negative examples. MinimizingR
PCthus “pushes” these negative examples down the ranked list, potentially leading to higher values of precision.Hypothesis 3: P-Classification can achieve better performance than AdaBoost.
We are able to make the hypotheses above since we have chosen precision to be the performance metric. Another metric for evaluating the performance of a ranking function is recall, which is defined as the number of true positives divided by the total number of positive examples. A perfect recall of 100% indicates that all positive examples are above the cutoff threshold. Therefore, if our goal was to optimize recall instead of precision, we would want to put the exponent p on the first term of
R
PCrather than the second term, since it will create the effect of pushing the positive examples from bottom to top of the list. As the goal is to concentrate on the correct rankings at the top of the list, we particularly aim at achieving higher precision, rather than higher recall. In many IR systems, including web search, what matters most is how many relevant (positive) results there are on the first page or the first few pages—this is reflected directly by precision. Recall does not accurately represent the performance at the top of the list, since it concerns the performance acrossall of the positives; this would require us to go much farther down the list than is reasonable to
consider for these applications, in order to span all of the positive examples.
We will now describe the experimental setup. We chose training sets as follows: for MAGIC, 1000 randomly chosen examples, for Yeast, 500 randomly chosen examples, for Banana, 1000 randomly chosen examples and for Letter Recognition, 1200 examples with 200 positives and 1000 positives to achieve an imbalance ratio of 1:5. Increasing the number of positive examples in the training set of Letter Recognition enabled us to keep the “x-ege” attribute, but discard only the “x2bar” attribute, due to RankBoost’s requirement discussed in Section 4.1. For all data sets except Yeast, we randomly selected 4000 examples as the test set. For Yeast, we selected the remaining 983 examples as the test set. The experiments were conducted for three cutoff thresholdsγ, to consider the top 50%, 25% and 10% of the list. The algorithms were run until they had converged (hundreds of iterations).
Table 3 presents the precision results on the test sets from all four data sets. In order to inves-tigate the hypotheses above, we redefine Cost-Sensitive AdaBoost as an algorithm that minimizes the following objective:
R
csAB(λ) =I
∑
i=1e−yifλ(xi)
+C1 p
K
∑
k=1e−ykfλ(xk˜)
. (22)
In order to test the first hypothesis, we fix C=1. When C=1, (22) resembles P-Classification’s objective in (7), the only difference is that p is missing in the exponent. When C=1 and p=1, (22) reduces to AdaBoost’s objective (3). In that case, P-Classification and AdaBoost give the same performance trivially. As shown in Table 3, for fixed values of p, where p>1, our experiments indicate that P-Classification yields higher precision than Cost-Sensitive AdaBoost, which agrees with our first hypothesis. To see this, compare element-wise the “AdaB.CS” rows (C=1,p>1) in the table with the corresponding “P-Classification” rows; this is 36 comparisons that all show P-Classification giving higher precision than AdaBoost. This was a controlled experiment in which the treatment was the presence of the exponent p. Our results indicate that the presence of the exponent p can be highly effective in achieving higher precision values.
MAGIC Letter Recognition
50% 25% 10% 50% 25% 10%
AdaB.CS
p=1,C=1 63.94±3.26 69.40±2.75 94.75±1.03 66.88±8.13 66.88±8.13 72.78±7.20 p=2,C=1 55.92±2.68 69.40±2.75 94.75±1.03 61.76±8.14 61.76±8.14 72.60±6.99 p=3,C=1 54.25±1.41 69.40±2.75 94.75±1.03 58.91±7.61 58.91±7.61 72.82±7.24 p=4,C=1 54.25±1.41 69.40±2.75 94.75±1.03 55.61±7.23 56.02±6.82 72.78±7.20 p=4,C=#neg#pos 55.20±2.35 69.40±2.75 94.75±1.03 68.42±7.09 68.42±7.09 72.88±7.33
P-Class.
p=1,C=1 63.94±3.26 69.40±2.75 94.75±1.03 66.88±8.13 66.88±8.13 72.78±7.20 p=2,C=1 64.45±3.13 70.22±2.77 94.97±0.97 68.98±8.02 68.98±8.02 77.20±7.62 p=3,C=1 65.21±2.99 70.46±2.60 95.15±0.91 70.09±7.65 70.09±7.65 78.45±8.63 p=4,C=1 65.13±2.96 70.60±2.62 95.15±0.94 70.38±7.43 70.38±7.43 78.93±8.41 p=4,C=#neg#pos 82.27±7.68 82.49±7.08 95.15±0.94 90.96±3.39 90.96±3.39 90.96±3.39 LR 65.31±2.90 69.51±2.65 94.78±1.08 69.49±7.63 69.49±7.63 77.10±8.22 LRCS C=#neg#pos 84.54±8.64 84.54±8.64 95.00±0.96 90.62±4.18 90.62±4.18 90.62±4.18
Banana Yeast
50% 25% 10% 50% 25% 10%
AdaB.CS
p=1,C=1 75.56±0.39 88.77±1.75 90.35±2.49 52.77±4.59 52.77±4.59 56.27±3.87 p=2,C=1 75.56±0.39 88.77±1.75 90.35±2.49 44.24±2.54 49.11±3.91 56.06±3.85 p=3,C=1 74.91±0.94 88.77±1.75 90.35±2.49 42.66±1.56 49.11±3.91 56.06±3.85 p=4,C=1 74.15±1.09 88.77±1.75 90.35±2.49 42.66±1.56 49.11±3.91 56.06±3.85 p=4,C=#neg#pos 75.56±0.39 88.77±1.75 90.35±2.49 42.66±1.56 49.11±3.91 56.06±3.85
P-Class.
p=1,C=1 75.56±0.39 88.77±1.75 90.35±2.49 52.77±4.59 52.77±4.59 56.27±3.87 p=2,C=1 75.57±0.39 89.16±0.60 96.70±2.79 53.20±4.23 53.20±4.23 56.37±4.66 p=3,C=1 75.57±0.39 89.16±0.60 97.80±0.86 53.25±4.22 53.25±4.22 56.47±5.38 p=4,C=1 75.57±0.39 89.16±0.60 98.55±1.02 53.26±4.22 53.26±4.22 56.98±4.74 p=4,C=#neg#pos 88.75±9.45 92.86±2.86 98.55±1.02 56.37±6.26 56.37±6.26 58.12±6.20 LR 75.57±0.39 89.16±0.60 90.35±2.49 53.23±4.24 53.23±4.24 56.57±5.15 LRCS C=#pos#neg 88.75±9.45 92.86±2.86 90.35±2.49 55.88±6.09 55.88±6.09 57.59±6.57
Table 3: Precision values at the top 50%, 25% and 10% of the ranked list.
Evaluating the third hypothesis, Table 3 shows that P-Classification for p>1 yields superior precision than AdaBoost in all comparisons (36 of them in total, from 4 data sets, 3γlevels and 3 values of p>1).
6.2 Effect of Parameter C
Our next set of experiments focus on the behavior that we observe in Cost-Sensitive AdaBoost’s results, which is that increasing p has a detrimental effect on precision, whereas in P-Classification, increasing p leads to higher precision. Given that the only difference between
R
PCandR
csABis the presence of the exponent p inR
PC, the behavior that we observe can be explained by the hypothesis that the exponent p in P-Classification is the dominant factor in determining the misclassification penalty on the negative examples, overwhelming the effect of the 1p factor.and thus defined a Cost-Sensitive P-Classification algorithm that minimizes the following loss:
R
csPC(λ) =I
∑
i=1e−fλ(xi)
+C1 p
K
∑
k=1efλ(xk˜)p
.
In the experiments, we heuristically set C=#pos#neg in order to reduce, and possibly eliminate, the detrimental effect of the 1p term. Our data sets share characteristics similar to many other real world data sets in that the number of positive examples is less than the number of negative examples; therefore C>1 for all four data sets. The #pos#neg ratios averaged over 10 splits for each data set are 354/646, 200/1000, 400/600 and 155/345 for MAGIC, Letter Recognition, Banana and Yeast, respectively. The last row in Table 3 for Cost-Sensitive AdaBoost, and also the last row for P-Classification, contains performance results with C= #neg#pos. As seen, for a fixed p (p=4 in this case), using this new value for C dramatically improves precision for P-Classification in most cases (10 out of 12 comparisons) and for AdaBoost in some cases (5 out of 12 comparisons). To see this, compare the p=4,C=1 row with the p=4,C= #pos#neg row for each algorithm. Using C>1 is equivalent to giving higher misclassification penalty to the negative examples, which can result in a stronger downward push on these examples, raising precision.
6.3 Comparison of P-Classification With Logistic Regression
Table 3 also presents results for logistic regression, both using its original formulation (5) as well as its cost-sensitive variant; the objective for cost-sensitive logistic regression is formulated by mul-tiplying the second term of logistic regression’s objective in (5) with the coefficient C. In compar-ing P-Classification (p=4) with logistic regression, P-Classification performed worse than logistic regression in only one comparison out of 12 (3γlevels and 4 data sets). Considering their cost-sensitive variants with C= #neg#pos, P-Classification and logistic regression generally outperformed their original (non-cost-sensitive) formulations (10 out of 12 comparisons for P-Classification vs. Cost-Sensitive P-Classification with p=4, and 11 out of 12 comparisons for logistic regression vs cost-sensitive logistic regression). Furthermore, Cost-Sensitive P-Classification performed worse than cost-sensitive logistic regression in only 2 out of 12 comparisons.
7. A Hybrid Approach for Logistic Regression
As we discussed in Section 4.4, logistic regression and LRR do not seem to exhibit the equivalence property that we have established for boosting-style algorithms. Consequently, neither logistic re-gression or LRR may have the benefit of low classification loss and ranking loss simultaneously. This limitation can be mitigated to some degree, through combining the benefits of logistic re-gression and LRR into a single hybrid algorithm that aims to solve both classification and ranking problems simultaneously. We define the hybrid loss function as:
R
LR+LRR=R
LR+βR
LRRLog(β)
1379.6
Logistic Regression AdaBoost
LRR
Hybrid
Log(β)
Logistic Regression
AdaBoost LRR
Hybrid
(a) (b)
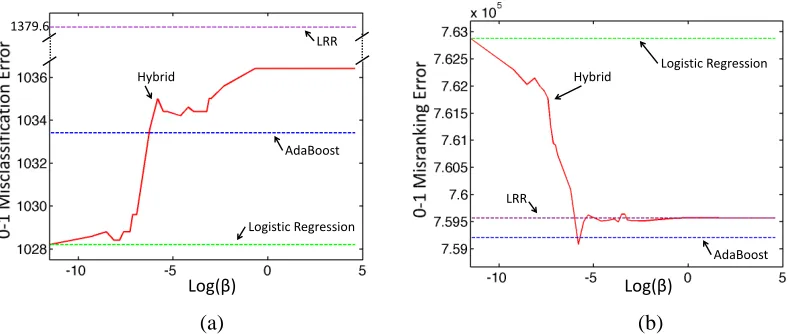
Figure 7: Effect ofβon the misclassification error and misranking error rates for MAGIC data set.
the baseline performance of AdaBoost, logistic regression and LRR. For this particular experiment, logistic regression was able to achieve a better misclassification result than AdaBoost (see Figure 7(a)), but at the expense of a very large misranking error (see Figure 7(b)). Asβincreases, Figure 7(b) shows that the misranking error decreases almost to the level of AdaBoost’s, whereas Figure 7(a) shows that the classification error increases to be higher than AdaBoost’s. The value of β should be chosen based on the desired performance criteria for the specific application, determining the balance between desired classification vs ranking accuracy.
8. Conclusion