Accuracy, Inter- and Intra-Observer Reliability
of a CT Alignment Measurement Protocol for
Robotic-Arm Assisted Total Knee Arthroplasty
Jingwei Zhang, PhD MBA
1, Scott A Persohn, BA, RT
2, Manoshi
Bhowmik-Stoker, PhD
1, Jason Otto, PhD
1, Meenakshisundaram Paramasivam,
MS
2, Ahmad Wahdan, MD
3, Robert H Choplin, MD
2, Paul R Territo, PhD
2 1Stryker, Mahwah, NJ;
2Indiana University, Indianapolis, IN;
3
School of Medicine, Suez Canal University, Ismailia Egypt
[email protected], [email protected], [email protected],
[email protected], [email protected],
[email protected], [email protected] [email protected]
Abstract
Component position and overall limb alignment following Total Knee Arthroplasty (TKA) have been shown to influence device survivorships and clinical outcomes. However, these parameters are often assessed through 2D radiographs after surgery, which can be prone to inaccuracy. The purpose of this paper is to develop a new method for 3D CT based overall limb alignment and component position measurements. The technique utilizes a new mathematical model to calculate prosthesis alignment from the coordinates of anatomical landmarks used in RATKA. The hypothesis is that the proposed technique demonstrated good accuracy, as well as low intra and inter-observer variability.
Two groups of patients (n=120 per group) underwent RATKA and conventional TKA at 4 imaging locations between October 2016 and August 2018, where they were recruited and consented for this prospective, non-randomized, multicenter study. CTs were collected 6 weeks post-operatively and analyzed using RATKA landmarks and the proposed technique. Measurements of 30 randomly selected cases were compared to the surgeons’ operative plan and component target positions for accuracy analysis. Two surgeons performed the same measurements separately for inter-observer variability analysis. One of the two surgeons repeated the measurements 30 days later to assess intra-observer variability.
Average measurement error of overall limb alignment, femoral and tibial component positions were less than 1 degree. Bland Altman plots analysis showed great reproducibility between observers. Correlation analysis showed low variability within observer, with slopes between 0.8 to 1.0 and R-squared > 0.8.
Sciences Volume 3, 2019, Pages 448–452
The proposed method demonstrated great accuracy to plan and low intra and inter-observer variability. This can be a great tool for RATKA studies where component accuracy is assessed using post-operative CTs.
1
Introduction
Component position and overall limb alignment following Total Knee Arthroplasty (TKA) have been shown to influence device survivorships and clinical outcomes [1,2]. Robotic-arm assisted TKA (RATKA) has demonstrated an accuracy within 1 degree [8] and been shown to correct the limb alignment to neutral 100% of the time in 132 knees with initial deformity less than 7 degree, and 64 % of the time in 129 knees with 7 degrees or greater deformity [3]. However, post-operative clinical results are often visualized and measured through two-dimensional (2D) radiographs. While radiography is widely available and affordable, studies report significant errors in this imaging option [4]. Potential inaccuracy can rise from variations in patient positioning, and certain anatomical configurations such as rotation and flexion contractures, especially during estimation of biplanar prosthetic alignment [5]. Better measurement techniques are needed to confirm the accuracy demonstrated intraoperatively with RATKA.
Recent studies have shown that CT based 3D measurements improved accuracy and reliability over 2D measurements [7]. One of the more well-known CT based measurement protocols is Perth CT protocol [6]. However, the Perth CT protocol utilizes different anatomical landmarks than those used to surgically plan a RATKA, which can generate significant error when used to analyze RATKA cases. Other proposed methods often require specialized software, bone modeling, implant segmentations, or a combination of the three [7], which can be time-consuming and expensive.
The purpose of this paper is to develop a new method for 3D CT based overall limb alignment and component position measurements. The technique utilizes a new mathematical model to calculate prosthesis alignment from the coordinates of anatomical landmarks used in RATKA. The hypothesis is that the proposed technique demonstrated good accuracy, as well as low intra and inter-observer variability.
2
Materials and Methods
This study was approved by a local IRB at each site. Two groups of patients (n=120 per group) underwent RATKA and conventional TKA at 4 sites between October 2016 and August 2018, where they were recruited and consented for this prospective, non-randomized, multicenter study. Surgeons’ operative plan containing limb alignments and component positions are collected intra-operatively for RATKA cases. CT scans were performed prior to and 4-6 weeks post-surgery.Measurements of 30 randomly selected cases using the proposed method were compared to the surgeons’ targeted component positions for accuracy analysis. Two surgeons performed the same measurements separately for inter-observer variability analysis. One of the two surgeons repeated the measurements 30 days later to assess intra-observer variability.
To analyze the CT images, following vertices were generated using anatomical landmarks: Hip Center (HC), Medial Epicondyle Sulcus (MES), Lateral Epicondyle (LE), Femur Center (FC), Tibia Center (TC), Medial Malleolus (MM), and Lateral Malleolus (LM). To provide component
Lateral (CFL), Coronal Femoral Medial (CFM), Coronal Tibia Lateral (CTL), and Coronal Tibia Medial (CTM).
Using the MM and LM vertices, the Ankle Center (AC) can be computed as follows:
𝐴𝐶(𝑖, 𝑥, 𝑦, 𝑧) = +𝐿𝑀(𝑖, 𝑥, 𝑦, 𝑧) − 𝑀𝑀(𝑖, 𝑥, 𝑦, 𝑧)/ ∗ 0.56
Where, i,x,y,z are the subject, x, y and z coordinates for the vertices listed above. To compute the angle (𝜃) between two axis, the following generalized formula was used:
𝜃 = cos9:; 𝑢=⃗ ∙ 𝑣⃗ ‖𝑢=⃗‖‖𝑣⃗‖B
To compute the Femoral Slope (FS), the angle between PCL and the FMA can be estimated using the above equation. Similarly, Femoral Component Rotation (FCR) is the angle between the SEA and FPL, etc. Therefore, femoral and tibial component positions can be calculated.
3
Results
The average measurement errors are 0.79 ± 1.48 degree varus in overall limb alignment (p=0.004); 0.34 ± 1.20 degree varus (p=0.121), 0.47 ± 2.35 degree internal (p=0.36), 0.71 ± 1.77 degree flexion (p=0.18) in femoral component varus / valgus alignment, TEA rotation, and flexion respectively; and 0.35 ± 1.15 degree varus (p=0.17), 0.38 ± 1.88 degree posterior (p=0.41) in tibial component varus/valgus alignment and slope respectively.
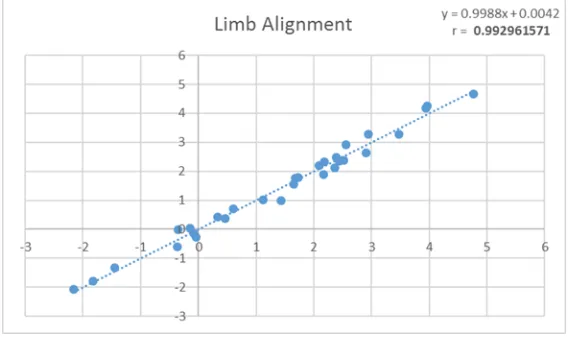
Figure 1 is Bland Altman plot for inter-observer analysis, demonstrating great reproducibility with small to no bias (<0.5 degree) in limb alignment measurements. Figure 2 is linear correlation plots for intra-observer analysis, demonstrating low variability in limb alignment measurements with a slope of 0.999 and a R-Squared of 0.993
4
Discussion and Conclusion
2D radiography is widely used to evaluate limb alignment and component positions in TKA despite potential inaccuracy generated from patient positioning and anatomical configurations. CT-based methods have been proposed in several previous studies to overcome some of limitations of radiograph-based methods. However, they have various drawbacks when used in RATKA studies such as using different anatomical landmarks [6], requiring specialized software, bone modeling, implant segmentations [7].
mathematic model is simple and can be programmed with widely available software and platforms. The calculation time is within seconds. This can be a significant advantage in clinical setting.
There are several limitations in this study. Accuracy and intra-observer analysis were performed by one surgeon in a patient cohort. Inter-observer analysis was performed by two surgeons in a 30-patient cohort. Further studies with more observers and larger 30-patient cohorts are needed to investigate the robustness of the method. Another limitation is the lack of control. In future studies, comparison will be made among different CT techniques to quantify the potential error when used in RATKA cases.
5
Figures
Figure 1: Bland Altman plots for inter-observer analysis, demonstrating great reproducibility in limb alignment measurements between surgeons.
References
[1] Jeffery RS, Morris RW, Denham RA. Coronal alignment after total knee replacement. J Bone Joint Surg Br 1991;73:709.
[2] Huang NF1, Dowsey MM, Ee E, Stoney JD, Babazadeh S, Choong PF., Coronal alignment correlates with outcome after total knee arthroplasty: five-year follow-up of a randomized controlled trial, J Arthroplasty. 2012 Oct;27(9):1737-41. doi: 10.1016/j.arth.2012.03.058. Epub 2012 Aug 3. [3] Marchand RC, Sodhi N, Khlopas A, Sultan AA, Higuera CA, Stearns KL, Mont MA., Coronal Correction for Severe Deformity Using Robotic-Assisted Total Knee Arthroplasty., J Knee Surg. 2018 Jan;31(1):2-5. doi: 10.1055/s-0037-1608840. Epub 2017 Nov 27.
[4] Brouwer RW, Jakma TSC, Brouwer KH, Verhaar JAN. Pitfalls in determining knee alignment: a radiographic cadaver study. J Knee Surg. 2007; 20(3): 210-5.
[5] Solayar GN, Chinappa J, Macdessi SJ. et. al., A Comparison of Plain Radiography with Computer Tomography in Determining Coronal and Sagittal Alignments following Total Knee Arthroplasty, Malays Orthop J. 2017 Jul; 11(2): 45–52
[6] Chauhan SK, Clark GW, Lloyd S, Scott RG, Breidahl W, Sikorski JM., Computer-assisted total knee replacement. A controlled cadaver study using a multi-parameter quantitative CT assessment of alignment (the Perth CT Protocol), J Bone Joint Surg Br. 2004 Aug;86(6):818-23.
[7] Mizu-uchi H, Matsuda S, Miura H, Higaki H, Okazaki K, Iwamoto Y (2009) Three-dimensional analysis of computed tomography based navigation system for total knee arthroplasty. J Arthroplasty 24:1103–1110