Optimization of Integrated Low-Temperature Gas Separation
Processes Using SA Method and Different Refrigerants
N. Tahouni1∗, M. H. Panjeshahi1, R. Smith2
1- Dept. of Chemical Engineering, University of Tehran, Tehran, Iran. 2- Centre for Process Integration, School of Chemical Engineering and
Analytical Science, University of Manchester, Manchester, UK.
Abstract
In low-temperature processes, heat rejected from separation columns is removed by refrigeration systems to heat sinks (reboilers & pre-heaters), process streams, other refrigeration streams, or external utilities. The need for efficient utilization and recovery of energy in sub-ambient gas separation processes is still challenging. Performance and reliability of Simulated Annealing (SA) for simultaneous design and optimization of such systems has been investigated previously. In this work, the effect of different refrigerants satisfying a set of process cooling duties at different temperatures is addressed. Cost reduction can be realized by encompassing both effective screening of heat-integrated separation columns and selecting the best refrigerants. A 29.7% cost savings has been shown through a case study. Afterwards, a comprehensive thermodynamic analysis has been carried out on achieved solutions to verify the accuracy of existing shortcut models and robustness of optimized structure. It has been shown that exergy analysis using two different approaches (i.e. stream wise and unit operation wise) are the same, which indicate the accuracy of the used models. Moreover, we have indicated that both utility costs and exergy losses can be considered as an objective function when optimizing the designs.
Keywords: Low-temperature Process, Different Refrigerants, Optimization, Exergy
Analysis, Simulated Annealing
∗ Corresponding author: [email protected]
1- Introduction
Synthesis and optimization of low-tempera-ture gas separation processes is quite complicated owing to complex interactions between their components namely: the core process which is usually separation columns, heat exchanger networks and the refrigeration system. Many works based on
28 Iranian Journal of Chemical Engineering, Vol. 6, No. 4 Shah and Kokossis [5]. More recently, Wang
and Smith [6] developed a systematic synthesis method to tackle the problem of simultaneous design of heat-integrated refrigeration and separation systems using Genetic Algorithms. The authors have already shown that Simulated Annealing is more reliable and robust for optimization of such systems compared to Genetic Algorithms [7]. Moreover, we have revised many aspects in Wang’s superstructure and recommended optimum parameters of Markov Chain Length and Cooling Parameter to avoid being trapped in local optima due to the highly non-linear nature of the problem. In all applications, SA has shown its strength in dealing with sub-ambient separation processes. However, the effect of different refrigerants through refrigerant cycles has not been considered. In this paper, selection of the best refrigerants has been studied effectively as well as selection of the optimum sequences and separation devices, determination of operating conditions and design of associated refrigeration system and heat exchanger networks.
2- Different refrigerants in Low Tempera-ture Processes
A refrigeration system is a heat pump with
the purpose of providing cooling at temperatures below that which can normally be achieved using cooling water or air cooling. For low temperature gas separation processes, such cooling is required below ambient temperature [8]. Having identified multiple cooling loads at different temperatures, we should select proper refrigerants to satisfy them. Sometimes, one refrigerant cannot span the entire temperature range between the evaporator and the condenser, either because of the required compression ratio is too high or the critical pressure is reached in the condenser. This explains why design alternatives typically need to be explored involving different candidate refrigerants.
3- Case study
In this section, we have examined different refrigerants in an ethylene production plant [9]. The compositions of a saturated liquid entering the cryogenic section of this plant and typical specifications of the feed and product requirements are shown in Table 1. Available utilities used in this case study are assumed to be steam at different pressures and cooling water. The operating temperatures and cost of utilities are listed in Table 2.
Table 1. Problem data for ethylene production plant
i Component Composition (mol %) Product Product Specification
1 Ethane 0.7750 A 98% recovery of ethane
2 Propane 0.1250 B 98% purity of propane
3 iso-Butane 0.0250 C 98% purity of iso-butane
4 n-Butane 0.0250 D 98% purity of n-butane
5 iso-Pentane 0.0150 E 99% purity of iso-pentane
6 n-Pentane 0.0200
7 Hexane 0.0150
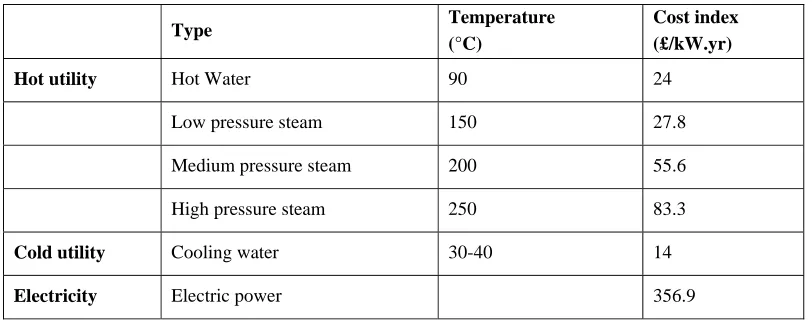
Table 2. Specification of the available hot and cold utilities
Type Temperature
(°C)
Cost index (£/kW.yr)
Hot utility Hot Water 90 24
Low pressure steam 150 27.8
Medium pressure steam 200 55.6
High pressure steam 250 83.3
Cold utility Cooling water 30-40 14
Electricity Electric power 356.9
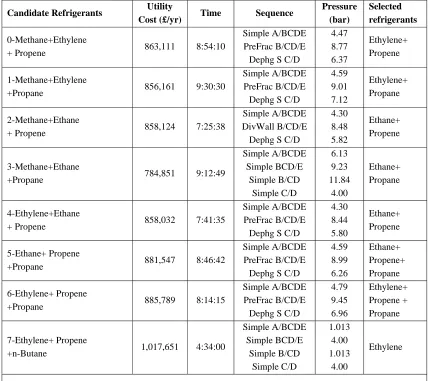
Table 3 shows the best selected design of the problem when different sets of refrigerants are available. Also, the value of objective function i.e. utility cost, elapsed time and design variables (separation device, order of sequence, columns, pressures, and selected refrigerants) have been reported. In this paper, the optimization is carried out using Simulated Annealing method (a stochastic method), by Colom© software [10]. As mentioned, the objective function in these cases is to minimize the utility cost, which includes electric power cost. We emphasize using the utility cost instead of total cost as the objective function. There are no exact models to expect capital cost, therefore considering this cost can lead to invalid optimization results. Moreover, as the overall feed flow rate is fixed, there will be an upper bound to the capital cost and it cannot approach infinity.
In all cases, the number of simple task representations is 6 involving flash drum, dephlegmator, distillation column, pre-flash column, dephlegmator-stripper and column-dephlegmator. Moreover, different complex arrangements have been considered in
superstructure like rectifier, side-stripper, vapor side-draw, prefractionator, petlyuk column and dividing-wall column. The values of Markov chain length and cooling parameter (two important parameters in simulated annealing) are set to 150 and 0.005, respectively, according to the recommendations provided by the authors [7].
The best separation sequence that recovers needed products from a given feed, integrating with the best available refrig-erants, is given (Table 3). Comparison results indicate a utility cost savings of 29.7% in case 3 compared with case 7. It shows that the optimum selection of required refrigerants is one of the most important factors that should be explored simultaneously along with other issues.
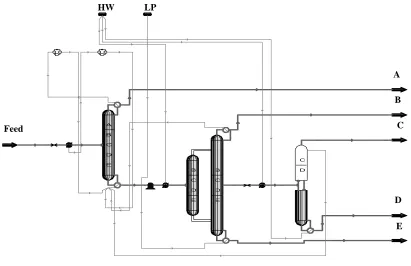
30 Iranian Journal of Chemical Engineering, Vol. 6, No. 4 separation C/D is implemented in a
dephlegmator-stripper. The heat duty of the reboiler of column 1 is supplied from four sources. One part is used as a heat sink to accept heat pumped from the condenser of column 1 by a cascade refrigeration system of ethylene and propylene. The second part is supplied by another cascade refrigeration cycle of ethylene and propylene pumping the heat of the pre-cooler. The remaining heat
duty of the reboiler of column 1 is supplied by exchanging heat directly with the condensers of columns 2 and 3.
It should be noted that, due to rejection of the heat of the column 3 condenser to ambient by Cycle 3, this cycle has not been shown in Figure. 1.
Tables 4 and 5 represent the operating summary of the columns and refrigeration system matches in Figure. 1, respectively.
Table 3. Results of synthesis and optimization of ethylene case study by Simulated Annealing
Candidate Refrigerants Utility
Cost (£/yr) Time Sequence Pressure
(bar)
Selected refrigerants
0-Methane+Ethylene
+ Propene 863,111 8:54:10
Simple A/BCDE PreFrac B/CD/E Dephg S C/D
4.47 8.77 6.37 Ethylene+ Propene 1-Methane+Ethylene
+Propane 856,161 9:30:30
Simple A/BCDE PreFrac B/CD/E Dephg S C/D
4.59 9.01 7.12 Ethylene+ Propane 2-Methane+Ethane
+ Propene 858,124 7:25:38
Simple A/BCDE DivWall B/CD/E
Dephg S C/D
4.30 8.48 5.82 Ethane+ Propene 3-Methane+Ethane
+Propane 784,851 9:12:49
Simple A/BCDE Simple BCD/E Simple B/CD Simple C/D 6.13 9.23 11.84 4.00 Ethane+ Propane 4-Ethylene+Ethane
+ Propene 858,032 7:41:35
Simple A/BCDE PreFrac B/CD/E Dephg S C/D
4.30 8.44 5.80 Ethane+ Propene 5-Ethane+ Propene
+Propane 881,547 8:46:42
Simple A/BCDE PreFrac B/CD/E Dephg S C/D
4.59 8.99 6.26 Ethane+ Propene+ Propane 6-Ethylene+ Propene
+Propane 885,789 8:14:15
Simple A/BCDE PreFrac B/CD/E Dephg S C/D
4.79 9.45 6.96 Ethylene+ Propene + Propane 7-Ethylene+ Propene
+n-Butane 1,017,651 4:34:00
Simple A/BCDE Simple BCD/E Simple B/CD Simple C/D 1.013 4.00 1.013 4.00 Ethylene
A
B
C
D
E
B
C
D
E B
C
D
E
C
D
Figure 1. Selected design for ethylene plant case study #0
Table 4. Operating summary of the columns in Figure 1
Feed quality
Feed pressure
(bar)
Condenser duty (kW)
Reboiler duty (kW)
Condenser temperature
(°C)
Rebiler temperature
(°C)
Column 1 Sat. Liq. 4.47 2233.21 17534.60 -55.43 4.07
Column 2 Sat. Vap. 8.77 6508.04 3726.70 11.07 121.56
Column 3 Sat. Vap. 6.37 5526.54 3379.15 44.80 60.12
Table 5. Refrigeration system matches
Ref. cycle Tevap (°C)
Tcond
(°C)
CmpTout
(°C)
Qevap
(kW)
Qcond
(kW)
Pevap
(bar)
Pcond
(bar) W (kW)
1.Ethylene 1.Propene
-58.43 -47.78
-43.78 8.07
-26.34 42.24
2233.21 2431.53
2431.53 3305.21
7.92 1.00
12.89 7.33
198.32 873.68
2.Ethylene 2.Propene
-51.82 -47.78
-43.78 8.07
-34.43 42.24
1545.14 1616.32
1616.32 2197.09
9.95 1.00
12.89 7.33
71.18 580.77
3.Propene 41.80 50.00 52.92 2.31951 2.40161 17.19 20.61 0.08
Feed
LP HW
B
D C
32 Iranian Journal of Chemical Engineering, Vol. 6, No. 4 It is time to calculate the exergy losses of the
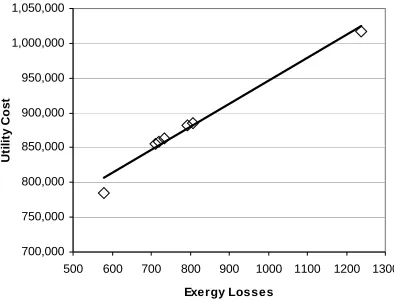
selected design, using unit operation-wise as well as stream-wise approaches. The results are given in Tables 6 and 7. The values for exergy losses achieved by both methods are the same. Therefore, the accuracy of unit operation and calculation models will guarantee the global optimization results. Moreover, Figure 2 shows the relationship between utility cost and total exergy losses for different cases in Table 3. The trend of utility cost vs. exergy losses is linear.
Table 6. Exergy loss calculations using unit operation wise approach for case #0
Unit operation δTo (kW)
Column 1 4349.4772
Column 2 1775.5016
Column 3 190.9852
Valve 1 105.8699
Valve 2 4.8030
Pump 2 0.0000
Exch 1 31.9599
Exch 2 389.3355
Exch 3 84.4928
Cycle 1 453.3511
Cycle 2 232.0142
SUM 7617.7905
Table 7. Exergy loss calculations using stream wise approach for case #0
Stream (EX) stream (kW)
Feed 7622.3872
A 3265.1649
B 769.5468
C 81.6926
D 59.3838
E 134.9646
Qinlet 2945.1850
Qoutlet 0.1859
W 1734.4300
δTo (Total) 7991.2492
700,000 750,000 800,000 850,000 900,000 950,000 1,000,000 1,050,000
500 600 700 800 900 1000 1100 1200 1300
Exergy Losses
U
tili
ty
C
o
st
Figure 2. Utility Cost versus Exergy Loss in different cases
4. Result and Discussion
1. It has shown that cycle 3 is the best candidate, which is 29.7% cheaper than cycle 7.
2. The total utility cost is proportional to the overall exergy loss (δTo) of the process. 3. The optimization method that has been
used is both reliable and robust. Because it is independent of the initial assumptions and hence, converges over a unique design configuration having the same exergy loss and total utility cost (see cases #2 and #4).
4. Having done exergy analysis using two different approaches, we have also shown that the shortcut models used in column calculations are accurate enough for the optimization purpose (see Tables 2 and 3).
5. Acknowledgement
References
[1] Andrecovich, M.J., and Westerberg, A.W., “MILP formulation for heat integrated distillation sequence synthesis”, AIChE J., 31 (9), 1461, (1985).
[2] Shelton, M.R., and Grossman, I.E., “Optimal synthesis of integrated refrigeration systems-I: mixed-integer programming model”, Computers and Chemical Engineering, 10(5), pp. 445-459, (1986).
[3] Shelton, M.R., Grossman, I.E., “Optimal synthesis of integrated refrigeration systems-II: implicit enumeration scheme”, Comput. Chem. Eng, 10(5), 461, (1986).
[4] Lee, G.-C., Zhu, X.X., and Smith, R. “Refrigeration system design by combined pinch and exergy analysis”, AIChE Spring Meeting, Atlanta, (2000).
[5] Shah, P., and Kokossis, A.C. “New synthesis framework for the optimization of complex distillation systems”. AIChE J., 48 (3), 527, (2002).
[6] Wang, J., and Smith, R. “Synthesis and optimization of low-temperature gas separation processes”, Ind. Eng. Chem. Res., 44, 2856, (2005).
[7] Tahouni, N., Smith, R., and Panjeshahi, M. H., “Investigating performance & reliability of stochastic methods for optimization of low temperature gas separation processes”, 10th Conference on Process Integration, Modeling and Optimization for Energy Saving and Pollution Reduction. ISCHIA, Gulf of Naples, Italy, 24-27 June, (2007). [8] Smith, R., Chemical Process Design and
Integration, 1st ed., New York: John Wiley & Sons Ltd., (2005).
[9] Farry, M., “Ethane from associated gas still the most economical, Oil & Gas Journal”, 96, 23, 115-117, (1998).