ISSN (Online): 2348 – 3539
OPTIC DISC AND OPTIC CUP DETECTION USING SUPERPIXEL
CLASSIFICATION BASED ON PCA AND MATHEMATICAL MORPHOLOGY
Sreelakshmi B L
1, Mrs M.Deepa
21PG Scholar, Department of CSE, National College Of Engineering, Tirunelveli.
2Assistant Professor, Department of CSE, National College Of Engineering
Abstract: GLAUCOMA is a chronic eye disease in which the optic nerve is progressively damaged and it leads to vision loss.. It is the second leading cause of blindness. As it cannot be cured, detecting the disease in time is important. Progression of the disease leads to loss of vision, which occurs gradually over a long period of time. As the symptoms only occur when the disease is quite advanced, glaucoma is called the silent thief of sight. Glaucoma cannot be cured, but its progression can be slowed down by treatment. Therefore, detecting glaucoma in time is critical.This paper proposes optic disc and optic cup segmentation using superpixel classification for glaucoma screening. In optic disc segmentation, histograms, and center surround statistics are used to classify each superpixel as disc or non-disc.For optic cup segmentation,in addition to the histograms and center surround statistics,the location information is also included into the feature space to boost the performance. The optic disc segmentation consists of super pixel generation,Feature extraction underwhich contrast enhanced histogram and center surround statistics are implemented.Then extracting the final feature,initialization and deformation are performed finally.In optic cup segmentation,it consists of the same steps present in the optic disc segmentation.For 13 retinal images,the optic disc and optic cup are segmented and shown in the output. In phase 2 the method proposed for the extraction of the optic disc contour is mainly based on mathematical morphology along with principal component analysis (PCA). It makes use of different operations such as generalized distance function (GDF), a variant of the watershed transformation, the stochastic watershed, and geodesic transformations.The input of the segmentation method is obtained through PCA.The input of the segmentation method is obtained through PCA. The purpose of using PCA is to achieve the grey-scale image that better represents the original RGB image.
Keywords: Glaucoma screening, Generalized distance function, geodesic transformation, optic cup segmentation,optic disc segmentation, optic disc, principal component analysis, watershed transformation.
Reference to this paper should be made as follows: Sreelakshmi B L1, Mrs M.Deepa2 (2014) „Optic Disc And Optic Cup Detection Using Superpixel Classification Based On Pca And Mathematical Morphology ‟, International Journal of Inventions in Computer Science and Engineering, Volume 1 Issue 2 2014
1 Introduction
Glaucoma is a chronic eye disease that leads to vision loss and in which the optic nerve is progressively damaged. As it cannot be cured, detecting the disease in time is important. Current tests using intraocular pressure (IOP) are not sensitive enough for population based glaucoma screening. Optic nerve head assessment in retinal fundus images is both more promising and superior.
This paper proposes optic discand optic cup segmentation using superpixel classification for glaucoma screening. In optic disc segmentation, histograms, and center surround statistics are used to classify each superpixel as disc or non-disc. It is the second leading cause of blindness, and is predicted to affect around 80 millionpeople by2020[1]Progression of the disease leads to loss of vision, which occurs gradually over a long period of time. As the symptoms only occur when the disease is quite advanced, glaucoma is called the silent thief of sight. Glaucoma cannot be cured, but its progression can be slowed down by treatment. Therefore, detecting glaucoma in time is critical.However, many glaucoma patients are unaware of the disease until it has reached its advanced stage. In Singapore, more than 90% of patients are unaware that they have this condition. In Australia, about 50% of people with
glaucoma are undiagnosed. Since glaucoma progresses with few signs or symptoms and the vision loss from glaucoma is irreversible,screening of people at high risk for the disease is vital.
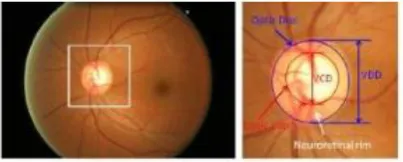
There are three methods to detect glaucoma: 1) assessment of raised intraocular pressure (IOP), 2) assessment of abnormal visualfield, 3) assessment of damaged optic nerve head. automatic optic nerve head assessment would be very beneficial.The following figure represents major structures of the optic disc.
Fig. 1. Major structures of the optic disc.
paper proposes superpixel classification based disc and cup segmentations for glaucoma screening. A similar concept has been used for vessel segmentation.We compute center surround statistics from superpixels and unify them with histograms for disc and cup segmentation. We incorporate prior knowledge of the cup by including location information for cup segmentation. Self- assessment is an important issue that has previously seldom been discussed in disc segmentation. In practice, an automated segmentation method might work well for most images while working poorly for the rest. Therefore, it is important to have self-assessment where users are warned of cases with potentially large errors.
The paper organized as follows.First we introduce superpixel classification based OD segmentation including the generation of superpixels, the extraction of features from superpixels for the classification and then introduces superpixel classification based cup segmentation, where the procedure is similar to that in disc segmentation.Finally the experimental results including the accuracy for disc and cup segmentation as well as glaucoma screening.In Superpixel based optic disc segmentation. Each image is divided into superpixels. The features computed from 18 center surround difference maps and five channel maps are used to classify the superpixels as disc or non-disc. The jth column in the feature map corresponds to the feature for the jth superpixel.
Fig.2. Challenge in disc segmentation. Blue lines: manual disc boundary; red lines: automated disc boundary
by[31]and [28] in the first and second example, respectively; green lines: the PPA boundary
The red line in the first example in Fig. 2 is the boundary detected by the active shape model based method. To overcome the problem, we previously proposed a template based approach with PPA elimination. By using a PPA detection module based on texture, our method reduces the chance of mistaking PPA as part of the disc. However, the approach does not work well when the PPA area is small, or when the texture is not significantly predominant such as the second example in Fig. 2.
II.System Model
The following figure represents the architecture of the segmentation technique.The overview of this architecture includes superpixel classification based OD segmentation
including the generation of superpixels, the extraction of features from superpixels for the classification.Then introduce superpixel classification based cup segmentation, where the procedure of cup segmentation is similar to the disc segmentation.
Fig 3: System Architecture of phase 1
Fig 3 describes the Superpixel based optic disc segmentation. Each image is divided into superpixels. The features computed from 18 center surround difference maps and five channel maps are used to classify the superpixels as disc or non-disc. The jth column in the feature map corresponds to the feature for the jth superpixel.
The segmentation comprises: a superpixel generation step to divide the image into superpixels; a feature extraction step to compute features from each superpixel; a classification step to determine each superpixel as a disc or non-disc superpixel to estimate the boundary; a deformation step using deformable models to fine tune the disc boundary.
The following figure represents the phase 2 architecture.Here the optic disc will be segmented by using PCA(principal component analysis) method.There are mainly 3 steps will be present. They are pre- processing,OD segmentation, Post-processing..The purpose of using PCA is to achieve the grey-scale image that better represents the original RGB image. Steps for PCA are following
Take one input image Convert it into one dimension Generate the co-varient matrix
Produce the Eicon value&Eicon vectors
Accept the value that all are present above the threshold value and remove the others
The method proposed in this paper is mainly based on mathematical morphology although includes a principal component analysis (PCA) in the preprocessing stage. The main steps of the method are the following: First, the PCA is applied on the RGB fundus image in order to obtain a grey image in which the different structures of the retina, such as vessels and OD, are differentiated more clearly to get a more accurate detection of the OD. This stage is very important since it largely determines the final result. Then, the vessels are removed through inpainting technique to make the segmentation task easier. Next, a variant of the watershed transformation, the stochastic watershed transformation, followed to a stratified watershed, are implemented on a region of the original image. Finally, it must be discriminated which of the obtained watershed regions belong to the optic disc and which ones are not. The algorithm is fully automatic, so process is speeded up and user intervention is avoided making it completely transparent.Moreover, the method provides robustness in each processing step. First, it is independent of the database thanks to using PCA.Secondly, it employs the grey-image centroid as initial seed so that not only the pixel intensity is taken into account. Thirdly, it makes use of the stochastic watershed in order to avoid sub-segmentationproblems related to classical watershed transformation.
III.Methodology
In this paper we discuss about the optic disc and cup segmentation. The optic disc segmentation consists of super pixel generation,Feature extraction underwhich contrast enhanced histogram and center surround statistics are implemented.Then extracting the final feature,initialization and deformation are performed finally.In optic cup segmentation,it consists of the same steps present in the optic disc segmentation.
Optic Disc Segmentation
A.Background
Localization and segmentation of disc are very important in many computer aided diagnosis systems, including glaucoma screening. The localization focuses on finding an disc pixel, very often the center. It has been extensively studied for applications in diabetic screening . Our work focuses on the segmentation problem and the disc is located by our earlier method in , which works well in our data set for glaucoma screening as there are few white lesions to confuse disc localization as compared to diabetic screening. The segmentation estimates the disc boundary, which is a challenging task due to blood vessel occlusions, pathological changes around disc,variable imaging conditions, etc.
Some approaches have been proposed for disc segmentation,which can be generally classified as template based methods, deformable model based methods,and pixel classification based methods. In circular Hough transform is
used to model the disc boundary because of its computational efficiency. Both the template and deformable model based methods are based on the edge characteristics. Pixel classification based methods use various features such as intensity, texture, etc. from each pixel and its surroundings to find the disc.Compared the pixel classification based methods with the deformable model based methods and concluded that their performances were similar. Moreover, the number of pixels is high even at moderate resolutions, which makes the optimization on the level of pixels intractable. To overcome the limitations of pixel classification based methods and deformable model based methods, we propose a superpixel classification based method and combine it with the deformable model based methods.
B. Superpixel
Generation Many algorithms have been proposed for superpixel classification. They have been proved to be useful in image segmentations in various images of scene, animal, human, etc. This paper uses the simple linear iterative clustering [8] algorithm (SLIC) to aggregate nearby pixels into superpixels in retinal fundus images.
Algorithm:Simple linear iterative clustering 1.The super pixel image is obtained 2.Get the input image.
3.Get k-initial cluster center
4.Get 3x3 neighbourhood for each pixel
5.Move center to lowest gradient in 3x3 neighborhood 6.Apply Clustering
Compared with other superpixel methods, SLIC is fast, memory efficient and has excellent boundary adherence. SLIC is also simple to use with only one parameter, i.e., the number of desired superpixels.
Algorithm:Linear iterative clustering
C. Feature Extraction
1)Contrast Enhanced Histogram:
Many features such as color, appearance, gist, location and texture can be extracted from superpixels for classification. Since color is one of the main differences between disc and non-disc region, color histogram from superpixels is an intuitive choice. Motivated by the large contrast variation between images and the use of histogram equalization in biological neural networks ,histogram equalization is applied to red r , green g , and blue b channels from RGB color spaces individually to enhance the contrast for easier analysis. Thus, hue and saturation from HSV color space are also included to form five channel maps.
Algorithm:Histogram Equalization
1. Calculate the cumulative frequency distribution 2. Compare with the CuF of an equalised histogram 3. Design the mapping
4. Find an intensity in the transformed image that has as close as possible, the same amount of Cumulative frequency.
6. For each intensity in the original image, find an intensity in the transformed image that has the same amount of Cumulative frequency .
The histogram computation uses 256 bins and 256×5=1280 dimentional feature is computed for the jth superpixel SPj, where HE(.)denotes thefunction of histogram equalization. This also include many algorithms.
2) Center Surround Statistics:
To compute CSS, nine spatial scale dyadic Gaussian pyramids are generated with a ratio from 1:1 (level 0) to 1:256 (level8) as illustrated in Fig. 4. Multiple scales are used as the scale of the blob-like structures largely vary. Algorithm:Gaussian Pyramid
1.The Gaussian pyramid generation is done by starting with an initial image g0
2.Then low pass filtering the image to obtain a "reduced" image g1.
3.The image is "reduced" in the sense that both spatial density and resolution are decreased.
4.This operation can be continued to obtain a set of images {g0,g1,g2, …gn} that form the pyramid image structure. 5.The low pass filtering is done by a procedure equivalent to convolution by a set of local symmetric weighting functions.
6.Along with the Gaussian pyramid generation, there is also an approximate reverse process of the pyramid generation that tries to expand a reduced image to its original scale.
3) Final Feature:
The features from neighboring superpixels are also considered in the classification of the current superpixel.We empirically search for four neighboring superpixels for SPj and denote them as SPj1,SPj2,SPj3,SPj4.and is determined as the first superpixel by moving out of the current superpixel horizontall to the left from its center.Similarly spj1,spj2,spj3 and spj4 are determined by moving right, up, and down respectively.
D. Initialization And Deformation
In this paper, the linear kernel is used instead of nonlinear radial basis function (RBF) kernel as the feature dimensionality is high. We find that the nonlinear mapping using the RBF kernel does not improve the performance. One challenge to find a good classifier is that samples from the non-disc region are often from different clusters with unbalanced numbers. One typical example is PPA.
Algorithm Support Vector Machine 1.Choose a kernel function
2.Choose a value for C
3.Solve the quadratic programming problem (many software packages available)
4.Construct the discriminant function from the support vectors
There are often fewer superpixels from the PPA region compared with other non-disc region, and the trained classifier is often dominated by superpixels from the latter. To overcome the problem, we adopt a bootstrapping strategy Instead of directly using the binary classification results from LIBSVM, the output values from the SVMdecision function are used.
Optic Cup Segmentation
The cup segmentation consists of the same steps present in the optic disc segmentation. Detecting the cup boundary from 2-D fundus images without depth information is a challenging task as depth is the primary indicator for the cup boundary. Compared with disc segmentation, fewer methods have been proposed for cup segmentation from 2-D fundus images. Thresholding is used to determine the cup, relying on intensity difference between cup and neuroretinal rim. A level set based approach is used. It relies on the edges between cup and neuroretinal rim. This method and thresholding based methods are essentially based on pallor information.
The main challenge in cup segmentation is to determine the cup boundary when the pallor is nonobvious or weak. In such scenarios,we lack landmarks, such as intensity changes or edges to estimate the cup boundary reliably. Although vessel bends are potential landmarks, they can occur at many places within the disc region and only one subset of these points defines the cup boundary. We present a superpixel classification based method for cup segmentation that incorporates prior knowledge into the training of superpixel classification instead of relying on vessel bends. Fig 5 shows the procedure for cup segmentation, which is similar to that for disc segmentation with some minor modifications.
Fig 5:Superpixel based optic cup segmentation
Each disc image is divided into superpixels. The features are used to classify the superpixels as cup or non-cup.The decision values from SVM output are smoothed to determine cup boundary
Steps under optic cup segmentation are
A.Feature Extraction
histogram feature is computed similarly to that for disc segmentation, except that the histogram from the red channel is no longer used. This is because there is little information about the cup in the red channel. we further include the distance Dj between the center of superpixel SPj and the center of the disc as location information, as illustrated in Fig. 6.To adapt the variation of disc size,Dj is normalized distance using the height and width of the disc. Mathematically, Dj is computed as
Where (xc,yc) denotes the coordinate of the disc center,(xj,yj) denotes the coordinate of the center of (SPj),h and w denotes the height and width of the disc, respectively.
Fig. 6. Illustration of distance between center of superpixel and center of disc
B. Superpixel Classification For Optic Cup
Estimation
The LIBSVM(library support vector machine) [54] with linear kernel is used again in our experiments.We randomly obtain the same number of superpixels from the cup and non-cup regions in the training step from a set of training images with manual cup boundary. Similarly, the output values from the LIBSVM decision function are used. As illustrated in Fig. 8, the output value for each superpixel is used as the decision values for all pixels in the superpixel. A mean filter is applied on the decision values to compute smoothed decision values. Then the smoothed decision values are used to obtain the binary decisions for all pixels.A deformation in these cases often lead to an overestimated cup.
Phase 2
Pca Technique Methods
A. Theoretical Background
1)Principal Component Analysis(Pca)
The purpose of using PCA is to achieve the grey-scale image that better represents the original RGB image.The method proposed for the extraction of the optic disc contour is mainly based on mathematical morphology along with principal component analysis(PCA).
2)Inpainting Technique
Inpainting techniques are used in diverse applications.From the restoration of damaged photographs to the removal and replacement of selected objects.This is usually try to fill selected parts of an image by propagating.
3)Mathematical Morphology
Mathematical morphology is a non-linear image processing methodology.It is based on minimum and maximum operators whose aim is to extract the relevant structures of an image.Here 2 methods are present Erosion and Dilation.Convert thick image to thin,that is known as Erosion and then convert the thin image to thick that is known as Dilation.Dilation and Erosion is mainly consist ofopening and closing processes.Opening process takes first Dilation and then Erosion process.And closing process takes first Erosion and then Dilation process.
4)Grey-Image Centroid
The centroid of a grey scale image can be calculated based on the generalized distance function(GDF).The grey-scale centroid of an image f can be obtained as the maximum of the GDF to the image border set B as follows.
5)Watershed Segmentation
Stochastic Watershed Segmentation. In this stochastic watershed segmentation find the difference between the Dilation and Erasion.One solution is using marker-controlled watershed.In mathematical morphology ,the gradient Q(f)(x) is obtained as the pointwise difference between a unitary dilation and a unitary erosion.i,e;
IV. Performance Evaluation
To evaluate the performance of the segmentation techniques several performance metrics are available.Accuracy is used to analyse the performance.
Accuracy
The accuracy of the measurement system is the degree of closeness of measurements of a quantity to that quantity‟s actual(true) value
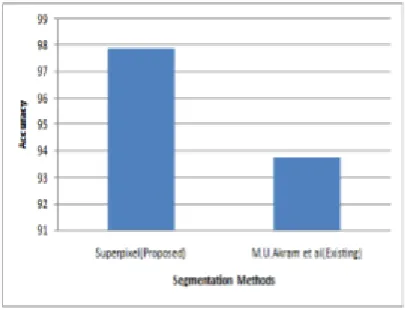
This figure shows the accuracy values of 12 input images by using the methods superpixel and M.U Akram et al.
Fig. 7. Accuracy Measurement
The following fig. 7 and fig. 8 compares the result of proposed technique against M.U Akram et al.[11] OD localization method.The proposed method achieved an accuracy of 97.9% against 93.8% achieved by M.U Akram et al.[10]. By comparing these two methods the superpixel having higher accuracy than M.U Akram et al.
Fig. 8 Performance Analysis
In phase 2 PCA obtains a grey image where the OD could be segmented.The method PCA which combines the most significant information of the three RGB components. The first step of the preprocessing consists of applying PCA to transform the input image to grey scale.This technique combines the most significant information of the three components RGB in a single image so that it is a more appropriate input to the segmentation method. After segmentation, a post-processing is also performed to fit the final region contour by a circumference.The following figure represents about the PCA techniques.
Fig.9 Advantadges of PCA. (a) Original RGB fundus image. (b) Red component. (c) Image obtained by PCA.
PCA is compared with the use of the red component on a specific image.It can be observed that while the red component is completely oversaturated, PCA obtains a grey image where the OD could be segmented.
V.Conclusion
This method presented super pixel classification based methods for disc and cup segmentations for glaucoma screening. It has been demonstrated that CSS is beneficial for both disc and cup segmentation. In disc segmentation,HIST and CSS complement each other.
In cup segmentation,the benefit of CSS is even larger than that in disc segmentation,because the color change from cup to neuro retinal rim is much smaller. We have demonstrated that, by replacing circular Hough transform based initialization with the proposed one for active shape model, we are able to improve the disc segmentation.
One limitation of the proposed cup segmentation is that the trained classifier is slightly dominated by cups with medium sizes, so the proposed method underestimates the very large cups, while overestimating the very small cups when pallor is not obvious.
In phase 2 paper paper, a new approach for the automatic detection of the optic disc has been presented.The purpose of using PCA is to achieve the grey-scale image that better represents the original RGB image. First, it is focused on the use of a new grey image as input obtained through PCA which combines the most significant information of the three RGB components. Secondly, several operations based on mathematical morphology are implemented with the aim of locating the OD. The final goal of the proposed method is to make easier the early detection of diseases related to the fundus. Its main advantage is the full automation of the algorithm since it does not require any intervention by clinicians.
Refereces
[1] J. Cheng, D. Tao, J. Liu, D. W. K. Wong, N. M. Tan, T. Y. Wong,and S. M. Saw, “Peripapillary atrophy detection by sparse biologically inspired feature manifold,” IEEE Trans. Med. Imag., vol. 31, no. 12,pp. 2355–2365, Dec. 2012
[2] G. D. Joshi, J. Sivaswamy, and S. R. Krishnadas, “Optic disk and cupsegmentation from monocular color retinal images for glaucoma assessment,”IEEE Trans. Med. Imag., vol. 30, no. 6, pp. 1192– 1205,Jun. 2011
[3] A.Aquino, M. Gegundez-Arias, and D. Marin, “Detecting the opticdisc boundary in digital fundus images using morphological, edge detection,and feature extraction techniques,” IEEE Trans. Med. Imag.,vol. 29, no. 11, pp. 1860–1869, Nov. 2010.
[4] G. D. Joshi, J. Sivaswamy, K. Karan, and R. Krishnadas, “Optic diskand cup boundary detection using regional information,” in Proc. IEEEInt. Symp. Biomed. Imag., 2010, pp. 948–951.
[5] L. Duan, I. W. Tsang, and D. Xu, “Domain transfer multiple kernellearning,” IEEE Trans. Pattern Anal. Mach. Intell., vol. 34, no. 3, pp.465–479, Mar. 2012.
[6] H. A. Quigley and A. T. Broman, “The number of people with glaucomaworldwide in 2010 and 2020,” Br. J. Ophthalmol., vol. 90, no. 3,pp. 262–267, 2006.
[7] J. Xu, O. Chutatape, E. Sung, C. Zheng, and P. C. T. Kuan, “Opticdisk feature extraction via modified deformable model techniquefor glaucoma analysis,” Pattern Recognit., vol. 40, pp. 2063–2076,2007.
[8] R. Achanta, A. Shaji, K. Smith, A. Lucchi, P. Fua, and S. Susstrunk,“Slic superpixels compared to state-of-the-art superpixel methods,”IEEE Trans. Pattern Anal. Mach. Intell., vol. 34, no. 11, pp.2274–2281, Nov. 2012.