Simulating the Impact of Water Quality
Improvement Measures for Nutrient-Sensitive
River Basins with the Aquatox Model
Alper Elçi
1*, Selma Ayaz
2and Şebnem Aynur
21 Dept. of Environmental Engineering, Dokuz Eylül University, Izmir, Turkey
2 Environment and Cleaner Production Institute, Tübitak Marmara Research Center, Gebze,
Turkey
Abstract
Water quality modelling studies are effective tools for the prediction of the impact of water quality improvement measures. This study aims to predict the future water quality of a nutrient-sensitive river basin assuming the implementation of water quality improvement measures by setting up and executing multiple models. The rationale behind the use of multiple models is the better suitability of each model for its relevant objective. Hydrodynamics of the river are simulated using the WASP model. Following the estimation of diffuse-source nutrient loadings in the river basin with the SWAT model, water quality of the river is simulated with a multi-segment Aquatox model. All models are calibrated to one year of observed data. Models are first executed to obtain the current water quality status and then to predict the water quality for the period of 2016-2040. For the future persion, it is assumed that measures are taken to reduce point-source and diffuse-source pollutant loadings. Model results suggest that load reductions are expected to be effective and that improvement in water quality can be predicted for all water quality indicators. TKN concentrations vary between 0.11-2.13 mg/l with the highest mean concentration occurring during the months of January. TP concentrations are expected to have a higher variability (0.032-0.65 mg/l).
1
Introduction
Water bodies in nutrient-sensitive river basins have the tendency to reach a eutrophic status in the near future or already are eutrophic. Therefore, basin-wide water quality improvement measures are often necessary to prevent eutrophication or to improve current status in water quality. Prior to the
* Prepared publication and corresponding author
Engineering Volume 3, 2018, Pages 651–658
implementation of these measures, it is desirable to predict probable impact by means of water quality modelling studies.
Water quality models vary in terms of complexity, type and simulation capability of transport processes for different contaminants. Objectives of modelling studies at the river basin scale generally focus on the simulation of a water body’s current status with subsequent evaluation of some sort of scenarios that may or may not alter the future water quality for a particular water body. To achieve the objective of a modelling study, firstly the hydrodynamics of the river or the lake is determined solving relevant flow equations, secondly the temporal and spatial distribution of the contaminant of interest is determined using either a physically-based or a mass-balance-based fate and transport model. In practice, it is common that a single, appropriate water quality model is selected and used throughout the entire study to simulate both, hydrodynamics and contaminant transport. In addition to modelling of hydrodynamics and contaminant transport, the application of hydrologic models is needed to estimate diffuse source pollutant loads. The integrated Soil and Water Assessment Tool (SWAT) is such a hydrologic and water quality model which is semi-distributed and process-based (Arnold et al., 2012). Besides its numerous use as a standalone model in numerous studies (CARD, 2018; Elçi & Ayaz, 2017; Elçi, 2017), it has been applied in conjunction with for example the WASP model (Ekdal et al., 2011; Park et al., 2013; Rode et al., 2008), which simulates hydrodynamics and contaminant transport processes. Aquatox (Park et al., 2008) is a water quality model that can simulate the effects of nutrients, organic chemicals and suspended solids on ecosystems. Unlike other contaminant transport models, Aquatox has no capability to solve hydraulic equations for a stream. Therefore, flow information must be obtained externally and provided to the model. This limitation prompts the conjunctive use of a second model.
The objective of this study is to predict the future water quality of the Mudurnu River assuming the implementation of water quality improvement measures. To achieve this objective, a river water quality modelling study is conducted using multiple models (WASP, SWAT, and Aquatox). After setting up and executing the models for the simulation of the current status, pollution source loadings defined in the model are reduced according to measures outlined in the river basin management plan to simulate the future impact of these measures.
2
Material and Methods
2.1
Study Area Description
The Mudurnu river basin is located in the Marmara Region of Turkey and has a drainage area of
2380 km2. The mean annual precipitation in the basin is recorded as 836 mm and the mean minimum
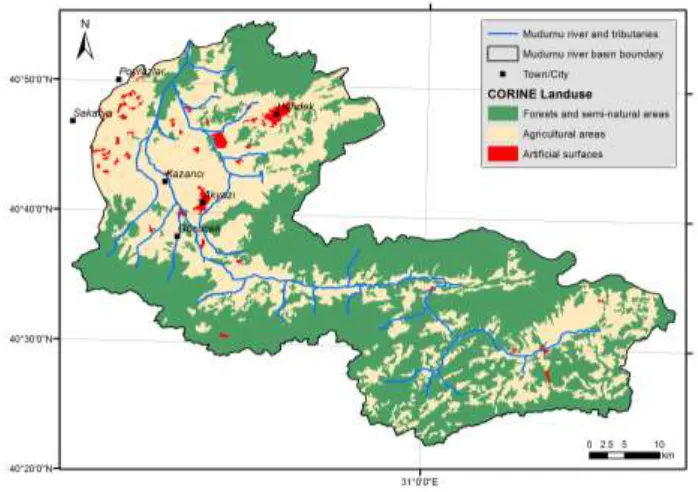
and maximum temperatures on long-term record are 6.4 °C and 17.8 °C, respectively. The river has a length of 130 km and drains water primarily from agricultural lands and forests (Figure 1). Agricultural lands and forests cover 50.1% and 42.8% of the total river basin area, respectively. Soil texture in the basin comprises of luvisols, calcaric fluvisols, calcic cambisols and orthic acrisols. The basin features mostly land slopes greater than 10%, except for the downstream of the basin, where slopes less than 1% are observed. The study area is significant since the Mudurnu river is one of 663 water bodies in the country that are classified as nutrient-sensitive (Tubitak-MRC, 2016).
2.2
Modelling Method
hydrodynamics of the Mudurnu river is simulated using the WASP model (version 7.52) (Ambrose & Wool, 2009). Flow of the Mudurnu river is determined by dividing the river into 16 segments (Figure 2) and solving the kinematic wave equation for each model segment. The simulation time spans over the 12-month data observation period of May 2015 – April 2016. Hydrogeometric model parameters for each segment are determined by field observations and satellite imagery. Manning roughness coefficients are estimated using the Cowan method. Tributary flow rates and the upper boundary condition are assigned based on measured river discharge rates. The flow model is calibrated using monthly discharge rates observed at two stations, one of them being at the basin outlet. Flow rates related to groundwater interaction is selected as the main calibration parameter.
Figure 1. Landuse distribution in the Mudurnu river basin
Water quality of the Mudurnu river is simulated using the Aquatox model (Park et al., 2008). Model segmentation and hydrogeometric parameters are set up identical as the WASP flow model. Furthermore, a multi-segment model structure is selected that permits a unidirectional transport of flow and matter between completely-mixed river segments. WASP flow model results provided the flow input for the water quality model. The simulation time is the same as the flow model and model results were reported in daily time intervals. The following water quality state variables are simulated: organic matter (dissolved and suspended with refractory fractions), dissolved oxygen, ammonium-N, nitrate-N, total nitrogen (TN), total phosphorus (TP), phosphate-P, phytoplankton and periphyton. Upstream boundary conditions and contributions from tributaries are determined from monthly water quality observation data. Daily water temperature and light intensities are estimated based on a default sinusoidal relationship derived from the annual mean and range of air temperature at the site.
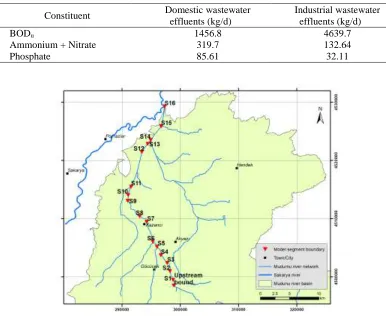
Pollution loadings are key model parameters of the Aquatox model. Loadings are classified into point-source and diffuse-source loadings. The former is comprised mostly of domestic and industrial wastewater discharges (treated and raw) into the main reach of the Mudurnu river (Table 1).
widely used for river basin-scale studies dealing with water management. The ArcGIS compatible version of SWAT, ArcSWAT (version 2012.10.8), is used for this study, which is basically an interface to the SWAT model (version 2015). As a first step of the modelling process, average monthly flow rates of surface runoff, lateral subsurface flow, seepage from groundwater, evapotranspiration and deep aquifer recharge are calculated for all sub-basins. SWAT evaluates these hydrologic components to finally compute discharge rates for all reaches of the river. The SUFI-2 algorithm in the SWAT-CUP software (Abbaspour, 2012) is used for sensitivity analysis and model calibration. In the second step of the modeling process, the flow-calibrated model is run to simulate diffuse source TN and TP loads originating from each defined sub-basin. The simulation time is set for a 5-year period (1.1.2012 – 31.12.2016) including a warm-up period of 3 years. The calibration period spans from May 2015 to April 2016. Other details about the SWAT modelling study is reported in (Elçi & Ayaz, 2017).
Table 1. Point-source loadings considered in the water quality model
Constituent Domestic wastewater
effluents (kg/d)
Industrial wastewater effluents (kg/d)
BODu 1456.8 4639.7
Ammonium + Nitrate 319.7 132.64
Phosphate 85.61 32.11
Figure 2. Distribution of model segments on the simulated portion of the Mudurnu river
2.3
Loading Reduction Scenario for Pollution Sources
for the period of 2016-2040. Consequently, flow and contaminant load boundary conditions, flow and contaminant loadings from tributaries, point source loads are modified to reflect point-source and diffuse-source reductions, and all models are run for the future period. Future flow rates of the river and its tributaries are estimated using the SWAT model. Meteorological data input is calculated with the built-in weather generator that utilizes long-term statistics of meteorological variables. Nutrient loadings from diffuse sources are controlled by implementing 30-m wide vegetated filter strips (VFSs) which intercept runoff from upstream agricultural land and attenuate nutrients by reducing overland flow and thereby increasing infiltration (Elçi, 2017). Assuming immediate VFS implementation in a single agriculture-intensive sub-basin, SWAT model simulation results yield a diffuse-source TN and TP load reduction of 66% and 89%, respectively. Point sources loadings from domestic wastewater effluents are presumed to be reduced by commissioning new municipal wastewater treatment plants and/or upgrading current plants. By the year 2040, ammonium and nitrate loads are expected to be reduced by 9.2%, phosphate by 26.5% and BOD by 58.9%.
3
Results and Discussion
3.1
WASP Model Results
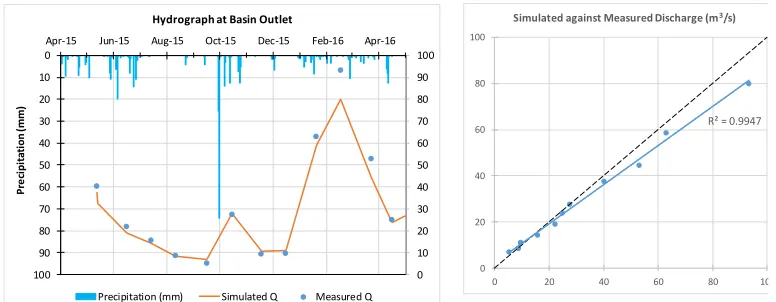
Using the WASP model, flowrates into and out of each model segment, flow depths, velocities and segment volumes are calculated. The model is calibrated with observed data collected at two flow monitoring stations, one of which is located at the basin outlet. The simulated hydrograph and a comparison of simulated and observed flowrates are shown in Figure 3. Calibration statistics confirm the good match between observed and simulated flowrates; the root-mean-squared-error at the basin
outlet is found as 4.89 m3/s, the Nash-Sutcliffe efficiency as 0.963 and the regression coefficient (R2)
as 0.9947. The mean calculated and measured flowrates at the basin outlet are 28.60 m3/s and 31.05
m3/s, respectively. Flowrates and segment water volumes obtained from the calibrated model are
eventually transferred to the Aquatox water quality model as input data.
Figure 3. Comparison of WASP simulated river discharge against measured data
3.2
SWAT Model Results
Diffuse source nutrient loads to the river are predicted for each sub-basin with the SWAT model. Model results for nitrogen loads are broken down as nitrate (surface runoff, lateral subsurface flow and groundwater components) and organic nitrogen. Phosphorus loads are reported as soluble mineral
0 10 20 30 40 50 60 70 80 90 100 0 10 20 30 40 50 60 70 80 90 100
Apr-15 Jun-15 Aug-15 Oct-15 Dec-15 Feb-16 Apr-16
Pr e ci pi ta ti o n (m m )
Hydrograph at Basin Outlet
Precipitation (mm) Simulated Q Measured Q
R² = 0.9947
0 20 40 60 80 100
0 20 40 60 80 100
form, organic phosphorus and mineral phosphorus sorbed to sediment particles. For this study, SWAT model results are reported as sums, i.e. total nitrogen and total phosphorus and only for the calibration period of May 2015 – April 2016. Spatial distributions of total nitrogen and phosphorus loads are shown in Figure 4. Results indicate that the total annual nitrogen load ranges from 1.32 to 462 t/yr, averaging 67.6 t/yr for the entire river basin. Total phosphorus loads range from 0.024 to 20.2 t/y with a basin average of 4.61 t/yr. The distribution of loads is very heterogeneous and appear to be correlated with the relative area of land use class reserved for agriculture. The dominant components of the total nitrogen load are nitrate coming from groundwater and lateral flow. Mineral nitrogen in surface runoff is relatively insignificant. Total phosphorus is mostly originating from mineral forms of phosphorus carried to the river by sediments.
(a)
(b)
Figure 4. Annual loads of (a) total nitrogen and (b) total phosphorus predicted with the SWAT model
3.3
Aquatox Model Results
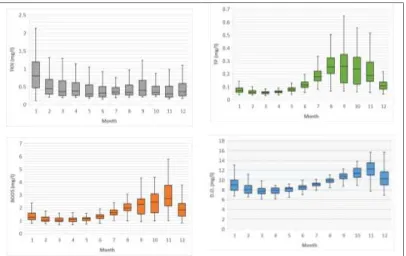
Simulated total Kjeldahl nitrogen (TKN), TP, BOD5 and dissolved oxygen (D.O.) concentrations
at the Mudurnu river basin outlet for the period of 2016-2040 are shown in Figure 5. TKN concentrations vary between 0.11-2.13 mg/l with the highest mean concentration occurring during the months of January. It is evident that TP concentrations are expected to have a higher variability (0.032-0.65 mg/l). Highest (0.26 mg/l) and lowest (0.059 mg/l) mean concentrations are predicted for
September and March, respectively. The range of simulated BOD5 concentrations is determined as
0.67-5.75 mg/l. Similar to TP, BOD5 concentrations are expected to increase in the summer months
with a peak in the months of October. D.O. concentrations fluctuate within a relatively narrow range (6.05-15.07 mg/l). Highest (12.15 mg/l) and lowest (7.86 mg/l) mean D.O. concentrations are expected to occur in November and March, respectively.
Concentration profiles for various water quality parameters are shown in Figure 6. Here, the profiles represent predicted long-term (2016-2040) average concentrations for the wet months (October through March) and dry months (April through September) of the year. According to the results, it can be concluded that water quality for the Mudurnu river is expected to be class II with
respect to BOD5, D.O. and TKN. However, for the downstream 7 km river reach, water quality is
Figure 5. Water quality model simulation results: Temporal concentration changes (Box-Whisker plot) in TKN, TP, BOD5, and D.O. at the basin outlet for the period 2016-2040
Figure 6. Longitudinal long-term (2016-2040) concentration profiles for BOD5, D.O., TKN and TP for
different periods of the year
4
Conclusions
The impact of pollutant load reduction scenarios in the Mudurnu river basin is evaluated with the sequential use of WASP, SWAT, and Aquatox models. Model results are assessed for the period of 2016-2040. It can be concluded that pollutant load reductions are adequate for improving the water quality of the river. After the implementation of measures, improvement can be predicted for all water quality indicators. Furthermore, modelling results show that TP loadings are particularly effective on the water quality and hence should be prioritised in load reduction efforts. The required reductions of
0 2 4 6 8 10 12 0 5 10 15 20 25 30 35 Co n ce n tr at io n (mg /l )
Distance from confluence (km)
Mudurnu River Seasonal BOD5and D.O. Concentration Profiles (2016-2040)
BOD5 (dry) BOD5 (wet) D.O. (dry) D.O. (wet)
0 0.1 0.2 0.3 0.4 0.5 0.6 0.7 0 5 10 15 20 25 30 35 Co n ce n tr at io n (mg /l )
Distance from basin outlet (km)
Mudurnu River Seasonal TKN and TP Concentration Profiles (2016-2040)
pollutant load from each point source should be finally evaluated using a total maximum daily load approach. It is recommended here that the load reductions are estimated using a simulation-optimization approach as a follow-up modelling study.
Acknowledgement
This study was supported by the Directorate General for Water Management, Ministry of Forestry and Water Affairs of the Turkish Republic. The authors would like to thank the Directorate’s administration and staff for their involvement in the study.
References
Abbaspour, K.C., SWAT-CUP4: SWAT Calibration and Uncertainty Programs - User Manual. Department of Systems Analysis, Integrated Assessment and Modelling (SIAM), EAWAG, Swiss Federal Institute of Aquatic Science and Technology, Duebendorf, Switzerland, 2011.
Ambrose, R.B., .A. Wool, WASP7 Stream Transport - Model Theory and User's Guide, U.S. EPA National Exposure Research Laboratory, Ecosystems Research Division, Athens, GA, 2009. Arnold, J.G., D.N. Moriasi, P.W. Gassman, K.C. Abbaspour, M.J. White, R. Srinivasan, C. Santhi,
R.D. Harmel, A. van Griensven, M.W. van Liew, N. Kannan, M.K. Jha, SWAT: Model use, calibration, and validation, Transactions of the ASABE 55 (2012) 1491–1508.
CARD, SWAT Literature Database for Peer-Reviewed Journal Articles, Center for Agricultural and
Rural Development, Iowa State University, Ames, Iowa, available at:
https://www.card.iastate.edu/swat_articles/, 2018 (verified 14 February 2018).
Ekdal, A., M. Gürel, C. Güzel, A. Erturk, A. Tanik, I.E. Gonenc, Application of WASP and SWAT models for a Mediterranean Coastal Lagoon with Limited Seawater Exchange, J. Coastal Research SI64 (2011) 1023–1027.
Elçi, A., Evaluation of Nutrient Retention in Vegetated Filter Strips using the SWAT Model, Water Science and Technology 76 (2017) 2742–2752.
Elçi, A., S. Ayaz, Predicting Diffuse Source Pollution for a Nutrient-Sensitive River Basin with the SWAT Model, in: A.A. Ghani (Ed.), Proceedings of the 37th IAHR World Congress, Kuala Lumpur, Malaysia, pp. 5127−5131, 2017.
Park, J.Y., G.A. Park, S.J. Kim, Assessment of Future Climate Change Impact on Water Quality of Chungju Lake, South Korea, using WASP Coupled with SWAT, J. American Water Works Assoc. 49(6) (2013) 1225–1238.
Park, R.A., J.S. Clough, M.C. Wellman, M.C. AQUATOX: Modeling environmental fate and ecological effects in aquatic ecosystems, Ecological Modelling 213 (2008) 1–15.
Rode, M., B. Klauer, D. Petry, M. Volk, G. Wenk, D. Wagenschein, Integrated nutrient transport modelling with respect to the implementation of the European WFD: The Weiße Elster Case Study, Germany, Water SA 34 (2008) 490–496.