____________________________________________________________________________________________
*Corresponding author: Email: helen.truby@monash.edu.;
Studies Examining Whether Sugar Added to
Foods Changes Body Weight: Is a Sweet
Solution Out There?
Robin A Ralston
1, Karen Z Walker
1and Helen Truby
1*1
Department of Nutrition and Dietetics, Monash University, Level 1, 264 Ferntree Gully Road, Notting Hill, Vic 3168, Australia.
Author’s contribution
Author RAR verified the final studies to be included in the systematic review and drafted the manuscript and revisions. Authors HT and KZW oversaw and contributed ideas throughout the review and helped with manuscript revision. All authors approved the final manuscript.
Received 10th December 2012 Accepted 7th August 2013 Published 21st August 2013
ABSTRACT
This review re-examines the studies relating sugar consumption to development of overweight or obesity as identified for the recent revision of the Australian Dietary Guidelines. All studies identified for the initial evidence review that examined sugars added to foods (one systematic review, three randomised controlled trials, one retrospective cohort study) were re-examined for biases, methodological flaws, and potential confounders that may have affected outcome or quality rating. While the initial evidence review itself followed rigorous methods, methodological issues were evident among primary studies, including short duration of interventions, difficulties with estimating total sugar intake and distinguishing natural versus added sugars, overlooking effects of the food matrix and metabolic differences between glucose and fructose. Few studies examined isocaloric interventions and some introduced concurrent interventions confounding the effect of sugar. Most (71%) of the included studies were funded by the food industry. More high quality, well-controlled longitudinal studies are yet required to support public health messages relating to sugar added to foods and the risk of weight gain.
Keywords: Body weight; methods; overweight; sugar intake.
113
1. INTRODUCTION
In 2009, the Australian National Health and Medical Research Council (NHMRC) commissioned a series of systematic literature reviews in preparation for an update of the Australian Dietary Guidelines, which are now released [1]. These include the recommendation that Australians should “limit intake of foods and drinks containing added sugars” and in particular their intake of sugar sweetened drinks [1]. As one part of the preparation for drafting this recommendation, a number of systematic reviews were undertaken to examine the evidence on the relationship between sugar consumption and the development of overweight or obesity [2]. Three specific aspects were examined: (1) the association between consumption of sugars and change in measures of body weight status, (2) the association between type of sugar consumed and weight gain, and (3) the association between consumption of fructose and increased measures of weight status. Although robust methods were used to search the available evidence [3], an evidence statement could only be made indicating a probable relationship (i.e. evidence of Grade B) that consumption of sugar-sweetened beverages is associated with increased risk of weight gain in adults and children [2]. In relation to sugar added to foods, the evidence was weak due to the low quantity and low quality [4] of included studies, and thus no evidence statement could be made. In this commentary we critique the evidence uncovered by the NHMRC Evidence Report [2] relating levels of sugar consumed in foods to obesity, noting problem areas and methodological issues of the primary studies that should inform and drive further research. Evidence relating obesity to sugars in beverages was stronger, and we do not critique this here.
2. METHODS
NHMRC Systematic Review: The systematic review on sugars that is the basis of this
commentary followed recommended processes [3] to search seven databases from Jan 2002 to July 2009. Search criteria (including terms such as sugar, syrup, glucose, fructose, sucrose, malt, monosaccharide, disaccharide, honey, molasses, starch hydrolysate, maltodextrin, and polydextrose, as well as body weight, overweight, obesity, and body mass index) were approved by the Dietary Guidelines Working Committee of the NHMRC. Case-control studies and cross-sectional studies were not included due to their low level of evidence[5] and no attempt was made to include unpublished studies. Details of this review are published [2]. Studies examining sugar intake from foods were included, while studies examining sugar intake from beverages were instead included in a different NHMRC systematic review [2].
Narrative Review: This narrative review is a commentary on the results of the NHMRC
Evidence Report on the association between sugar intake from foods and development of overweight and obesity, used to inform the 2013 Australian Dietary Guidelines. Using the same list of recommended questions to check validity as the NHMRC [4], each primary study included in the NHMRC Evidence Report was critically re-examined and evaluated for biases and potential flaws.
3. RESULTS AND DISCUSSION
114
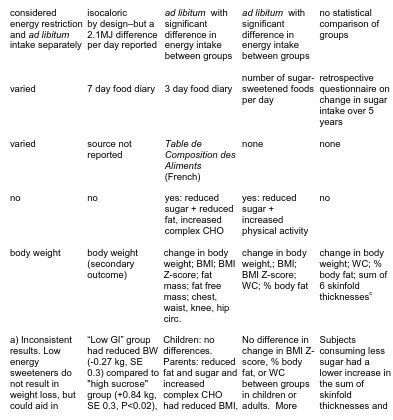
Table 1. Biases and flaws of studies included in the NHMRC Evidence Report examining the relationship in adults between sugar consumption and body weight
Study Vermunt[6] Brynes[7] Paineau[8] Rodearmel [9] Drapeau[10]
Design SRL RCT RCT RCT
retrospective cohort
Number of studies 12a
a) low energy sweeteners: 4 b) complex CHO:
5
c) fat: 3
1 1 1 1
Definition total
sugars
total sugars
total sugars
total sugars
total sugars
Food matrix not
considered
not considered
not considered
not considered
not considered
Sugar type mixed mixed mixed mixed mixed
Participants and
Sample size
children & adults:
a) 30-160 b) 40-300 c) 40-220
17 men children +
parents:b
a) fat: 280 +280 b) fat & sugar:
275 + 274
c) control:
394 + 393
95 children 109 parents
248 adults
Study duration
a) 9 weeks-4 years b) 2 weeks-6 months c) 14 days-6 months
115
Control of energy intake considered
energy restriction and ad libitum intake separately
isocaloric by design–but a 2.1MJ difference per day reported
ad libitum with
significant difference in energy intake between groups
ad libitum with
significant difference in energy intake between groups no statistical comparison of groups
Method for determining
food intake varied 7 day food diary 3 day food diary
number of sugar-sweetened foods per day
retrospective questionnaire on change in sugar intake over 5 years
Nutrient analysis varied source not
reported
Table de
Composition des Aliments
(French)
none none
Concurrent intervention no no yes: reduced
sugar + reduced fat, increased complex CHO yes: reduced sugar + increased physical activity no
Outcome measure body weight body weight
(secondary outcome)
change in body weight; BMI; BMI Z-score; fat mass; fat free mass; chest, waist, knee, hip circ.
change in body weight,; BMI; BMI Z-score; WC; % body fat
change in body weight; WC; % body fat; sum of 6 skinfold thicknessesc
Major findings a) Inconsistent
results. Low energy sweeteners do not result in weight loss, but could aid in
“Low GI” group had reduced BW (-0.27 kg, SE 0.3) compared to "high sucrose" group (+0.84 kg, SE 0.3, P<0.02),
Children: no differences. Parents: reduced fat and sugar and increased complex CHO had reduced BMI,
No difference in change in BMI Z-score, % body fat, or WC between groups in children or adults. More
Subjects consuming less sugar had a lower increase in the sum of skinfold
116 weight
maintenance. b) With energy
restriction, CHO source had no effect. With ad
libitum intake,
greater weight loss with
complex CHO vs
simple CHO. c) No difference
in change in BW between sucrose and fat diets.
with no difference in energy intake.
reduced fat mass, and lower
increase in hip circ., compared to control (P<0.05).
children in intervention group maintained or reduced BMI-for-age and fewer increased BMI-for-age than in the control group (P<0.05).
WC than subjects
consuming more or the same amount of sugar during the past 5 years (P<0.05).
Conflict of interestd Potential: funded
by Sugar
Netherlands
Potential: funded by Sugar Bureau
Likely: design and funding by
Centre d’Etudes et de
Documentation du Sucre
Likely: funded by
McNeil Nutritionals
(manufactures
Splenda); Splenda
provided to participants
No
a
Three different interventions were performed in this study: a) low energy sweeteners, b) complex carbohydrates, and c) fat b
Three different interventions were performed in this study: a) fat, b) fat and sugar, and c) control c
Skinfold thickness measurements included triceps, biceps, medial calf, subscapular, supra-iliac and abdominal d
It is reported that studies funded solely by the food industry have significantly higher risk of reporting favourable/neutral rather than unfavourable conclusions [11]. This is one component of the validity questions used by the NHMRC [4].
117
3.1 Added Sugars versus Total Sugars
The first issue relates to defining added sugars and noting how their presence is identified. According to the USDA, added sugars are incorporated in foods during processing or preparation [12] and include not only sucrose but other sugars such as glucose, fructose and corn syrup [1]. This is complicated by the observation that the definition of added sugars varies among organizations[1,12,13] (Table 2). Consumers however, are unable to readily determine the level of added sugars in foods since in Australia, as in the U.S., the Nutrition Information panel (or the Nutrition Facts Label) refers only to sugars or total sugars, i.e. the sum total of all added sugars and natural sugars present. Yet added sugars and total sugars can differ nutritionally [14]. While natural sugars may be found in nutrient-rich foods (e.g. lactose in milk or fructose in fruit), added sugars are often found in highly refined foods that are characteristically lacking in many important nutrients. The NHMRC systematic review examined only those studies examining foods with added sugars or high in total sugars. Studies examining only sugars occurring naturally in foods were excluded.
A brief example can indicate the difficulty of this distinction when considering the effect of sugar in foods on weight control. Compare a study where the breakfast intake comprises: one cup of cornflakes sprinkled with 10g raw sugar (612 KJ, 12.5 g sugars) versus a study where the breakfast intake comprise one cup of cornflakes plus 12g sultanas (612KJ, 11.8 g sugars). Although only the first study would be included in the NHMRC review, the interventions are isocaloric and would have a similar impact on body weight.
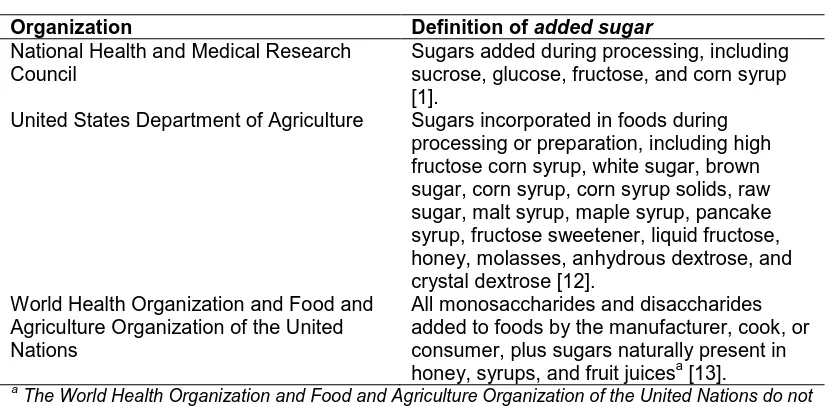
Table 2. Definitions of added sugars among various organizations
Organization Definition of added sugar
National Health and Medical Research Council
Sugars added during processing, including sucrose, glucose, fructose, and corn syrup [1].
United States Department of Agriculture Sugars incorporated in foods during processing or preparation, including high fructose corn syrup, white sugar, brown sugar, corn syrup, corn syrup solids, raw sugar, malt syrup, maple syrup, pancake syrup, fructose sweetener, liquid fructose, honey, molasses, anhydrous dextrose, and crystal dextrose [12].
World Health Organization and Food and Agriculture Organization of the United Nations
All monosaccharides and disaccharides added to foods by the manufacturer, cook, or consumer, plus sugars naturally present in honey, syrups, and fruit juicesa [13].
a
The World Health Organization and Food and Agriculture Organization of the United Nations do not use the term added sugar, but instead use the term free sugars
3.2 Impact of Food Matrix
118 energy density were provided to 58 adults at weekly intervals, followed by a standard test meal consumed ad libitum. The isocaloric preload meals were all composed of apples, provided in the form of peeled whole fruit, puréed applesauce, or apple juice with or without added pectin. The pre-meal of whole apples had the greatest impact on satiety and reduced total food intake (pre-meal + test meal) by 15%. No studies in the NHMRC review considered the effects of food matrix.
3.3 Form of Sugar: Sucrose versus Glucose versus Fructose
A third issue concerns differences in absorption and metabolism of different types of sugars consumed through foods, particularly glucose and fructose. While glucose on its own is actively absorbed via the SGTL1 transporter, the capacity for fructose absorption by GLUT-2 is limited unless glucose is also present [18]. Consumption of foods containing an excess of fructose over glucose (such as apples, pears and fruit juice) may therefore result in fructose malabsorption with impact on total energy intake [19]. Another difference is that while glucose uptake by the liver and other tissues depends on insulin action, liver uptake of fructose does not require insulin [20]. Moreover, as fructose entry into the glycolytic pathway is enzymatically unregulated, high fructose consumption is associated with increased lipogenesis, leading to hyperlipidemia and potentially obesity [21,22]. High intakes of sucrose (which is 50% fructose) or of high-fructose corn syrup (usually 55% fructose in food products) can have similar adverse effects on postprandial triglyceridemia [23]. Additionally, fructose, unlike glucose, appears able to stimulate ‘hedonic’ pathways in the brain creating habituation and leading to potential overconsumption [24]. None of the studies included in the NHMRC Evidence Report specifically examined the association between fructose consumption and change in body weight, but instead examined effects of added sugars, without distinguishing between this mix of sucrose, glucose, and fructose.
3.4 Duration of Intervention
Other problems with the evidence under review concerned study design issues, including the duration of interventions. The NHMRC Evidence Report mainly included relatively short-term RCTs. Although the largest of these [8] included more than 500 subjects, the intervention lasted for only 10 months. Generally for weight studies in adults, a minimum follow-up of 1-2 years is recommended [25].
3.5 Control of Total Energy Intake
Comparison between studies is further complicated by whether intervention trials held total energy intake constant or followed effects on satiety by allowing an ad libitum intake. Of the three RCTs included in the NHMRC Evidence Report, only one [7] sought to hold energy intake constant. Yet although this was the aim, in practice a difference in energy intake between the intervention (‘low glycaemic index’) group and the control (‘high sucrose’) group of 2.1MJ/day could potentially have led to weight changes longer-term.
119 in one of the intervention groups. Both studies reported significant differences in energy intake between the two intervention groups. Therefore while weight loss as a result of reduced sugar intake proved significant, it does not follow that sugar reduction is necessarily more effective than reduction of any other energy-providing nutrients.
3.6 Method of Measuring Sugar Consumption
Difficulties may also arise in determining sugar consumption accurately. Often sugar consumption is measured by self-report through dietary records, a method that is inherently subject to bias. Of the studies included in the Evidence Report, one RCT [8] and the retrospective cohort [11] used 3-day dietary records to determine total sugar intake, while another RCT [7] used 7-day records. Another RCT [9] included in the Evidence Report captured the consumption of sweet foods via a food frequency questionnaire (FFQ). These are sometimes but not always an accurate means of determining sugar intake since accuracy can depend on whether the questions relating to sugar intake have been well designed for the target population [26]. The systematic review also included a cohort study where participants were asked how their sugar intake had changed over the past five years [10]. These recall methods appear to be much less reliable than food diaries and often underestimate portion sizes [14,27].In future studies, a more accurate assessment of actual sugar consumption may be possible through measuring urinary fructose or sucrose, which has been shown to be correlated with sugar intake measured by dietary records [28].
From food intake data, consumption of total sugars, added sugars and naturally occurring
sugars can be quantified using food composition tables or databases. Three of the studies
included in the NHMRC systematic review calculated consumption of sugars in this way [7,8,10], buttwo merely recorded the number of sugar-sweetened foods consumed/day [9,10]. For future studies, high quality country-specific food composition databases will be necessary in order to precisely distinguish between intake of different types of sugars [29]. Interestingly, Food Standards Australia New Zealand’s NUTTAB (Nutrition Tables for Use in Australia) lists only total sugars [30].
3.7 Confounding Concurrent Interventions
Many interventions that aim to reduce sugar consumption also involve other measures such as restriction of dietary fat. While such combined interventions may be effective for weight loss, they make it difficult to separate out the individual effects of sugar. Of the studies included in the NHMRC systematic review, two were confounded by concurrent interventions: one also reduced total fat and increased complex carbohydrate [8], and the other also increased physical activity [9]. To isolate the effect of sugar, future studies should focus on a sugar intervention alone.
3.8 Method of Measuring Weight Status
120
3.9 Possible Conflict of Interest Due to Funding Source
A notable finding was that most (80%) of the studies uncovered in the NHMRC systematic review were funded or administered by the food industry or organisations with significant conflict of interest with sugar-related research. These included: the Sugar Bureau [7], McNeil Nutritionals (manufactures Sucralose) [9], Centre d’Etudes et de Documentation du Sucre (the French Sugar Institute) [8], and Sugar Netherlands [6]. While association with a food company does not necessarily mean that the study is of poor quality [31], checklists evaluating study quality will often include a score for the introduction of bias from such funding sources [4]. One review has reported that studies funded solely by the food industry had significantly higher risk of reporting favourable/neutral rather than unfavourable conclusions [11]. There is a need for future studies to be conducted independently from organisations with potential conflict of interest.
3.10 Recent Published Studies
Since the NHMRC systematic review was undertaken, a review and meta-analysis that specifically examines the effect of fructose on body weight has been published [32]. This reported that although high consumption of fructose added to daily intake increased body weight, fructose had no overall effect when provided in isocaloric interventions. Similar findings were reported in the recent World Health Organization/Food and Agricultural Organization systematic review and meta-analysis examining dietary sugars and body weight [33]. Consistent with our findings, most trials reviewed in these two recent publications had methodological limitations including short duration and poor study quality.
4. CONCLUSIONS
In conclusion, while the NHMRC systematic review was conducted thoroughly and appropriately, several methodological issues were uncovered in the primary studies included in the report. It was not possible to develop a dietary guideline because of the overall weak evidence in this area. When designing sugar intervention studies, it is important to distinguish between natural versus added sugars, and glucose versus fructose in both isocaloric and hypercaloric trials. To improve the evidence base and enable a higher quality level to be applied by systematic review teams, factors such as potential bias due to funding bodies with a conflict of interest, short study duration, insufficient consideration of differences in energy intakes, poor estimation of sugar intake, and concurrent interventions that confound the effect of sugar all need to be addressed. High quality, well-controlled studies in this area are urgently needed to provide an improved evidence base for public health messages regarding sugar consumption and risk of weight gain.
ACKNOWLEDGEMENTS
121
COMPETING INTERESTS
Authors have declared that no competing interests exist.
REFERENCES
1. National Health and Medical Research Council. Eat for Health: Australian Dietary Guidelines. 2013; NHMRC, Canberra.Available from:
http://www.nhmrc.gov.au/_files_nhmrc/publications/attachments/n55_australian_dietar y_guidelines_0.pdf. Accessed 6 Mar 2013.
2. National Health and Medical Research Council. A review of the evidence to address targeted questions to inform the revision of the Australian Dietary Guidelines. 2011; NHMRC, Canberra.Available from:
https://www.eatforhealth.gov.au/sites/default/files/files/the_guidelines/n55d_dietary_gu idelines_evidence_report.pdf,Accessed 6 Mar 2013.
3. National Health and Medical Research Council. How to review the evidence: systematic identification and review of the scientific literature.NHMRC; 2000, Canberra.
4. American Dietetic Association. Evidence Analysis Manual: Steps in the ADA Evidence Analysis Process. Chicago, IL 2008; American Dietetic Association, Washington D.C. 5. National Health and Medical Research Council. Appendix B: Designation of levels of
evidence: 1998; NHMRC, Canberra.
6. Vermunt SH et al. Effects of sugar intake on body weight: a review. Obes Rev. 2003;4:91-9
7. Brynes AE, et al. A randomised four-intervention crossover study investigating the effect of carbohydrates on daytime profiles of insulin, glucose, non-esterified fatty acids and triacylglycerols in middle-aged men. Br J Nut. 2003;89:207-18.
8. Paineau DL, et al. Family dietary coaching to improve nutritional intakes and body weight control: a randomized controlled trial. Arch Pediatr Adolesc Med. 2008;162:34-43.
9. Rodearmel SJ, et al. Small changes in dietary sugar and physical activity as an approach to preventing excessive weight gain: the America on the Move family study. Pediatrics. 2007;120:e869-79.
10. Drapeau V, et al. Modifications in food-group consumption are related to long-term body-weight changes. Am J Clin Nutr. 2004;80:29-37.
11. Lesser LI, Ebbeling CB, Goozner M, Wypij D, Ludwig DS. Relationship between funding source and conclusion among nutrition-related scientific articles. PLoS Med. 2007;4:e5.
12. U.S. Department of Agriculture, U.S. Department of Health and Human Services. Dietary Guidelines for Americans, 2010. Chapter 3: Foods and Food Components to Reduce. Washington DC: U.S. Government Printing Office; 2010.
13. World Health Organization. Diet, Nutrition and the Prevention of Chronic Diseases. 2003; WHO: Geneva.
14. Sigman-Grant M, Morita J. Defining and interpreting intakes of sugars. Am J Clin Nutr. 2003;78:815S-26S.
15. DiMeglio DP, Mattes RD. Liquid versus solid carbohydrate: effects on food intake and bodyweight. Int J Obes Rel Metab Dis. 2000;24:794-800.
122 17. Flood-Obbagy JE, Rolls BJ. The effect of fruit in different forms on energy intake and
satiety at a meal. Appetite. 2009;52:416-22.
18. Drozdowski LA, Thomson AB. Intestinal sugar transport. World J Gastroenterol. 2006;12:1657-70.
19. Gibson PR, Shepherd SJ. Personal view: food for thought--western lifestyle and susceptibility to Crohn's disease. The FODMAP hypothesis. Aliment Pharmacol Ther. 2005;21:1399-409.
20. Schaefer EJ, Gleason JA, Dansinger ML. Dietary fructose and glucose differentially affect lipid and glucose homeostasis. J Nutr. 2009 139:1257S-62S.
21. Havel PJ. Dietary fructose: implications for dysregulation of energy homeostasis and lipid/carbohydrate metabolism. Nutr Rev. 2005;63:133-57.
22. Parks EJ, Skokan LE, Timlin MT, Dingfelder CS. Dietary sugars stimulate fatty acid synthesis in adults. J Nutr. 2008;138:1039-46.
23. Stanhope KL, Griffen SC, Blair BR, Swarbrick MM, Keim NL, Havel PJ. Twenty-four-hour endocrine and metabolic profiles following consumption of high-fructose corn syrup-, sucrose-, fructose-, and glucose-sweetened beverages with meals. Am J Clin Nutr. 2008;87:1194-203.
24. Lustig RH. Fructose: metabolic, hedonic, and societal parallels with ethanol. Am Diet Assoc. 2010;110:1307-21.
25. Wing RR, Phelan S. Long-term weight loss maintenance. Am J Clin Nutr. 2005;82:222S-5S.
26. Bingham SA, Gill C, Welch A, et al. Comparison of dietary assessment methods in nutritional epidemiology: weighed records v. 24 h recalls, food-frequency questionnaires and estimated-diet records. Br J Nutr. 1994;72:619-43.
27. Krebs-Smith SM, Graubard BI, Kahle LL, Subar AF, Cleveland LE, Ballard-Barbash R. Low energy reporters vs others: a comparison of reported food intakes. Eur J Clin Nutr. 2000;54:281-7.
28. Tasevska N, Ruswick SA, McTaggart A, Bingham SA. Urinary sucrose and fructose as biomarkers for sugar consumption. Cancer Epidemiol Biomarkers Prev. 2005;14: 1287-94.
29. Harrison GG. Fostering data quality in food composition databases: applications and implications for public health. J Food Composit Anal.2004;17:259-65.
30. Food Standards Australia New Zealand. NUTTAB 2010 - Australian Food Composition Tables. Canberra.
31. Rowe S, Alexander N, Clydesdale FM, et al. Funding food science and nutrition research: financial conflicts and scientific integrity. Am J Clin Nutr. 2009;89:1285-9. 32. Sievenpiper JL, de Souza RJ, Mirrahimi A, Yu ME, Carleton AJ, Beyene J,Chiavaroli
L, Di Buono M, Jenkins AL, Leiter LA, Wolever TM, Kendall CW, Jenkins DJ. Effect of fructose on body weight in controlled feeding trials: a systematicreview and meta-analysis. Ann Intern Med. 2012;156(4):291-304.
33. Te Morenga L, Mallard S, Mann J. Dietary sugars and body weight: systematic review and meta-analyses of randomised controlled trials and cohort studies. Brit J Nutr. 2012;345:e7492-517.
_________________________________________________________________________ © 2013 Ralston et al.; This is an Open Access article distributed under the terms of the Creative Commons Attribution License (http://creativecommons.org/licenses/by/3.0), which permits unrestricted use, distribution, and reproduction in any medium, provided the original work is properly cited.
Peer-review history: