HTTPS://WWW.HEIGHPUBS.ORG ISSN
2573-7724
Research Article
Biological dose calculation using
variable RBE in Single- and
Multi-fi
eld Optimization IMPT plans for 3
Brain Tumor patients
Ryosuke Kohno
1-3*, Wenhua Cao
2, Pablo Yepes
2, Xuemin Bai
2,
Falk Poenisch
2, David R Grosshans
2, Tetsuo Akimoto
3and
Radhe Mohan
41Medical Physics Section, National Institute of Radiological Sciences, 4-9-1, Anagawa, Inage,
263-8555, Chiba, Japan
2Department of Radiation Physics, Unit 94, The University of Texas MD Anderson Cancer
Center, Houston, TX 77030, USA
3Division of Radiation Oncology and Particle Therapy, National Cancer Center, Kashiwa,
277-8577, Chiba, Japan
4Department of Radiation Oncology, Unit 1150, The University of Texas MD Anderson Cancer
Center, Houston, TX 77030, USA
*Address for Correspondence: Ryosuke Kohno,
Medical Physics Section, National Institute of Radiological Sciences, 4-9-1, Anagawa, Inage, 263-8555, Chiba, Japan,
Email: [email protected]
Submitted: 04 February 2019 Approved: 13 February 2019 Published: 14 February 2019
Copyright:© 2019 Kohno R, et al. This is an open
access article distributed under the Creative Commons Attribution License, which permits unrestricted use, distribution, and reproduction in any medium, provided the original work is properly cited
Keywords: Variable RBE; Intensity-modulated
proton therapy (IMPT); Monte carlo
How to cite this article: Kohno R, Cao W, Yepes P, Bai X, Poenisch F, et al. Biological dose calculation using variable RBE in Single- and Multi-fi eld Optimization IMPT plans for 3 Brain Tumor patients. J Radiol Oncol. 2019; 3: 001-007. https://doi.org/10.29328/journal.jro.1001027
Introduction
In current proton beam therapy, clinical dose is conventionally prescribed by scaling the physical proton dose using a proton relative biological effectiveness (RBE) relative to photons of 1.1. However, the RBE of protons depends on the linear energy transfer (LET), the dose per fraction, and the tissue type [1]. Since the RBE varies, the assumption that the RBE is a constant value of 1.1—that is, a ixed RBE (FRBE)—may limit the potential of proton beam therapy. Wedenberg et al., evaluated the impact of
Abstract
Purpose: The purpose of this study was to evaluate biological dose in single-fi eld optimization
(SFO) and multi-fi eld optimization (MFO) intensity-modulated proton therapy (IMPT) plans for brain
tumor patients that used a fi xed relative biological effectiveness (FRBE) and those that used a variable
RBE (VRBE).
Materials and methods: SFO and MFO IMPT plans were planned by the Varian Eclipse treatment planning system for three brain tumor patients. Dose and linear energy transfer (LET) distributions for each plan were recomputed using an in-house fast Monte Carlo dose calculator system, and then biological dose distributions were calculated with a FRBE of 1.1 or with a previously published VRBE model. We then compared biological dose distributions obtained by the VRBE with those obtained by the FRBE.
Results: Doses obtained by the VRBE for the gross tumor volume and clinical target volume in all plans were 1%-2% larger than those obtained by the FRBE. The minimum dose obtained by the VRBE for the brainstem in the SFO IMPT of one patient was 140% larger than that obtained by the FRBE, but the difference was only 5.3 cGy (RBE). The difference in maximum dose for the optic chiasm in the MFO IMPT of another patient was less than 3.2%, but the dose difference was 149.2 cGy (RBE). We also found that no major differences were seen between the biological dose differences in the SFO IMPT plans and those in the MFO IMPT plans.
disregarding variations in RBE in the comparison of proton and photon treatment plans [2], and Paganetti and Chen et al.,discussed the potential clinical impact of a variable RBE (VRBE) [3,4].
The latest proton beam scanning technique [5-7], can deliver dose more conformally than passive scattering proton beam therapy and can meet the clinical constraints of using state-of-the-art intensity-modulated proton therapy (IMPT) [8]. Clinical impact of a VRBE calculation for the IMPT has been evaluated by Frese et al. [9]. Currently, Kohno et al., reported biological dose comparisons between a RBE and a VRBE in SFO and MFO IMPT for a brain tumor [10]. For the clinical target volume, biological doses obtained by the VRBE were 1%-2% larger than those obtained by the FRBE. On the other hand, for organs at risk (OARs) located in the end of the beam, biological dose with the conventional FRBE had any dose errors in IMPT plans.
Here, since they evaluated only in one case, it is not suf icient to support their conclusion. Therefore, in this paper, we investigated biological dose comparison between the FRBE and the VRBE obtained in the SFO and MFO IMPT plans for three brain tumor patients with various tumor volume and tumor’s location.
Materials and Methods
We selected three brain tumor patients, who were treated with proton therapy at the University of Texas MD Anderson Cancer Center. Figure 1 shows the target volumes, target locations and organs at risk in the brain tumor treatment plans on a computed tomography slice. The tumors are surrounded in a complicated manner by nerve, brain, brainstem, bone, and sinus cavity. The gross tumor volume (GTV) and the clinical target volume (CTV) for each case are 6.3 cc and 111.8 cc for case (A), 37.4 cc and 70.4 cc for case (B), and 27.1 cc and 84.4 cc for case (C).
SFO and MFO IMPT plans were designed by the Eclipse treatment planning system (version 13.5; Varian Medical Systems, Inc., Palo Alto, CA). We used the same three coplanar beams in both IMPT plans for each patient. The prescribed proton radiotherapy doses were 5700 and 5000 cGy (RBE) to the GTV and CTV, respectively, in 30 fractions. Using a minimum dose and a maximum dose objective function with the same optimization conditions for both IMPT plans, all plans were designed to cover 100% of the GTV and the CTV and to minimize the maximum dose for the brainstem, the optic chiasma, both optic nerves, which the maximum dose constraint is 5400 cGy (RBE).
(A) (B)
(C)
GTV CTV Bra instem Optic chiasma O ptic nerve left Optic nerve right
GTV CTV Bra instem O ptic chiasma Optic nerve left O ptic nerve right
GTV CTV Bra instem O ptic chiasma O ptic nerve left O ptic nerve right
Physical dose and LET distributions for each plan were recomputed using an in-house “fast dose calculator” (FDC) [11,12]. The FDC is a fast Monte Carlo method, and can calculate dose distributions in less than 5 minutes per patient and is suitable for routine clinical work. The FDC has been validated by Geant4 for IMPT plans [13] and compared with Eclipse treatment planning system [14].
Biological dose distributions were calculated using the FDC with an FRBE of 1.1 and using the VRBE model published by Wilkens et al.[15]. Using a reference radiation with parameters ax a nd βx based on the linear-quadratic (LQ) model, t h e RBE at proton dose Dp on the dose averaged LET LETd is given by
(
)
2 00
4 ( )
, , , , , (1)
2
x x p d x p x
p d x x
x p
D LET D
RBE D LET
D
a b a l b a
a l a b
b
+ + +
-=
where a0 and λare the linear and the initial parameter, respectively, in terms of biologic response, a, to protons. We can describe the RBE as simply a function of the dose, the LET, and tissue-speci ic parameters. Biological parameters given by Frese et al. [9], were used in this study. To compare the FRBE and VRBE models, we performed a comparative analysis of dose distributions for each plan in each region of interest. The comparative analysis used the dosimetric parameters of minimum, maximum, and mean dose.
Results and Discussion
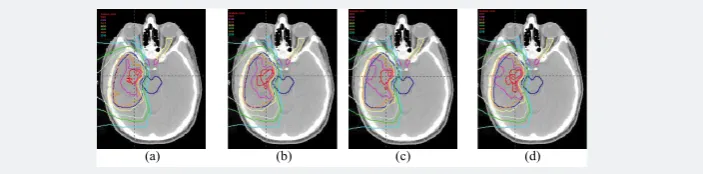
Figure 2 exempli ies iso-dose distributions of the FRBE(a) and the VRBE(b) in the SFO IMPT plan, and the FRBE(c) and the VRBE(d) in the MFO IMPT plan for a patient in igure 1(A). We could not observe visually differences among them. Figure 3 and 4 show dose volume histograms (DVH) of the target volumes such as the GTV and the CTV, and the organs at risk (OAR) such as the brainstem, the optic chiasma, the left optic nerve and the right optic nerve in the SFO IMPT plans for each patient. DVHs in the MFO IMPT plans are shown in igures 5 and 6. Then, Figures 7 and 8 show dose averaged LET LETd volume histograms in the SFO and MFO IMPT for each patient.
(a) (b) (c) (d)
Figure 2: Iso-dose distributions of FRBE( a) and VRBE (b) for SFO IMPT plan, and FRBE (c) and VRBE (d) for MFO IMPT plan for patient of Figure 1(A).
(A) (B)
(C)
(A) (B)
(C)
Figure 4: DVHs of brainstem, optic chiasma and both optic nerves for FRBE and VRBE in SFO IMPT plans for each patient.
(A) (B)
(C)
Figure 5: DVHs of GTV and CTV for FRBE and VRBE in MFO IMPT plans for each patient.
(A) (B)
(C)
Figure 6: DVHs of brainstem, optic chiasma and both optic nerves for FRBE and VRBE in MFO IMPT plans for each patient.
(A) (B)
(C)
For the GTV, the SFO IMPT plans for three patients obtained by the FRBE and by the VRBE models differed by a mean (± standard deviation) of 1.7±0.4% in minimum dose, 1.5±0.4% in maximum dose and 1.4±0.2% in mean dose. Those differences for the MFO IMPT plans were 2.6±0.9%, 1.7±0.2% and 1.5±0.2%. For the CTV, the SFO IMPT plans differed by 2.7±1.8% in minimum dose, 1.5±0.4% in maximum dose and 1.4±0.1% in mean dose. Those differences for the MFO IMPT plans were 2.7±1.8%, 1.8±0.3% and 1.4±0.1%. Overall, doses obtained by the VRBE for the target volumes were about 2% larger than those obtained by the FRBE as well as the results in the previous study [10].
For each OAR, the differences in minimum dose were considerably larger than those in maximum and mean dose. For the brainstem in the SFO IMPT of the patient (C), the minimum dose obtained by the VRBE was 139.5% larger than that obtained by the FRBE, and this was the largest difference due to the maximum LETd of 12.6 keV/ μm. However, the dose difference was only 5.3 cGy (RBE). Additionally, the differences in maximum and mean dose were 2.0% but 103.4 cGy (RBE), and 6.9% but 79.7 cGy (RBE). In the SFO IMPT of the patient (A) with a target on the right side, the differences in minimum dose between the VRBE and the FRBE for the left optic nerve were 54.9% but only 2.8 cGy (RBE). The differences in maximum and mean dose were 9.9% but 66.7 cGy (RBE), and 41.3% but 23.8 cGy (RBE). In the SFO IMPT of patient (B) with a target on the left side, the differences in minimum dose between the VRBE and the FRBE for the right optic nerve was 73.9% but only 1.7 cGy (RBE). The differences in maximum dose and mean dose were 12.7% but 78.4 cGy (RBE), and 31.2% but 18.6 cGy (RBE).
The maximum dose to these critical organs is the most important clinical parameter. For the optic chiasm in the MFO IMPT of patient (A), the maximum dose obtained by the FRBE was 4641.4 cGy(RBE), and one obtained by VRBE was 4790.6 cGy(RBE). Namely, the difference in maximum dose in the optic chiasm was less than 3.2% but constituted the maximum dose difference of 149.2 cGy (RBE). This maximum dose was much less than the maximum dose constraint of 5400 cGy (RBE).
Thus, we observed that doses obtained by the VRBE for OARs were larger than those obtained by the conventional FRBE, and these dose differences depended on location of OARs. Incidentally, we also con irmed that a one-to-one correlation coef icient R2 for each dose difference between the SFO plans and the MFO IMPT plans was 0.9883, and there were no differences between both plans. We also found that no major differences for LETd volume histograms were seen between the SFO IMPT plans and the MFO IMPT plans for each patient. Namely, we did not observe any in luence of the irradiation method.
It was obvious that biological dose calculation with the VRBE gave any dose differences in clinical case. These differences may be able to explain more precisely
(A) (B)
(C)
clinical effects. Naturally, biological dose distributions depend on the RBE calculation model. Although the phenomenologic RBE model proposed by Wilkens et al.[15], was used in this study, various RBE models have already been developed [16-19]. However, Patel et al., reported their RBE models show increasing discrepancy for higher LET
d values [20]. Since these cellular responses to proton beam irradiation have not been yet clearly modeled, it is necessary to improve the accuracy of existing RBE models or develop new models.
Conclusion
We evaluated biological dose differences between the conventional FRBE and the VRBE in the SFO and the MFO IMPT plans for three brain tumor patients. Doses obtained by the VRBE model for GTV and CTV were about 2% larger than those obtained by the FRBE model. On the other hand, doses obtained by the VRBE for OARs were somewhat larger than those obtained by the FRBE, and their dose differences depended on location of OARs. We also found that the differences in minimum dose for each OAR were larger than the differences in maximum and mean dose.
Acknowledgments
We thank Sarah Bronson from the Department of Scienti ic Publications at MD Anderson for editing the manuscript.
Confl icts of interest
The research described in this paper was supported by grant number U19 CA021239 from the National Cancer Institute, and Cancer Prevention and Research Institute of Texas (RP160232). The University of Texas MD Anderson Cancer Center is supported in part by the National Institutes of Health/National Cancer Institute through Cancer Center Support Grant P30CA016672.
References
1. Paganetti H. Relative biological effectiveness (RBE) values for proton beam therapy. Variations as a
function of biological endpoint, dose, and linear energy transfer. Phys Med Biol. 2014; 59: R419-R472.
Ref.: https://goo.gl/Yto1xP
2. Wedenberg M, Toma-Dasu I. Disregarding RBE variation in treatment plan comparison may lead to
bias in favor of proton plans. Med Phys. 2014; 41: 091706-9. Ref.:https://goo.gl/WrdexA
3. Paganetti H. Relating proton treatments to photon treatments via the relative biological
effectiveness-should we revise current clinical practice? Int J Radiat Oncol Biol Phys. 2015; 91: 892-894. Ref.:
https://goo.gl/zr4E8F
4. Chen Y, Grassberger C, Li J, Hong TS, Paganetti H. Impact of potentially variable RBE in liver proton
therapy. Phys Med Biol. 2018; 63: 195001. Ref.:https://goo.gl/BqtTS3
5. Pedroni E, Bacher R, Blattmann H, Bohringer T, Coray A, et al. The 200-MeV proton therapy project at
the Paul Scherrer Institute: conceptual design and practical realization. Med Phys. 1995; 22: 37-53.
Ref.:https://goo.gl/LvJ1cm
6. Gillin MT, Sahoo N, Bues M, Ciangaru G, Poenisch F, et al. Commissioning of the discrete spot scanning proton beam delivery system at The University of Texas M.D. Anderson Cancer Center,
Proton Therapy Center, Houston. Med Phys. 2010; 37: 154-163. Ref.:https://goo.gl/kPYDA7
7. Kohno R, Hotta K, Dohmae T, Matsuzaki T, Nishio T, et al. Development of continuous line scanning
system prototype for proton beam therapy. Int J Particle Ther. 4: 429-438. Ref.:https://goo.gl/mNkXqx
8. Kooy HM, Grassberger C. Intensity modulated proton therapy. Br J Radiol. 2015; 88: 20150195 Ref.:
https://goo.gl/74xAjC
9. Frese MC, Wilkens JJ, Huber PE, Jensen AD, Oelfke U, et al. Application of constant vs. variable
relative biological effectiveness in treatment planning of intensity-modulated proton therapy. Int J
Radiat Oncol Biol Phys. 2011; 79: 80-88. Ref.:https://goo.gl/Uzu8hS
10. Kohno R, Cao W, Yepes P, Bai X, Poenisch F, et al. Biological dose comparison between a Fixed RBE and a variable RBE in SFO and MFO IMPT with various multi-beams for brain cancer. IJMPCERO.
11. Yepes P, Randeniya S, Taddei PJ, Newhauser WD. A track repeating algorithm for fast Monte
Carlo dose calculations of proton radiotherapy. Nucl Technol. 2009; 168: 736-740. Ref.:
https://goo.gl/8MvBd5
12. Yepes P, Randeniya S, Taddei P J, Newhauser WD. Monte Carlo fast dose calculator for proton
radiotherapy: application to a voxelized geometry representing a patient with prostate cancer. Phys
Med Biol. 2009; 54: N21-N28. Ref.:https://goo.gl/FkxQb4
13. Yepes P, Eley JG, Liu A, Mirkovic D, Randeniya S, et al. Validation of a track repeating algorithm for
intensity modulated proton therapy: clinical cases study. Phys Med Biol 2016; 61: 2633-2645. Ref.:
https://goo.gl/Xf7qDy
14. Kohno R, Cao W, Yepes P, Bai X, Poenisch F, et al. Dose Comparison between Eclipse Dose Calculation and Fast Dose Calculator in Single- and Multi-Field Optimization Intensity-Modulated Proton Therapy
Plans with Various Multi-Beams for Brain Cancer. IJMPCERO 2017; 6: 421-432. Ref.:https://goo.gl/sijxvg
15. Wilkens JJ, Oelfke U. A phenomenological model for the relative biological effectiveness in
therapeutic proton beams. Phys Med Biol. 2004; 49: 2811-2825. Ref.:https://goo.gl/swW13K
16. Carabe-Fernandez A, Dale RG, Jones B. The incorporation of the concept of minimum RBE (RbEmin) into the linear-quadratic model and the potential for improved radiobiological analysis of high- LET
treatments. Int J Radiat Biol. 2007; 83: 27-39. Ref.:https://goo.gl/vo2tzR
17. Carabe-Fernandez A, Dale RG, Hopewell JW, Jones B, Paganetti H. Fractionation effects in particle
radiotherapy: implications for hypo-fractionation regimes. Phys Med Biol. 2010; 55: 5685-5700. Ref.:
https://goo.gl/rXpM7w
18. Wedenberg M, Lind BK, Hardemark B. A model for the relative biological effectiveness of protons:
the tissue specifi c parameter alpha/beta of photons is a predictor for the sensitivity to LET changes.
Acta Oncol. 2013; 52: 580-588. Ref.:https://goo.gl/2cWJDs
19. McNamara AL, Schuemann J, Paganetti H. A phenomenological relative biological effectiveness
(RBE) model for proton therapy based on all published in vitro cell survival data. Phys Med Biol. 2015;
60: 8399-8416. Ref.:https://goo.gl/xehj9s
20. Patel D, Bronk L, Guan F, Peeler CR, Brons S, et al. Optimization of Monte Carlo transport parameters and validation of a novel high throughput experimental setup to measure the biological effects of