INTRODUCTION
Roughness is seen as part of geometric devia-tions with a relatively small distance of irregular-ities. Material defects caused by accidental dam-age or material defects (pores, cracks), are to the surface roughness not included [2, 3, 11].
The importance of treatment quality of ma-chined surfaces is growing and requires greater demands. This is due to the fact , that the surface quality has a major impact on the functionality of the entire device [6]. Especially in the contact surfaces, the quality of roughness is crucial fac-tor. It also has a significant impact on the life and
reliability of operation of technical equipment. So it’s good to monitor surface roughness function-al areas and evfunction-aluate the measured parameters. Roughness arises as a result of the use of instru-ments and related parameters (micro-geometrical shape and size of roughness). Another reason for the roughness formation on the surface is making adjustments of the surface [5, 8, 9, 10].
The surface quality of parts is one of the conditions for their proper function, and signifi-cantly influences the component life. Roughness represents the amount of inequality from the ideal shape and arises as a result of research [2, 12]:
INFLUENCE AND OPTIMIZATION OF THE SETTING OF INPUT PARAMETERS
OF LASER PROFILOMETRY BY THE SURFACE MEASUREMENT
MANUFACTURED BY THE AWJ TECHNOLOGY
Gerhard Mitaľ1, Ivan Gajdoš2, Juraj Ružbarsky1, Tomasz Jachowicz3, Łukasz Majewski3
1 Faculty of Manufacturing Technology, Technical university of Košice, Department of technical system design and monitoring, Štúrova 31, 080 01 Prešov, Slovakia, e-mail: [email protected], [email protected] 2 Technical University of Košice, Faculty of Mechanical Engineering, Institute of Technologies and Management.
Mäsiarska 74, Košice 040 01, Slovak Republic, e-mail: [email protected]
3 Lublin University of Technology, Faculty of Mechanical Engineering, Department of Polymer Processing, 36 Nadbystrzycka Street, 20-618 Lublin, Poland, e-mail: [email protected], [email protected]
Research Journal
Volume 12, Issue 1, March 2018, pages 329–337
DOI: 10.12913/22998624/86474 Research Article
ABSTRACT
The publication deals with the measurement and evaluation of roughness parameters by means of laser profiling, and its main task is to determine the effect of selecting the internal gain adjustment (Gain mode) on measured roughness values of the surface treated by the water beam technology. The publication details the software, hardware, and other parts of the device designed to measure the roughness of different types of surfaces. It further describes the behavior of individual parts of the apparatus as a whole and methods of measuring the roughness of the surface along a defined profile section by means of the triangulation principle of laser profiling. The measured sam -ple was cut by a thick (rough) cut at pressure of 380 MPa. As an abrasive, the Austra-lian Grenade with the grain Mesh 50 was used.The experiment was carried out at the Faculty of Production Technologies in the Laboratory of Roughness Measurement at the Department of technical systems design and monitoring in Prešov. Measurement of surface roughness parameters was performed on an optical measuring system to control surface parameters and the contact roughness meter Mitutyo SJ400.
Keywords: AWJ, laser, measurement, roughness, profilometry, contactless, contact, method
files measured in the form of raw data can be exported in .csv format that is suitable for fur-ther processing experiments in readily available spreadsheet programs [4].
Transparent image processing and evaluation of experimental data facilitates video splitter Ma-trox TripleHead2Go Digital-Edition. It is a device for the distribution of one graphical output of the computer to three independent display output (in
• used instruments and related parameters (micro geometric shape and size of the irregularities)
• applied surface treatment (physical and me-chanical condition).
In the engineering industry material tends to be intensively stressed during the manufacturing process. During machining, parts of removed ma-terial thermally and tension stressed. Machining takes place in primary, secondary and tertiary de-formations. Due process in the tertiary area, on a work piece, just beneath the surface, hardness, tension and possibly structure can be changed. State of the work piece after the final finishing of components affects the properties of the final product. In dynamically stressed components such changes have a key influence on the proper-ties of their reliability and durability [1, 13].
MATERIALS AND METHODS
The laser profilometer (Fig. 2) consists of basic and supplementary parts. The basic part is the mechanical part (supporting frame compo-nents with vertical adjustment, the position of the measuring head and programmable specimen feed in axes X and Y), the optical portion (laser beam source, lens and camera with a CCD sen-sor) and the control portion (PC with operating and evaluation software). Complementary parts include divider picture calibrated with a pre-scribed roughness socket power strip with surge protection, battery backup power supply with overvoltage protection, external USB drive for data storage [4].
Optical system forms part of the AVT Mar-lin camera (Fig. 3) 131B and 23FM50SP Tam-ron 50 mm with a visible area of 22 mm x 7 mm. Automated shift portion in the Y axis is realized by means of stepping motors Stan 8MT160–300 (Fig. 4) in each axis, a length up to 300 mm. The system allows you to measure samples of up to 8 kilogram in the precision setting position of 2.5 micrometer to move. Taking each step consists of 8 microns. Resolution of the sensor is 0.02 mm / Pixel [4]. Using an experimental system can be measured and evaluated parameters of wavi-ness and roughwavi-ness of the samples according to EN ISO 4287 and EN ISO 11562 (Ra, Rz, Rq, Rv, Rp, Wa, Wz Wq, Wv, Wp). The results of the evaluation parameters of the profile or
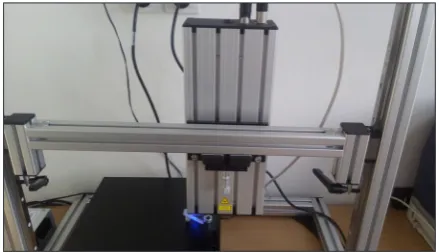
pro-Figure 1. Measuring using LPM
Figure 2. Laser profilometry workplace
combination with the use of further graphics out-put, and selecting the enlarged working area can be obtained from four independent images) such that each monitor is different from the desktop or the application, while graphics performance of computer is not reduced [4, 7].
The principle of measurement using LPM To view the image of the field captured by the camera of profimeter, AVT Smart View program is used (Fig. 5), which allows in combination with running shift shoot the video appearance of the
surface of the measured component. For effective imaging samples LPM system is also equipped with an integrated light. Light consists of four white LED lights. Illumination of the sample with a laser beam or LED light is selected on the mea-suring head of the system [4].
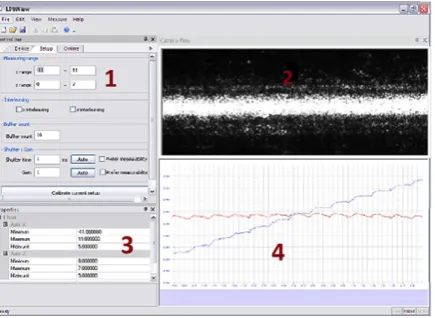
At position 2 (Fig. 5) there is a measurement of the profile window with a preview sample with visible laser line. The preview window is suitable for the construction of the image sensed as a re-sult of setting the image brightness less adapted to high intensity laser beam.
At position 4 (Fig. 5) it shows the current measured profile. Stacking a series of profiles of the measured system LPM allows a 3D model of the measured object, which is shown in Fig. 7. The model is also possible to stack the export pro-file in specialized programs working with spatial graphs such as MS Excel or Origin Microcal [4].
Software for observation of samples
Observation of the sample was used software LPM view (Fig. 6 and Fig. 7). To view the image of the field captured by the camera of profimeter, AVT Smart View program is used (Fig. 5), which allows in combination with running shift shoot the video appearance of the surface of the measured component. For effective imaging samples LPM system is also equipped with an integrated light. Light consists of four white LED lights. Illumina-tion of the sample with a laser beam or LED light is selected on the measuring head of the system.
Measurement methodology using LPM Important steps prior to measurement [4]: 1. Set the engine to the starting position (axis X, Y) 2. Sharpen CCD camera. Turn on the laser and
start a live camera mode. Using a micrometer feed sample set so that the laser line is in the camera image. The camera is out of focus when the laser line is visible along the length of a camera view and is located in the lower part.
Figure 4. Stepping motors Stan 8MT160–300 at-tached to the frame of the device
Figure 5. Software LPM View (1-box setup and run a profilometer evaluation, 2-window real image of the scanned camera, 3-graph window displayed data,
4-captured data)
Table 4. Materials measurable by LPM system
Metals (as measured glossy metal surfaces must be individually assessed options of laser profilometer for a particular application, if necessary, there are methods of coating material, such as application of the spray to a measured surface, which is used to test the crack or the other a glossy surface smoke with candles)
Stone, ceramics, Plastics, Rubber,
3. Set Shutter Time the camera. Length of the exposure period is important to the scanning, but in terms of obtaining a higher quality sig-nal to the measurement profile. Due to the variety of scanned materials and surfaces can be re-experiment by changing the exposure time and confronting quality profile by using the tool live profile. The ideal profile would be the least noisy (still without fluctuations in value), the ideal laser line, the live image from the camera should be as continuous as well as the closest possible.
Place and conditions for carrying out of experiment
The experiment was realized on Faculty of Manufacturing Technologies in the Roughness Measurement Laboratory at the Department of technical system design and monitoring in Prešov. Measurement of the surface roughness parameters was performed on the optical measur-ing system intended for the surface parameters control and on a contact grinder Mitutoyo SJ400.
The LPM system uses laser profilometry based on triangulation principle. When this using
this principle, laser line is projected on measured surface at an angle , which is then captured us-ing a digital camera placed perpendicular to the scanned surface (Fig. 8).
Software equipment Base programs:
• Operating System Microsoft Windows 7,
• MS Office (for data export to Excel). Utilities:
• LPMView – used for communication with the laser profilemeter,
• AVT SmartView – camera preview and creat-ing graphicall documentation,
• Test feed – management and testing XY displacement,
• Microsoft Excel – graphical processing of ex-ported data.
Roughness test Mitutoyo SJ400
The reference surface roughness measure-ment was performed on the surftest Mitutoyo SJ 400 (Fig. 9) to define the surface character. It is a portable measuring device that allows simple, fast and accurate measurement of surface rough-ness. The technical parameters of this device are shown in Table 2.
For a more accurate assessment of the total roughness of the area of the measured surface, we determined three surface measurement locations, which are shown in Fig. 10. Each location was re-peatedly measured 10 times. From individual mea-surements we created arithmetic averages for Ra and Rz values and averages of created averages.
Figure 7. Camera preview of measured sample
Conditions for carrying out the experiment Material made of hard plastic was used to measure the surface quality. The sample was cut at 600 mm/min. A comparison of contact and non-contact methods is shown in Figure 11. The area was first measured by contact measurement using Mitutoyo SJ 400 measuring device, mea-sured at three surface locations according to fig. 10. Each location has been measured ten times, from which we obtained 30 values for Ra and 30 values for Rz at three different surface loca-tions. These measured values were processed into a table format. From these data we calculated the arithmetic average of individual measure-ments for Ra1, Ra2, Ra3 and Rz1, Rz2, Rz3. From the arithmetic averages, the average of averages was calculated, which is actually the value cor-responding to the total calculated roughness of the measured area. This value is considered to be a reference value of the surface that corresponds
to one of the gain mode values measured on the contactless LPM surface test by which the surface roughness was generated using the software that is part of the LPM and is described in detail in the previous chapters.
THE MEASURED VALUES
In the present experimental part of this study, a surface water quality analysis of the wa-ter stream technology is performed to compare roughness parameters, depending on the change of the software parameter of the internal video signal gain in the camera (Gain mode).
When evaluating the surface roughness, the parameters Ra – mean arithmetic deviation of the evaluated profile, Rz – the highest height of the unevenness of the profile, were monitored for both methods of measurement. The roughness of the surface was measured at three levels and
fif-Table 2. Technical parameters Mitutoyo SJ400
Measurement speed 0.05; 0.1; 0.5; 1.0 mm.s-¹
Speed of return 0.5; 1.0; 2.0 mm.s-¹
Measuring direction backward
Positioning ± 1.5 ° (inclination), 10 mm (up/down)
Measurement range /
resolution 800/0.01 µm; 80/0.001 µm
Power type network adapter
Evaluated parameters P(primary), R (roughness), W (filtered waviness)
Digital filter 2CR, PC75, Gauss Cutoff length 0.08; 0.25; 1.8; 2.5; 8 mm
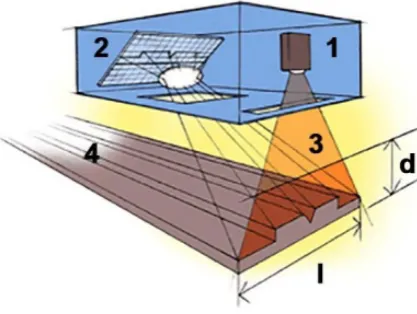
Figure 8. Schemes to measure the LPM. 1- CCD camera, 2-laser light source, 3-laser light on the sur-face, 4-measured sursur-face, C operating range profilom
-eter, d-working distance, l- measuring range
teen steps by the laser profilemeter and at three levels by the contact surface test for the speed and the parameters with which the sample was cut. Measured roughness values for LPM measure-ment are in Table 5. From these values arithmetic average of roughness values was generated. The
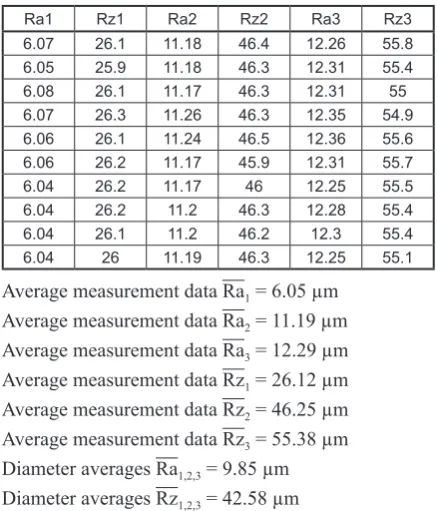
measured surface roughness values were veri-fied by the Mitutoyo SJ400 contact grinder and are shown in Table 3. One location was mea-sured 10 times. From these values the arithmetic averages from which the total roughness of the measured surface has been determined, has been calculated, and its value is Ra1,2,3 = 9,85 μm and Rz1,2,3 = 42,58 μm. These values are considered to be the true real roughness of the measured sur-face that was used to compare and evaluate the measurement by LPM.
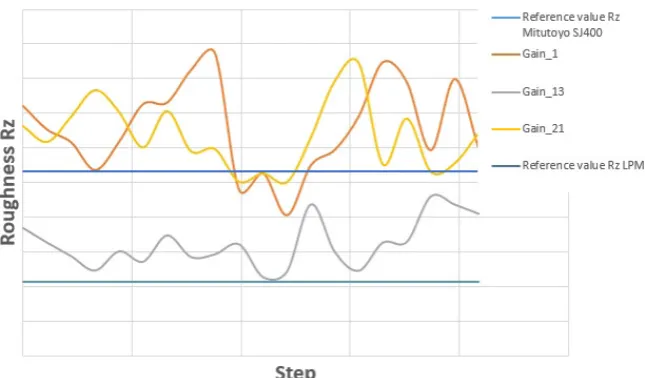
The graph presented on Fig. 12 and graph pre-sented on Fig. 13 shows large variations in val-ues compared to the contact method. The graph of the measured values Ra is shown on Fig. 12. The graph of the measured values Rz is shown on Fig. 13. If the measured values are compared to the values measured by the non-contact method, the value pool is not so large. The scattering of the values at some points is due to the reflection of light on the surface of the sample being mea-sured. The closest to the reference values was Gain 1 again. It is confirmed by the fact that such a surface type, when measured by LPM, requires that the Gain 1 value is set to the lowest value for the accuracy of the measurement.
MEASUREMENT RESULTS
The aim of this study was to evaluate the sur-face machined by AWJ using a laser profilemeter, which was built from components available on the market. The experiment was conducted at the department of technical systems design and mon-itoring. The sample was made with an estimated surface roughness of 12.5 microns. The measured data were effected also by the material itself, from which the sample is made. It is a polycarbonate that is extremely high impact resistant. It has high strength, hardness and stability high optical
qual-Table 4. Experiment conditions
Pressure 380 MPa
Cutting speed 600 mm.min-1.
Type of Abrasive Australian Garnet
Abrasive Grain MESH 50
Abrasive flow 230 g
Diameter of the water nozzle 0.25 mm Diameter of the guide tube 1.12 mm Length of guiding tube 76 mm
Figure 11. Contact and non-contact measured methods
Table 3. Measured values by the Mitutoyo SJ400
Ra1 Rz1 Ra2 Rz2 Ra3 Rz3
6.07 26.1 11.18 46.4 12.26 55.8 6.05 25.9 11.18 46.3 12.31 55.4 6.08 26.1 11.17 46.3 12.31 55 6.07 26.3 11.26 46.3 12.35 54.9 6.06 26.1 11.24 46.5 12.36 55.6 6.06 26.2 11.17 45.9 12.31 55.7 6.04 26.2 11.17 46 12.25 55.5 6.04 26.2 11.2 46.3 12.28 55.4 6.04 26.1 11.2 46.2 12.3 55.4 6.04 26 11.19 46.3 12.25 55.1 Average measurement data Ra1 = 6.05 µm
ity and good electrical insulation properties. High resistance to weather conditions and solar radia-tion, very good light transmission, which, in con-junction with the cut, caused a small reflection of laser light to the CCD camera, and in some mea-surement steps the values were very high.
Surface roughness was measured in 15 steps with a step size of 0.11 μm in three Gain mode levels. By evaluating of the surface, three surface locations were measured by the contact method. Each location was measured ten times and av-erage was calculated. The most suitable mode with the clearest view in the dialog window of the sample, where the measured values were the most accurate to the values measured by the con-tact method, was Gain 1 mode and shutdown time
of 85,586 ms, which was the same for all Gain modes. The arithmetic average of the resulting roughness was calculated from the measured val-ues. The measured surface roughness values of the sample measured by LPM are shown in Table 2.
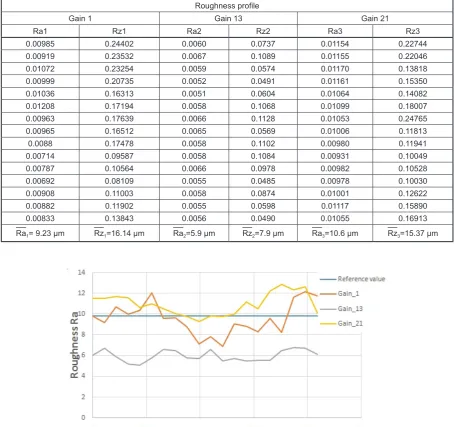
To determine the suitability of setting the pro-file parameters with respect to the type and char-acter of the measured surface, measurements were made at three levels of the profilemeter : modes Gain 1, Gain 13, and Gain 21. By comparing the measured results, it is possible to determine which of the Gain modes is the most appropriate for the material type. Figure 14 shows the dependence of measured surface roughness on three Gain mode levels on actual surface roughness. Table 5 shows the measured values for the arithmetic mean
de-Table 5. Measured values by the LPM
Roughness profile
Gain 1 Gain 13 Gain 21
Ra1 Rz1 Ra2 Rz2 Ra3 Rz3
0.00985 0.24402 0.0060 0.0737 0.01154 0.22744
0.00919 0.23532 0.0067 0.1089 0.01155 0.22046
0.01072 0.23254 0.0059 0.0574 0.01170 0.13818
0.00999 0.20735 0.0052 0.0491 0.01161 0.15350
0.01036 0.16313 0.0051 0.0604 0.01064 0.14082
0.01208 0.17194 0.0058 0.1068 0.01099 0.18007
0.00963 0.17639 0.0066 0.1128 0.01053 0.24765
0.00965 0.16512 0.0065 0.0569 0.01006 0.11813
0.0088 0.17478 0.0058 0.1102 0.00980 0.11941
0.00714 0.09587 0.0058 0.1084 0.00931 0.10049
0.00787 0.10564 0.0066 0.0978 0.00982 0.10528
0.00692 0.08109 0.0055 0.0485 0.00978 0.10030
0.00908 0.11003 0.0058 0.0874 0.01001 0.12622
0.00882 0.11902 0.0055 0.0598 0.01117 0.15890
0.00833 0.13843 0.0056 0.0490 0.01055 0.16913
Ra1= 9.23 µm Rz1=16.14 µm Ra2=5.9 µm Rz2=7.9 µm Ra3=10.6 µm Rz3=15.37 µm
viation Ra measured by the laser profilemeter. By comparing the measured values, we found dif-ferences in all Gain modes. However, in Gain 1, roughness values were the closest to the values measured by the Mitutoyo SJ400 contact surface test. The surface roughness value measured by the contact method was 9.85μm.
When measured by Gain 1, the average roughness value was 9.23 μm, and by using Gain 21 average roughness was 10.6 μm. The larg-est deviation of the measured values occurred in Gain 13 with an average roughness deviation of 3.33 μm and in Gain 21 with an average devia-tion of 4.7 μm. The smallest deviadevia-tion occurred in Gain 1 mode, which means that for this type of measured surface, it is optimal to set the internal display gain in the camera (Gain mode) to level 1 of the mode range.
A significant variation in the height of profile inequalities (Rz) compared to the measured val-ues by the contact method was made in all three measurements, but the smallest deviation was recorded in the first Gain 1 mode, which again confirms that it is the most suitable mode for this type of surface with the smallest deviation of val-ues. The higher the Gain mode, the higher the im-age intensity, but on the other hand, the noise in the picture increases, and so does the noise of the measured data, as seen in these measurements. For this type of surface, it is recommended to use the lowest mode value of 1.
Slight deformation of the measured values was caused by the refraction of laser light on the surface and its reflection on the CCD camera. This resulted jumps in measured data and influ-enced the overall range of values. It is clear from
the measurement evaluation that the accuracy of the Gain mode has a significant impact on the measured data quality.
CONCLUSIONS
Surface roughness is a characteristics that af-fects the durability and reliability of components, energy loss, wear resistance, tribological proper-ties, etc. In terms of machining technology of ma-chine parts, surface roughness is one of the stan-dard criteria for assessing their quality. Surface roughness significantly influences the course of physical and chemical phenomena in the opera-tion parts, fricopera-tion, sealing efficiency, operaopera-tional reliability, durability and economy of devices.
According to the specifications of the standard ISO 4287 and EN ISO 11562 software LPM View in cooperation with a laser profilometer allows to perform a comprehensive assessment of the ma-chined surface. As we found out in this practical measurements, also our laser profilometer allows comprehensively evaluate the measured surface. However, it is necessary to define the use of the operating mode Gain by different types of sur-faces which will be the subject of further research and development.
Using a contactless system designed to mea-sure geometric surface characteristics at the de-partment of technicalsystems design and moni-toring, we are able to measure a wide range of soft and hard surface types, which is the main advantage of the device. The measurement is lim-ited by the size and weight of the sample, which can be up to 8 kilograms. Therefore, as part of
research and development system for the con-tactless measurement and evaluation of surface roughness are trying the topic of surface rough-ness measurement to expand and improve this fa-cility. The advantage of the proposed system is in particular the speed of measurement and process-ing of measured values, another advantage is the amount of geometric characteristics of roughness and waviness of the surface that the instrument can measure and evaluate. They are Rp, Rv, Rz, Ra, Rq and Wp, Wv, Wz, Wa, Wq. Disadvantage is the geometry of the measured surface, which must be satisfactory, and that is, the shape of the measured object may not be very curved or oval. Non-contact system for measuring the roughness at the Department of technical system design and monitoring is not able to measure all the objects and parts, but is merely an extension and im-provement of methods for measuring the rough-ness of machined surfaces.
Acknowledgements
This paper has been done when solving the grant KEGA 006TUKE-4/2017
REFERENCES
1. Gerková, Jana,: Experimental verification of the effect the welding speed on the work piece surface quality technology AWJ. Prešov, 2015 (in Slovak). 2. Hloch, S., Valíček, J. Vplyv faktorov na topografiu
povrchov vytvořených hydroabrazívnym delením. Prešov: FVT Technická univerzita, 2008, ISBN 978–80–553–0091–7.
3. ISO 16610–21,: Geometrical product specifica -tions (GPS), 2011.
4. LPMView. 2015,: User Guide – Kvant Ltd. Prešov, FVT TUKE, pp. 44. (in Slovak).
5. Kamieńska-Krzowska B., Kłonica M.: The role of surface topography measurement strategy on the evaluation of selected roughness parameters. Mechanik 2014, 8-9, 138-145.
6. Kuczko W., Wichniarek R., Górski F., Bun P. Ap-plication Of Additively Manufactured Polymer Composite Prototypes In Foundry. Advances In Science And Technology-Research Journal, 2015, 9, 26, 20-27.
7. Mitaľ G., Ružbarsky J,: Methodology non-contact measurement and evaluation roughness machined surfaces using laser profilometry. 2016. Prešov (Slovak).
8. Panda, A., Prislupčák, M., Pandová, I,: Progressive technology diagnostic and factors affecting to ma -chinability. In: Applied Mechanics and Materials 2014, 616, 183–190.
9. Prislupčá, M., Panda, A., Jančík, M., Pandová, I., Orendáč, P., Krenický, T.: Diagnostic and experimen -tal valuation on progressive machining unit. Applied Mechanics and Materials 2014, 616, 191–199. 10. Raja, J., Muralikrishnan, B., Shengyu, F,: Recent
advances in separation of roughness, waviness and form. Precision Engineering. of the International Societies for Precision Engineering and Nanotech-nology 2002, 26, 2, 222-235.
11. STN EN ISO 11562,: Geometrical product specifi -cations – GPS. 1996 (in Slovak).
12. Valíček, J., Hloch, S., Dražan,: 2009. Study of surface topography created by abrasive waterjet cutting. Sla-vonski Brod , Strojarski fakultet 2009, p. 101. 13. Šustek J.: Laserový profilometer LPM s horizon