Effect of scatter coincidences, partial volume, positron range and
non-colinearity on the quantification of FDOPA Patlak analysis
Pablo Aguiar1, Charalampos Tsoumpas2, Albert Cot3,4, Javier Pavía4,5, Domènec Ros3,4
1
GCA Imagen Molecular (IDIS), Fundación IDICHUS, Santiago de Compostela, Galicia, Spain
2
MRC Clinical Sciences Centre, Imperial College London, United Kingdom
3
Unitat Biofísica, Departament de Ciències Fisiològiques I, Universitat de Barcelona, Spain
4
CIBER en Bioingeniería, Biomateriales y Nanomedicina (CIBER-BBN), Spain
5
Servei de Medicina Nuclear, Hospital Clínic de Barcelona, Spain
(Received 1 September 2012, Revised 18 September 2012, Accepted 20 September 2012)
ABSTRACT
Introduction: The key characteristics of positron emission tomography (PET) are its quantitative capability and its sensitivity, which allow the in vivo imaging of biochemical interactions with small amounts of tracer concentrations. Therefore, accurate quantification is important. However, it can be sensitive to several physical factors. The aim of this investigation is the assessment of the effect of physical effects, such as: scatter coincidences, partial volume, positron range and non-colinearity on the quantification of FDOPA uptake using PET.
Methods: The SimSET Monte Carlo package was employed to simulate acquisitions of the PET/CT Siemens Biograph scanner. The study was performed with a numerical brain model obtained from the CT scan of a commercial striatal phantom. Theoretical pharmacokinetic values were simulated. The simulations were carried out with and without scatter, positron range and non-colinearity effects. The OSEM algorithm from STIR library was used to reconstruct the PET data. Different correction strategies were employed in order to evaluate the effects caused by the different type of degradation on results obtained with Patlak analysis.
Results: The FDOPA uptake of Patlak plot increased from 70.4% of the theoretical value to 80.4%, if scatter was perfectly corrected, and it increased to 99% of the theoretical value when the partial volume correction was employed, as well. No significant improvement was found for positron range and non-colinearity effects when the partial volume correction was employed.
Conclusions: The results show that the compensation for scatter and partial volume degradations increases accuracy in the uptake calculation.
Key words: PET, Reconstruction, Kinetic analysis, Monte Carlo simulation.
Iran J Nucl Med 2012;20(1):11-18
Corresponding author: Charalampos Tsoumpas, The Rayne Institute, 4th floor Lambeth Wing, Division of Imaging
Sciences, St. Thomas' Hospital, Westminster Bridge Rd, London, SE1 7EH, United Kingdom, E-mail: [email protected]
O
r
ig
in
a
l
A
r
ti
c
Ir
a
n
J
N
u
c
l
M
e
d
2
0
1
2
,
V
o
l
2
0
,
N
o
1
(
S
e
ri
a
l
N
o
3
7
)
12
INTRODUCTIONPositron Emission Tomography (PET) facilitates the diagnosis of a disease state at an early point and the monitoring of its evolution, yielding important biological insights, informing the development and evaluation of therapies. This is usually achieved with dynamic PET imaging which involves a time-sequence of acquisitions called frames. Each frame is independently reconstructed into separate images. Compartmental models are then applied to the time radioactivity images of either anatomical regions or individual voxels in order to estimate physiological parameters. This information contains the kinetic constants of the biochemical process, which relate the total temporal concentration of the radiotracer and the input function. The kinetic constants are usually estimated by fitting the model to the time-course of the images.
For example, FDOPA (6-[18F]Fluoro-L-dopa) and 11
C-raclopride studies in dynamic PET are used to study the presynaptic dopamine function and reveal the status of the dopaminergic nigrostriatal pathway both at presynaptic and postsynaptic level [1]. In particular, FDOPA is an exogenous substrate of dopa-decarboxylase that is the immediate precursor of dopamine [2, 3]. The FDOPA uptake has also been found to decrease in patients with Parkinson's disease. Thus, FDOPA studies are mainly used in the examination of patients affected by Parkinson’s disease [4]. The use of kinetic models instead of a static analysis provides a better objective marker of Parkinsonism or other relevant diseases [5]. The kinetic information in the FDOPA studies can be measured with a two-tissue three-compartments model, so that the total measured radioactivity can be subdivided into reversible compartments (i.e. tracer molecules are freely exchanged between tissue and plasma) and irreversible (i.e. tracer molecules are trapped in these compartments). If the tissue with reversible kinetic behaviour of the tracer is in steady state, the overall uptake constant of FDOPA from plasma to the irreversible compartment can be estimated as the slope of a linear regression. This linear model is called Patlak plot [6].
One problem associated with quantitative PET analysis is that accurate quantification depends on several factors. There are many technical and physical factors to be considered in this analysis, which result in inexact data. Several papers have investigated the effect of these physical factors on PET FDG studies. In regard to the coincidence detection process random coincidences can occur when two or more photons from different annihilation events are detected within the same time window. This effect is addressed by estimating the random coincidences and then considering them in the reconstruction. The rate of random coincidences
is proportional to the singles rate and the coincidence time window [7]. On the other hand, there are effects related to the photon interactions in human tissue such as the attenuation effect. This effect is due to the loss of true coincidence events (photon absorption or scattering) and is addressed through the use of density maps from the current PET/CT scanners [8]. Some of these physical effects have been also evaluated in dynamic FDG PET studies, such as the reconstruction method [9, 10] and scatter and randoms contribution [11, 12]. It is also essential to note several temporal frames are normally necessary for kinetic analysis, but most of the frames have low number of counts and consequently poor signal to noise ratio [Author et al 2011, 13]. In this context, another paper has evaluated several parameter estimation methods (including the Patlak plot) that are necessary for the determination of the cerebral metabolic rate of individual kinetic rate constant parameters [14]. The correction for other physical effects such as positron-range and non-colinearity is not part of the reconstruction process and consequently may affect the accuracy of the clinical studies. An attempt to inherently include such effects is the recent emerging resolution modelling (PSF) method, which is currently an active research area. Effects such as the partial volume are related to the limited spatial resolution of the imaging system [15]. In general, these effects cause erroneous estimation of the radioactivity in each volume of interest and potentially affect the estimation of the pharmacokinetic parameters [16, 17]. Most of literature has investigated the effect of different reconstruction strategies and physical factors on static FDG analyses, and only few on dynamic FDG. Furthermore, the kinetic parameters may be affected in a different way than the static quantification of linear models. Moreover, to the best of our knowledge, there are no papers aimed that investigate the influence of reconstruction strategies and physical effects in the kinetic analysis of dynamic FDOPA PET studies.
The aim of this work is the assessment of the physical effects of scattered coincidences [18], partial volume effect [19], positron range and non-colinearity [20, 21] on the quantification of striatum and reversible compartment in FDOPA studies and consequently their impact on the physiological parameters estimated by the Patlak plot. Once the influence of each effect is classified, our work aims to test a new procedure for carrying out more reliable quantification studies.
Ir
a
n
J
N
u
c
l
M
e
d
2
0
1
2
,
V
o
l
2
0
,
N
o
1
(
S
e
ri
a
l
N
o
3
7
)
13
example was the comparison of the performance ofseveral commercial scanners [22]. In our investigation we used the SimSET Monte Carlo package [23].
Theory
Compartment model
A two-tissue three-compartments model for FDOPA is described and the theoretical concentration variations along time within each brain region are obtained analytically in order to simulate a dynamic FDOPA study. The mean radioactivity concentrations within the striatum and the other regions are obtained from reconstructed images and the overall uptake constant of FDOPA is estimated by linear regression. In the two-tissue three-compartments model [24] shown in Figure 1, it is assumed that the system can be subdivided into reversible and irreversible chemical compartments. The input function is assumed to be the arterial plasma time activity curve (TAC), which is usually measured during a human brain study. If CT(Irr)(t) and CT(Rev)(t) are the
concentrations of the labelled compounds in the irreversible and reversible compartments, CT(t) is the
total radioactivity in the tissue and CP(t) is the plasma
time radioactivity curve [25], the corresponding radioactivity of each compartment will be:
C
T(Irr)
=
K
1k
3(
k
2+
k
3)
*
C
P (Eq. 1)C
T(Rev)=
K
1k
2k
2+
k
3e
-(k2+k3)t
*
C
P
(Eq. 2)
The symbol * denotes the mathematical convolution operation.
Fig 1. Two-tissue three-compartments model.
The Patlak Model
The Patlak approach can describe the behaviour of the FDOPA model when the free radiotracer in tissue has reached a steady state. This approach is valid only at sufficiently late time points, for example 50
min following the bolus passage of the tracer. Thus, the original model is simplified and CT(t) can be
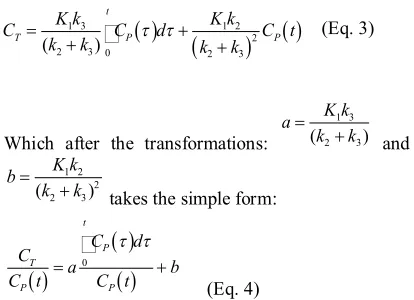
obtained in good approximation by the following linear equation:
(Eq. 3)
Which after the transformations:
a= K1k3 (k2+k3) and
b= K1k2
(k2+k3) 2
takes the simple form:
CT CP
( )
t=a CP
( )
t0
t dt
CP
( )
t+b
(Eq. 4)
This is known as the Patlak Plot which allows the estimation of the parameters a and b using linear regression. The parameter a represents the overall uptake constant of FDOPA from the plasma to the striatum and it is the main parameter of interest. The parameter b represents the free FDOPA fraction in tissue and blood.
Partial volume correction method
The size of the volumes of interest, if particularly small as the caudate and the putamen, has a direct impact on the measurement of the radioactivity concentration. Thus, correction for PVE is very useful in order to obtain accurate quantification of small regions as the striatum [19].
An approach to correcting the PVE in neuroreceptor imaging has been described by different groups [26, 27]. We modified the Fleming method to obtain the total striatum uptake. The methodology is based on the measurement of the total radioactivity in the striatum and the calculation of the exact volume of interest for each region. The total radioactivity in the striatum was calculated by using expanded regions of interest (ROIs) which are large enough to include the entire radioactivity that has spread outside the physical volume of the structures due to the PVE. The extension of the expanded ROIs is related to the spatial resolution of the PET system.
Thus, the expanded ROIs were obtained from the original ROIs after convolution with a Gaussian function of full-width at half maximum (FWHM) equal to the crystal size of the scanner (4 mm). The original ROIs of the striata and other regions were defined by using a CT image of the anthropomorphic striatal brain phantom. Thus, the exact volumes of the ROIs were calculated. In CT =
K1k3
(k2+k3)
CP
( )
t0
t
dt+ K1k2
Ir
a
n
J
N
u
c
l
M
e
d
2
0
1
2
,
V
o
l
2
0
,
N
o
1
(
S
e
ri
a
l
N
o
3
7
)
14
clinical studies, the striata regions could be obtainedby segmenting MR images and then registered them with PET images. To quantify the studies, all reconstructed images were resampled to the high-resolution space that the ROIs were defined.
Compensation for the PVE was carried out by expansion of the original striatum and then calculation of the mean radioactivity concentration within this expanded region. Then, the radioactivity concentration inside the original striatum (CStr) was
calculated by subtracting the non-striatum region (i.e. reversible component) from the total radioactivity in the expanded region:
(
)
(
Str Str)
Strm n Str
m
V
-
V
-
V
V
' Str ' Str'
Str
=
C
C
C
(Eq. 5)m
C
Str'and CnStr
m
are respectively, the mean radioactivity concentrations within the expanded striatum and the non-striatum regions; VStr and VStr'
are the volumes of the original and the expanded striatum, respectively.
The concentrations of the labelled compounds in the irreversible (CT(Irr)) and the reversible compartments
(CT(Rev)) were obtained from these concentrations
( CT(Rev)(t) = CnStr(t) and CT(Irr)(t) = CStr(t) - CnStr(t) )
and the Patlak plot was then used to calculate the parameters of interest: a, b.
METHODS
Numerical phantom
A numerical phantom was obtained from a CT scan of the anthropomorphic striatal brain phantom (Radiological Support Devices Inc., Long Beach, CA, USA). The CT image consisted of 256×256×196 voxels with size of 0.89×0.89×0.89 mm3. Brain tissue and bone were automatically segmented by thresholding the CT image while the striatum was manually defined.
The non-uniform attenuation map was obtained by setting the appropriate attenuation coefficients to brain and bone for 511 keV (i.e. 0.096 cm2/g for water and 0.197 cm2/g for bone).
Radioactivity distribution maps were separated into two different components: the striatum and the non-striatum (also called background) radioactivity distribution maps. Figure 2 shows a central slice of the background radioactivity distribution (left-hand side), the striatum radioactivity distribution (middle) and the non-uniform attenuation map (right-hand side).
Fig 2. Striatal phantom: non-striatum background radioactivity distribution (left), striatum radioactivity distribution (centre) and the non-uniform attenuation map (right).
Monte Carlo simulation
The SimSET Monte Carlo package [23] was employed to simulate fully 3D acquisitions of the PET/CT Siemens Biograph scanner (the source code library can be downloaded from: http://depts.washington.edu/simset/html/simset_main. html). As a consequence, 1024 direct and indirect sinograms with 288 transaxial bins (bin size of 2.2
mm) and 288 angular positions were obtained. Simulations were carried out with or without positron range and non-colinearity effects. True and scatter coincidences were stored separately so that an ideal scatter correction (ISC) could be performed. Sinograms of non-striatum background and striatum radioactivity were generated separately. These simulations were carried out in such a way that noise was 100 times less than what is normally obtained from a real acquisition. Thus, these simulations can be regarded as approximately noise-less, providing the advantage to assess the physical effects without introducing large statistical errors.
The protocol consists of scans over a 90 min period divided into 26 frames: 1 of 40 s, 4 of 60 s, 3 of 120
s, 3 of 180 s and 15 of 300 s, as it is a standard optimized FDOPA protocol [28]. The simulation was carried out for the last 8 frames that are used in the Patlak model. Both the non-striatum and striatum simulations were multiplied by the appropriate factor and then Poisson noise was added in order to mimic the number of counts collected per frame. Then, striatum sinograms were subsequently added to the background sinograms. Once the simulation process was completed, three different sets for each of the last eight time frames were generated containing: total coincidences, trues coincidences (ISC) and trues coincidences without positron-range and non-colinearity effects (ISC + IPRC + INCC).
Reconstruction
Ir
a
n
J
N
u
c
l
M
e
d
2
0
1
2
,
V
o
l
2
0
,
N
o
1
(
S
e
ri
a
l
N
o
3
7
)
15
all images employed in the Patlak plot analysis werereconstructed using adequate number of iterations. This optimal number of iterations is usually object-dependent and convergence does not necessarily occur at the same iteration. The appropriate number of sub-iterations was determined by comparing the
CStr and CnStr values obtained at consecutive iterations
as shown in Eq. 6:
d
=
C
Str-
C
nStrC
nStr (Eq. 6)For the evaluation of the effect of physical degradations we employed the following correction strategies:
OSEM3D: reconstruction of sinograms containing total coincidences (i.e. uncorrected data).
OSEM3D+ISC: reconstruction of sinograms containing unscattered coincidences, equivalent to an ideal scatter correction (ISC).
OSEM3D+ISC+PVEC: reconstruction of sinograms containing unscattered coincidences and including a partial volume effect correction (PVEC).
OSEM3D+ISC+IPRC+INCC+PVEC:
reconstruction of sinograms containing unscattered coincidences, including PVEC and without positron range and non-colinearity effects. The same PVEC method was used with and without PR and NC (i.e. ideal PR correction, IPRC and ideal NC correction, INCC) in order to evaluate how the PVEC affects the quantitative values.
RESULTS
Time activity curves (TACs)
Firstly, the theoretical TACs were obtained to assign the radioactivity distribution of the numerical phantom used for the simulation. These theoretical TACs describe the FDOPA concentration variation versus time within each brain region and they are derived analytically using kinetic constants from literature (K1 = 0.0403 ml/min/ml, k2 = 0.0342 min
-1
and k3 = 0.0124 min-1 [31] that correspond to the
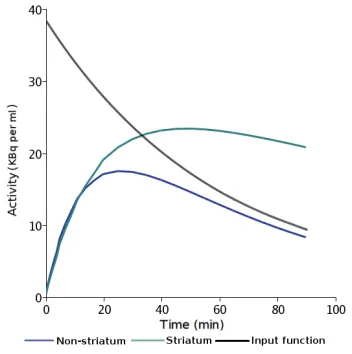
Patlak slope a = 4.965×10⁻⁸ min-1 and intercept b = 0.635). The input function was analytically derived as the sum of three exponentials, as proposed by Yu et al [32]. The theoretical TACs, displayed in Figure 3, represent the background and striatum radioactivity distribution of the numerical phantom which is used for the simulation. The radioactivity concentration in striatum is obtained by adding the concentrations of
the reversible and irreversible compartments (CStr(t)
= CT(Rev)(t) + CT(Irr)(t)), while the radio-activity
concentration in non-striatum corresponds to the reversible compartment ( CnStr(t) = CT
(Rev)
(t) ). The reversible compartment is in steady state of the final eight frames, which correspond to the last 40 min of the scanning and approximately 50 min after the radiotracer administration. The background radioactivity in the blood volume (i.e. approximately 3-5%) was not considered in this simulation setup. This approximation is not applicable to the radioactivity in the plasma as it is part of the kinetic analysis.
Fig 3. TACs (non-striatum and striatum activities) and the input function measured from the human brain study.
Number of iterations
Once carried out the simulations, the number of iterations for the reconstruction was calculated in order to ensure convergence. Figure 4 shows
δCStr/CnStr as a function of the number of iteration.
These values were obtained from the reconstructed images by means of OSEM3D (4 subsets) and the results show that after several iterations convergence was achieved, which is important for accurate quantification [Author et al, 2008]. For this reason, all images employed in the Patlak plot analysis [33] were reconstructed using 60 iterations and 4 subsets.
Reconstruction and quantification
Ir
a
n
J
N
u
c
l
M
e
d
2
0
1
2
,
V
o
l
2
0
,
N
o
1
(
S
e
ri
a
l
N
o
3
7
)
16
Fig 4. Relative difference between CStr and CnStr obtained with OSEM (4 subsets) at consecutive sub-iterations.
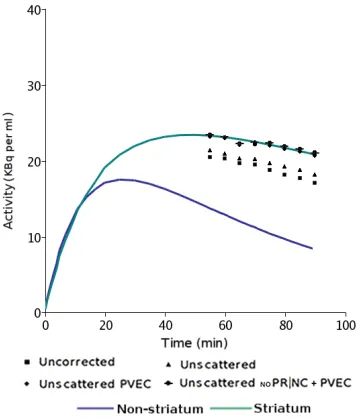
Fig 5. Theoretical TACs for striatum (light green curve) and reversible region (dark blue curve) and calculated FDOPA striatum uptake for uncorrected; unscattered; unscattered with PR and NC effects and PVEC; and unscattered, but without PR and NC effects, including PVEC.
with PVEC) and OSEM3D + ISC + IPRC + INCC + PVEC (i.e. unscattered without PR and NC effects and with PVEC). No differences between the correction strategies in the reversible region (CnStr)
were found and the calculated radioactivity levels were close to the theoretical values. This can be explained by the fact that the reversible region is much larger than the irreversible region.
Thus, even if some radioactivity concentration has migrated to another voxels due to partial volume effect, positron range, non-colinearity and scatter, the overall activity of the large reversible region is not affected. Nevertheless, both OSEM3D and OSEM3D
+ ISC clearly yield under-estimations of the radioactivity (CStr) in striatum TACs. PVEC
recovered the value when the PR and NC effects were included in the simulation but there was about 4% bias observed when these effects were not included in the simulation. This result indicates that the specific FWHM used for the PVEC accounted also for PR and NC effects.
Figure 6 shows the relative differences of the radioactivity level between the calculated TACs and the theoretical TACs for the striatum region. This graph points out that the reconstruction from the uncorrected data provided values that underestimated the theoretical radio-activity levels by about 12% to 21%, whereas the reconstructed images from the unscattered data were underestimated by 8% to 18%.
Fig 6. Relative difference of the radioactivity level between the calculated and the theoretical TACs for the striatum.
Patlak analysis
Table 1 shows the FDOPA kinetic parameters obtained by means of different correction strategies and the results are compared with the theoretical values. It is shown that the slope (i.e. uptake constant of FDOPA) is clearly underestimated when ISC and PVEC is not considered (bias: 30% for OSEM3D, and 19% for OSEM3D+ISC). The results demonstrate also that both OSEM3D+ISC+IPRC+ INCC+PVEC yield accurate estimations of the uptake parameter (0.8% and 4%).
Table 1. FDOPA kinetic parameters
Irreversible Compartment Slope (min-1) Intercept
Theoretical 0.107 0.634
OSEM3D+ISC+IPRC+INCC +PVEC 0.112 0.544
OSEM3D+ISC+PVEC 0.106 0.600
OSEM3D+ISC 0.0864 0.666
Ir
a
n
J
N
u
c
l
M
e
d
2
0
1
2
,
V
o
l
2
0
,
N
o
1
(
S
e
ri
a
l
N
o
3
7
)
17
DISCUSSIONThe effect of scatter is due to the fact that the scatter fraction is relatively high in 3D PET mode acquisition. The results show 4% higher bias when we did not include the PR and NC effects. This finding was not originally expected, and it can be explained by the fact that the size of the expanded ROI, which determines the success of the PVEC method, depends on the FWHM of the Gaussian function used at the convolution step. This value is related to the spatial resolution of the scanner but it is not straightforward to know which the most appropriate value for each case is and this is the main limitation of the specific PVEC approach. In the particular experiment we used a FWHM equal to the crystal detector size, however it might have been more accurate to obtain the value of the FWHM from experimental PSF measurements. Nevertheless, the observed bias is not as large as without performing the PVEC at all.
Table 1 shows that when OSEM3D + ISC + PVEC is used PR and NC effects are also compensated. The results show that the PVEC method based on expanded regions of interest can be used for FDOPA quantification, however it must be noted that the specific method assumes uniform radioactivity background. Thus, if reconstruction included modelling of the PSF, it might have improved more the quantification performance, in particular when small brain structures are examined [34].
Finally, one limitation of our study is that it was applied only in rather simple simulated data. Future investigations will focus on real data and more realistic simulations that will include effects such as motion [35], more complicated kinetic models as for example the spectral analysis or compartmental models. Moreover, synergistic information from MR or CT data for the correction of these phenomena is another potential direction to minimize their effects, improve quantitative accuracy and increase resolution [36].
CONCLUSION
The performance of various physical correction approaches was investigated. The methodology was based on Monte Carlo simulations allowed the assessment of the impact of different physical effects on the FDOPA Patlak analysis.
Our work suggests careful care in dealing with the quantitative values obtained from kinetic PET studies because these values can be substantially affected by different physical effects such as scatter, positron range, non-colinearity and partial volume effect. The results indicate that correction for image degrading
factors is essential for accurate quantitative analysis of dynamic FDOPA PET studies. In this regard, a simple partial volume correction method is reported, which can be easily adopted by nuclear physicians in clinical routine. We recommend the use of this method in practice of nuclear medicine.
REFERENCES
1. Poyot T, Condé F, Grégoire MC, Frouin V, Coulon C, Fuseau C, Hinnen F, Dollé F, Hantraye P, Bottlaender M. Anatomic and biochemical correlates of the dopamine transporter ligand 11C-PE2I in normal and parkinsonian primates: comparison with 6-[18F]fluoro-L-dopa. J Cereb Blood Flow Metab. 2001 Jul;21(7):782-92.
2. Brooks DJ, Ibanez V, Sawle GV, Quinn N, Lees AJ, Mathias CJ, Bannister R, Marsden CD, Frackowiak RS. Differing patterns of striatal 18F-dopa uptake in Parkinson's disease, multiple system atrophy, and progressive supranuclear palsy. Ann Neurol. 1990 Oct;28(4):547-55.
3. Brooks DJ, Salmon EP, Mathias CJ, Quinn N, Leenders KL, Bannister R, Marsden CD, Frackowiak RS. The relationship between locomotor disability, autonomic dysfunction, and the integrity of the striatal dopaminergic system in patients with multiple system atrophy, pure autonomic failure, and Parkinson's disease, studied with PET. Brain. 1990 Oct;113 ( Pt 5):1539-52.
4. Wahl L, Nahmias C. Modeling of fluorine-18-6-fluoro-L-Dopa in humans. J Nucl Med. 1996 Mar;37(3):432-7.
5. Matsubara K, Watabe H, Kumakura Y, Hayashi T, Endres CJ, Minato K, Iida H. Sensitivity of kinetic macro parameters to changes in dopamine synthesis, storage, and metabolism: a simulation study for [¹⁸F]FDOPA PET by a model with detailed dopamine pathway. Synapse. 2011 Aug;65(8):751-62.
6. Patlak CS, Blasberg RG, Fenstermacher JD. Graphical evaluation of blood-to-brain transfer constants from multiple-time uptake data. J Cereb Blood Flow Metab. 1983 Mar;3(1):1-7.
7. Badawi RD, Miller MP, Bailey DL, Marsden PK. Randoms variance reduction in 3D PET. Phys Med Biol. 1999 Apr;44(4):941-54.
8. Kinahan PE, Townsend DW, Beyer T, Sashin D. Attenuation correction for a combined 3D PET/CT scanner. Med Phys. 1998 Oct;25(10):2046-53.
9. van Velden FH, Kloet RW, van Berckel BN, Lammertsma AA, Boellaard R. Accuracy of 3-dimensional reconstruction algorithms for the high-resolution research tomograph. J Nucl Med. 2009 Jan;50(1):72-80.
10. Verhaeghe J, Reader AJ. AB-OSEM reconstruction for improved Patlak kinetic parameter estimation: a simulation study. Phys Med Biol. 2010 Nov 21;55(22):6739-57.
Ir
a
n
J
N
u
c
l
M
e
d
2
0
1
2
,
V
o
l
2
0
,
N
o
1
(
S
e
ri
a
l
N
o
3
7
)
18
12. Cheng JC, Rahmim A, Blinder S, Camborde ML,Raywood K, Sossi V. A scatter-corrected list-mode reconstruction and a practical scatter/random approximation technique for dynamic PET imaging. Phys Med Biol. 2007 Apr 21;52(8):2089-106.
13. Planeta-Wilson B, Yan J, Mulnix T, Carson RE. Quantitative Accuracy of HRRT List-mode Reconstructions: Effect of Low Statistics. IEEE Nucl Sci Symp Conf Rec (1997). 2008 Oct 1;2008:5121-5124.
14. Dai X, Chen Z, Tian J. Performance evaluation of kinetic parameter estimation methods in dynamic FDG-PET studies. Nucl Med Commun. 2011 Jan;32(1):4-16.
15. Le Pogam A, Hatt M, Descourt P, Boussion N, Tsoumpas C, Turkheimer FE, Prunier-Aesch C, Baulieu JL, Guilloteau D, Visvikis D. Evaluation of a 3D local multiresolution algorithm for the correction of partial volume effects in positron emission tomography. Med Phys. 2011 Sep;38(9):4920-3.
16. Boellaard R, van Lingen A, Lammertsma AA. Experimental and clinical evaluation of iterative reconstruction (OSEM) in dynamic PET: quantitative characteristics and effects on kinetic modeling. J Nucl Med. 2001 May;42(5):808-17.
17. Wallius E, Nyman M, Oikonen V, Hietala J, Ruotsalainen U. Voxel-based NK1 receptor occupancy measurements with [(18)F]SPA-RQ and positron emission tomography: a procedure for assessing errors from image reconstruction and physiological modeling. Mol Imaging Biol. 2007 Sep-Oct;9(5):284-94.
18. Zaidi H. Comparative evaluation of scatter correction techniques in 3D positron emission tomography. Eur J Nucl Med. 2000 Dec;27(12):1813-26.
19. Shidahara M, Tsoumpas C, Hammers A, Boussion N, Visvikis D, Suhara T, Kanno I, Turkheimer FE. Functional and structural synergy for resolution recovery and partial volume correction in brain PET. Neuroimage. 2009 Jan 15;44(2):340-8.
20. Cho ZH, Chan JK, Ericksson L, Singh M, Graham S, MacDonald NS, Yano Y. Positron ranges obtained from biomedically important positron-emitting radionuclides. J Nucl Med. 1975 Dec;16(12):1174-6.
21. Levin CS, Hoffman EJ. Calculation of positron range and its effect on the fundamental limit of positron emission tomography system spatial resolution. Phys Med Biol. 1999 Mar;44(3):781-99.
22. Geramifar P, Ay MR, Zafarghandi MS, Loudos G, Rahmim A. Performance comparison of four commercial GE Discovery PET/CT scanners: A Monte Carlo study using GATE. Iran J Nucl Med 2009;17(2):26-33.
23. Lewellen TK, Harrison RL, Vannoy S. The SimSET program. In: Ljungberg M, Strand SE, King MA, editors. Monte Carlo simulations in Nuclear Medicine. Bristol and Philadelphia: IOP Publishing; 1998. p. 77-92.
24. Gunn RN, Gunn SR, Cunningham VJ. Positron emission tomography compartmental models. J Cereb Blood Flow Metab. 2001 Jun;21(6):635-52.
25. Schmidt KC, Turkheimer FE. Kinetic modeling in positron emission tomography. Q J Nucl Med. 2002 Mar;46(1):70-85.
26. Fleming JS, Bolt L, Stratford JS, Kemp PM. The specific uptake size index for quantifying radiopharmaceutical uptake. Phys Med Biol. 2004 Jul 21;49(14):N227-34.
27. Tossici-Bolt L, Hoffmann SM, Kemp PM, Mehta RL, Fleming JS. Quantification of [123I]FP-CIT SPECT brain images: an accurate technique for measurement of the specific binding ratio. Eur J Nucl Med Mol Imaging. 2006 Dec;33(12):1491-9.
28. Howes OD, Montgomery AJ, Asselin MC, Murray RM, Valli I, Tabraham P, Bramon-Bosch E, Valmaggia L, Johns L, Broome M, McGuire PK, Grasby PM. Elevated striatal dopamine function linked to prodromal signs of schizophrenia. Arch Gen Psychiatry. 2009 Jan;66(1):13-20.
29. Jacobson M, Levkovitz R, Ben-Tal A, Thielemans K, Spinks T, Belluzzo D, Pagani E, Bettinardi V, Gilardi MC, Zverovich A, Mitra G. Enhanced 3D PET OSEM reconstruction using inter-update Metz filtering. Phys Med Biol. 2000 Aug;45(8):2417-39.
30. Thielemans K, Tsoumpas C, Mustafovic S, Beisel T, Aguiar P, Dikaios N, Jacobson MW. STIR: software for tomographic image reconstruction release 2. Phys Med Biol. 2012 Feb 21;57(4):867-83.
31. Turkheimer FE, Aston JA, Asselin MC, Hinz R. Multi-resolution Bayesian regression in PET dynamic studies using wavelets. Neuroimage. 2006 Aug 1;32(1):111-21.
32. Yu DC, Huang SC, Barrio JR, Phelps ME. The assessment of the non-equilibrium effect in the 'Patlak analysis' of Fdopa PET studies. Phys Med Biol. 1995 Jul;40(7):1243-54.
33. Patlak CS, Blasberg RG. Graphical evaluation of blood-to-brain transfer constants from multiple-time uptake data. Generalizations. J Cereb Blood Flow Metab. 1985 Dec;5(4):584-90.
34. Walker MD, Asselin MC, Julyan PJ, Feldmann M, Talbot PS, Jones T, Matthews JC. Bias in iterative reconstruction of low-statistics PET data: benefits of a resolution model. Phys Med Biol. 2011 Feb 21;56(4):931-49.
35. Rahmim A, Rousset O, Zaidi H. Strategies for motion tracking and correction in PET. PET Clin. 2007;2(2):251-66.