University of New Orleans University of New Orleans
ScholarWorks@UNO
ScholarWorks@UNO
University of New Orleans Theses and
Dissertations Dissertations and Theses
Fall 12-17-2011
Voluntary Environmental Programs: An Examination of Program
Voluntary Environmental Programs: An Examination of Program
Performance and the Role of Institutional Design
Performance and the Role of Institutional Design
Jessica LL Sims
University of New Orleans, [email protected]
Follow this and additional works at: https://scholarworks.uno.edu/td
Part of the Environmental Policy Commons
Recommended Citation Recommended Citation
Sims, Jessica LL, "Voluntary Environmental Programs: An Examination of Program Performance and the Role of Institutional Design" (2011). University of New Orleans Theses and Dissertations. 1355.
https://scholarworks.uno.edu/td/1355
This Thesis is protected by copyright and/or related rights. It has been brought to you by ScholarWorks@UNO with permission from the rights-holder(s). You are free to use this Thesis in any way that is permitted by the copyright and related rights legislation that applies to your use. For other uses you need to obtain permission from the rights-holder(s) directly, unless additional rights are indicated by a Creative Commons license in the record and/or on the work itself.
Voluntary Environmental Programs: An Examination of Program Performance and the Role of Institutional Design
A Thesis
Submitted to the Graduate Faculty of the University of New Orleans in partial fulfillment of the requirements for the degree of
Master of Public Administration
by
Jessica LL Sims
B.A. Dillard University, 2009
Dedication
Acknowledgements
Dr. Daniel Lewis has been an incredible thesis chair. Though his patience, encouragement and guidance he has become a valuable and deeply appreciated mentor. He has aided this thesis in
Table of Contents
List of Figures ...v
List of Tables ... vi
Abstract ...vii
Introduction ...1
Literature Review...4
Methodology ...15
Results ...23
Discussion ...36
Bibliography ...38
Appendices ...41
List of Figures
Figure 1 ... Average Emission Reduction of VEPs
Figure 2 ... Responsible Care Histogram
Figure 3 ... ISO 14001 Histogram
Figure 4 ...ELP Histogram
List of Tables
Table 1 ... Voluntary Environmental Programs Studied
Table 2 ... Program Design Features
Table 3 ... Percentages of Firms with Increases and Decreases in Emissions, 2007-2009
Table 4 ... Climate Leaders and Responsible Care Test of Proportion
Table 5 ... Climate Leaders and ISO 14001 Test of Proportion
Table 6 ... Climate Leaders and ELP Test of Proportion
Table 7 ... Sanctions Test of Proportion
Table 8 ... Reduction Targets Test of Proportion
Table 9 ... Program Design Features and Program Performance
Table A-1 ... Climate Leaders and Responsible Care T-Test
Table A-2 ... Climate Leaders and ISO 14001 T-Test
Table A-3 ... Climate Leaders and ELP T-Test
Table A-4 ...Responsible Care and ISO 14001 T-Test
Table A-5 ... Responsible Care and ELP T-Test
Table A-6 ...ISO 14001 and ELP T-Test
Table A-7 ... Sanctions T-Test
Table A-8 ... Reduction Targets T-Test
Table A-9 ... Responsible Care and ISO 14001 Test of Proportion
Table A-10 ... Responsible Care and ELP Test of Proportion
Abstract
Many studies exist on whether Voluntary Environmental Programs (VEPs) improve firms’
environmental performance. Furthermore, the literature on VEPs theorizes that specific features
contribute to program performance. This study examines the ability of Voluntary Environmental
Programs to reduce emissions and the role of institutional design on their performance.
Specifically, this study aimed to identify if specific features influence performance more than
others do. The indicator of performance focuses on the overall emission reductions of firms
across years 2007-2009. To analyze performance and features, the study examines the emission
data and design features of each program. The results reveal the ability of the VEPs to reduce
emissions and a combination of features that may have a greater influence on performance. This
suggests that the success of VEPs rely on their ability to institute these features.
Introduction
Over the last three decades, Voluntary Environmental Programs (VEPs) gained support
from many industries as an alternative to government regulation to address environmental
concerns. However, the efficacy of VEPs to reduce pollution remains an open question for
environmental activists and scholars. Further, many question whether existing VEPs employ
appropriate design features to ensure efficacy. This study addresses these questions with the
examination of four VEPs and their firms’ performance in reducing hazardous air emissions.
The federal government began regulating environmental policies in the late 1960s,
followed by the creation of the EPA in 1970 (EPA 2011). Catastrophic events, such as Love
Canal and Three Mile Island increased public concern about environmental pollution and
changed how the U.S. government addressed environmental problems. The passage of
significant environmental legislation, including the Clean Air Act, Resource Conservation and
Recovery Act, and the Clean Water Act, addressed environmental policy through government
regulation (EPA 2011). By the 1980s, command and control regulation mandated environmental
policies. Command and control regulation refers to government regulation wherein agency
administrators create legally binding standards, such as emission limits, and the use of specific
production technologies (Potoski and Prakash 2005). These regulations control the emissions of
environmental pollutants through mandates (e.g., emissions taxes) and penalties (Dawson and
Segerson 2008).
Though initially successful, command and control regulations eventually garnered
criticisms from scholars and businesses alike as being inflexible and costly (Darnall and Sides
mandates to ensure compliance due in part to limited funding of necessary oversight activities
(e.g., inspections) (Darnall and Carmin 2005). As a result, alternative instruments to
environmental policy became attractive to governments, businesses and stakeholders.
One such alternative was Voluntary Environmental Programs (VEPs). VEPs are
programs that firms join voluntarily in order to pursue environmental stewardship beyond
government compliance. Subsequently, VEPs became major instruments for implementing
environmental policies in many arenas including government and industries.
The demand for a cost-benefit approach to environmental regulation spurred support of
VEPs as an alternative regulatory instrument (Koehler 2007). The nature of VEPs allows firms
to avoid costly legislation, monitoring and enforcement (Arora and Cason 1996). The
expectations of VEPs are to improved environmental conditions without the cost and
inefficiencies of government regulation (Dawson and Segerson 2008). However, VEPs do not
replace existing regulations. Instead, they should move firms beyond regulations and address
issues overlooked by government regulations (Koehler 2007). The high expectations of VEPs
are evident by their extensive involvement in governments, industries and nongovernmental
organizations.
Still, VEPs are not without their own critics. At the center of the VEP debate are
questions about their efficacy. Given the voluntary nature of VEPs, it is unclear whether these
programs actually provide environmental protection and improve human health (Daley 2007).
Many consider VEPs to be “greenwashes,” a term that refers to a superficial display of
environmental concern by an organization in order to undermine unfriendly environmental
participating firms can simply signal environmental commitment without actually improving
their environmental performance. By law, government regulators cannot enforce a voluntary
program (Arora and Cason 1996). Thus, to consumers and stakeholders, VEP membership can
signal environmental concern without providing evidence of actual environmental performance.
The criticisms of VEPs led many scholars to examine their ability to reduce pollution.
The analysis of VEPs performance also fostered the examination of their institutional designs.
This study has two goals: to test the ability of VEPs to reduce emissions and to compare the
efficacy of various design features of the VEPs. To reach these objectives this research
examines four VEPs. The study focuses on the performance of the firms in each VEP and the
specific design features of each VEP. The indicator of performance is their overall emission
data. The comparison of their design features examines the similarities and differences of each
VEP.
The high expectations, criticisms, and multiple design features of VEPs fueled the
decision to study their program efficacy. Yet, their known program failures (e.g., free riding)
motivate the examination of their institutional design. If VEPs performed properly, the expected
benefits would affect not only firms but also the public, governments, and stakeholders. VEPs
represent ideal public-private partnerships between businesses and governments to fulfill public
policy. The study is vital because it takes into account a combination of features that may
influence program performance. Furthermore, VEPs are unique in the sense that government
regulation purses compliance through voluntary measures. Since, governments seek to pursue
vital public policy with voluntary measures, ensuring that VEPs succeed requires a critical
Literature Review
Voluntary Environmental Programs are an approach to fostering environmental
protection without command and control regulation. Though these programs are popular, their
effectiveness in improving environmental compliance and performance is unclear. Current
literature on VEPs provides a foundation for understanding their popularity, purpose, firms’
participation and effectiveness.
There are three types of VEPs: industry-led (e.g., the automobile industry), government
(i.e., a government-led program with private participants), and industry-government (i.e., a
program jointly created by government and a specific industry for that industry i.e., Aluminum
industry). Each type of program may have different institutional designs, overall performance
and public perception; however, they are fundamentally the same.
Governments, industries and regulatory agencies adopt voluntary environmental
programs for various reasons. VEPs are popular when the threat of regulation is high (Koehler
2007). The threat of regulation under mandatory environment protocol motivates firms to seek
membership in voluntary programs (Khanna and Damon 1999). Firms will seek VEP
membership if the anticipated costs are less than the anticipated costs to comply with
government orders (e.g., eco-taxes). VEPs, especially industry programs, allow firms to preempt
regulation by committing to environmental goals (Koehler 2007). For example, government
agrees not to impose a regulation on the firms if the environmental target is achieved voluntarily
(Alberini and Segerson 2002). In general, firms participate in VEPs largely because they
perceive a benefit that outweighs the cost of participation or at least no net loss from
VEPs provide direct benefits to firms such as public recognition through newsletters,
press releases and awards. Firms also receive technical assistance that provides innovative ways
to reduce pollution, which lowers the cost of learning about best practices (Khanna and Damon
1999). Member firms receive benefits, such as a positive “brand name,” that exclude
nonparticipating firms (Potoski and Prakash 2005). The utility of these benefits may depend on
the individual firms. For example, firms closer to consumers (e.g., firms controlling the final
product) benefit more from VEP membership because they assume consumers are willing to pay
a higher cost for a product that reduces environmental impact (Arora and Cason 1996). This
implies that firms that do not directly sell to consumers benefit less from “green branding”;
instead, they benefit more from publicity from stakeholders (e.g., customers, sponsors).
The publicity from joining a VEP signals to consumers that firms are environmentally
conscious (Arora and Cason 1996). This signaling of environmental stewardship contributes to
the criticisms that VEPs are simply “greenwashes.” The type of VEP chosen (e.g., industry
versus government) also depends on the perception of the firms. Firms seek membership in
specific types of VEPs depending on the benefits. For example, if a firm seeks to reduce the cost
of environmental regulation they would likely join a government-sponsored program. However,
if they seek to enhance their environmental reputation within the industry, they would likely join
an industry program (Darnall et al 2009). Thus, firms chose VEPs that convey their level of
desired environmental stewardship. Hence, firms select a VEP strategically based on the
expected level of publicity and benefit.
Despite the benefits of membership, joining a VEP can impose significant costs on firms.
The costs are investments made to improve environmental performance (e.g., equipment,
make substantial investments in pollution prevention activities. Some also require the
implementation of a costly environmental management system (EMS) (Darnall et al 2009) that
provides firms with strategies to reduce environmental impact. It also helps firms develop an
environmental policy, which states their commitment to prevent pollution, plans for continual
improvement and compliance with environmental regulation. (BSI 2011). For example,
certification to International Standardization Organization (ISO) 14001 ranges from $25,000 to
over $100,000 per facility (Potoski and Prakash 2005). Furthermore, the costs associated with
joining a VEP varies for each firm. For example, larger firms face higher adoption costs because
they have to collect and apply more information, train more people and implement new
technologies on a wider scale (Khanna et al 2007). Firms also face increased operation costs,
and they risk the loss of customers and investors from a damaged reputation if performance is
not improved (BSI 2011).
VEP Performance
Despite the costs associated with a VEP, they remain attractive to many firms. However,
their popularity does not hinge upon their environmental performance and does not necessarily
mean they are effective. While some are arguably successes (e.g., EPA’s Green Light Program),
scholars have identified many that were failures (e.g., EPA’s Performance Track) (Moon 2008;
Kohler 2007).
Scholarly literature identifies free riding and shirking as the main problems that plague
VEPs, and conceivably lead to their failure. Free riding is the tendency of firms to underperform
but still benefit (e.g., receive recognition from stakeholders and consumers) from the overall
success of the VEP (Potoski and Prakash 2007). Shirking is the intentional avoidance of
strong incentives to free ride and shirk. For example, Koehler (2007) argues that
underperforming firms avoid making the financial investments necessary to reduce pollution, but
still benefit from the VEP success. Furthermore, participating in a VEP still signals
environmental compliance and performance to consumers and stakeholders. Since VEPs, by
definition, are voluntary, they attract free riding and shirking firms. This is further aggravated
because most VEPs lack penalty for underperformance. With the lack of penalty enforcements,
some firms may intentionally fail. The incentives to free ride and shirk contributes to the loss of
efficiency in overall program performance (Dawson and Segerson 2008).
Design Features
The literature identifies multiple design features associated with VEP performance. The
features extensively discussed include oversight and enforcement features such as sanctioning,
auditing, reporting, and certification. Scholars argue theses features may address the concerns
about free riding and shirking. The literature also discusses the role of other features such as
positive, tangible incentives and performance targets on program performance. Theoretically,
institutional design is the “parts” that share a significant relationship to the effectiveness or
“whole” of the VEP. If free riding and shirking cripples the “whole” program, then the “parts”
must be ineffective. Thus, program design features should abate these program failures.
Oversight and Enforcement
Oversight and enforcement features sanction, monitor and audit member firms for
undesirable participation and outcomes. Potoski and Prakash (2007) argue that monitoring and
sanctioning mechanisms can force members to comply with standards, which can control free
riding and shirking. In order for these mechanisms to work, Potoski and Prakash (2007) argue
sanctioning by program sponsors. They define these elements of the sanctioning mechanisms as
“swords”; strong sword programs have audits, disclosure and sanctioning mechanisms. Medium
sword programs require third-party audits and public disclosure but no sanctioning mechanisms
and weak sword programs only require third-party audits (Potoski and Prakash 2007). However,
the majority of VEPs do not have these combinations of features.
Sanctioning and auditing
VEPs adopt sanctioning mechanisms to reprimand program participants for
underperformance. Auditing mechanisms monitors if firms are complying with standards.
Literature highlights the desirable effects oversight and enforcement has on improving VEPs
performance (Rivera, Deleon, & Koerber 2006). For example, King and Lenox (2000) found
that the chemical industry’s Responsible Care program had informal punishments such as
publicly denouncing underperforming firms. However, in the absence of formal sanctions, they
did not improve members’ performance in pollution abatement. Furthermore, they found that
participating firms reduced emissions slower than nonparticipants did. For VEPs, sanctioning
mechanism must pose a low cost to implement but a high cost for firms. For firms, the costs are
not necessarily fines, but instead negative publicity. If firms gain more publicity from
participation, which ultimately affects their profitability, then firms should pay a high cost for
failed performance, which is the loss of that publicity. Sanctioning can publicly denounce a
firm’s performance, which may result in a negative image that undermines their profits.
Auditing is another oversight feature found in VEPs. Government sponsored VEPs
generally are self-monitoring programs, in which they self-evaluate their adherence to program
requirements and report to a program manager. However, VEPS rarely verify their. Even if a
and Sides 2008). Industry-sponsored programs also lack third party monitoring and sanctions for
poor environmental performance (King and Lenox 2000).
Sachs (2002) demonstrated in a study of the ski industry’s Sustainable Slopes Program,
that the lack of sanctioning and third party oversight contributes to their criticisms as a
“greenwash”. The International Standardization Organization’s (ISO) 14001 program also
receives significant criticism despite requiring third party auditing. ISO 14001 lacks sanctioning
and public disclosure of audit findings, which would help ensure that firms improve
environmental performance (Darnall and Sides 2008). Darnall and Sides (2008) did find
however, that participation in ISO 14001 would produce greater environmental performance over
a self-monitored VEP, but this comparison is weak since self-monitored programs perform so
poorly. Whereas, Potoski and Prakash (2005) argue that stronger VEPs (e.g., 33/50) had better
requirements such as public disclosure of audit findings, which contributed to their stronger
performance.
Reporting
Reporting is another oversight feature that relates to auditing. Reporting is not a design
feature extensively covered in literature, but recognized as an approach that may influence
program performance. Reporting is the annual submission of program performance progress
(e.g., attaining the stated goals). Firms submit reports annually to the VEPs through online or
mail-in forms. However, firms easily avoid reporting because no sanctioning mechanisms exist
to make firms comply with this requirement. Furthermore, lax sanctions on reporting breed free
riding and shirking of program obligations due to the diminished view of the requirement
(Delmas and Kreller 2005). Delmas and Kreller (2005) found that Waste Wise, which makes
with non-reporting. Interestingly, they also concluded that even programs with extensive
emergency management systems are not likely to report.
Certification
Certification is another oversight mechanism found in some VEPs. Firms seek
certification to signal that they have met the standards of the program. Certification signals that
participating firms have committed to their standards of environmental compliance (International
Organization for Standardization 2011). Certification is either voluntary or mandatory, and
obtained from different sources. An authorized certifying entity such as American Systems
Registrar and ABS Quality Evaluations offers third party certification. However,
self-certification allows firms to declare themselves compliant with program standards. (International
Organization for Standardization 2011).
Considerable research has been conducted on the ISO
14001 program. Much like Responsible Care, ISO’s 14001 requires firms to adopt an
environmental management system (EMS), which then requires firms to obtain certification
(International Organization for Standardization 2011). Mixed evidence of efficacy exists on
whether certification to ISO 14001 leads to improved environmental performance. Andrews,
Hutson, and Edwards (2006), found in their comparative study of 3,189 certified ISO EMS and
noncertified ISO manufacturing facilities that participating firms made moderate reductions in
other mediums, such as energy use, hazardous waste, spills and leaks, but not in air and water
pollution. However, Matthews (2001) found in his analysis of automobile assembly facilities
that there was no difference in environmental performance between facilities with and without
ISO certified EMSs.
Incentives
Incentives are another feature with the potential to increase program performance. These
performance. Tangible incentives are lacking in most VEPs, and literature offers little on the
efficacy of incentives on program performance. The current incentives for performance in VEPs
are similar to the incentives to join a VEP (e.g., publicity). Some VEPs especially those found in
public entities do not offer financial incentives or more incentives than traditional regulatory
mechanisms. As a result, VEPs fail to improve environmental behavior (Lyon and Maxwell
2007).
The long-term feasibility of VEPs depends on their impact on a firm’s profitability, yet
they lack positive incentives (Khanna and Damon 1999). King and Lenox (2000), suggest that
positive, financial incentives may increase a firm’s environmental performance and abate free
riding and shirking. However, public recognition will likely only have a small impact on a
firm’s bottom line and will not encourage large investments in pollution reduction (Lyon and
Maxwell 2007). Public recognition will not necessarily guarantee a profit, but positive
incentives can effectively guarantee firms can gain a monetary benefit (Alberini and Segerson
2002). The anticipated return from a firm’s participation lies in the level of abatement obligation
and the extent of the financial incentives provided (Alberini and Segerson 2002). Thus, if
incentives can increase environmental performance and effectiveness, then VEPs should offer
greater incentives.
Despite the arguments for positive incentives, they may not have the ability to improve
environmental performance. In her research of the EPA’s Performance Track program, Koehler
(2007) finds that changes in environmental performance was minimal because the program did
not sufficiently recognize and provide incentives for performing members. She found that
Thus, the incentive constraint directly influences the performance of Performance Track and
other VEPs (Koehler 2007). This implies an incompatible relationship between policy and
intent. If VEPs expect firms to make costly investments in pollution abatement, then they need
to offer sufficient incentives in order to encourage and continue a firm’s environmental
performance. Appropriate incentives for participation should depend on the firms’
characteristics. This implies that the design of VEPs needs to attract targeted groups of firms.
As a result, VEPs have to offer different financial incentives depending on the firms’ abatement
levels. (Alberini and Segerson 2002).
Performance Targets
Setting performance targets is also a feature found in some VEPs. The targets are
typically general in nature and set by the firms themselves. Performance targets often reveal the
areas of environmental stewardship that firms seek to improve or prioritize. One study, in an
analysis of 33/50, Climate Wise and Climate Challenge, found that this requirement did not
encourage significantly higher pollution reduction above the status-quo because participating
firms set very low performance targets (Darnall and Sides 2008). Generally, VEPs require
participants to establish and meet self-determined environmental targets but weak goals
contribute to the underperformance of program participants. Thus, if VEPs allow weaker goals
than those required by regulation, then participating firms will be less likely to improve
environmental performance than nonmembers will (Darnall and Sides 2008). This suggests that
the strength of the goals is problematic not necessarily the requirement of goal setting. Current
literature does not offer much evidence about the performance of VEPs that strongly encourage
firms to set explicit reduction goals. Explicit reduction goals are those with aggressive reduction
management strategies to establish a systematic approach to setting objectives (International
Organization for Standardization 2011; Responsible Care 2011). The ISO 14001 does not require
firms to specify levels of environmental performance (International Organization for
Standardization 2011).
Government Investments
Whether these programs are successful or not, governments make significant investments
in VEPs. The federal government via the EPA offers program participants technical assistance,
financial and environmental analysis tools, training, seminars, toolkits, and environmental
performance benchmarking strategies. Participants have access to not only the EPA’s resources
but also the resources of other organizations including laboratories and consultants (Benefits of
Becoming a Partner 2011). Furthermore, the salaries of program administrators to implement the
approximately 60 different VEPs housed under the EPA, is also a government investment.
Governments expect firms to return their investments by reducing environmental pollution and
damage.
Most literature finds little evidence of the benefits of VEPs, but in theory, these programs
can be effective with correct institutional design. Ideally, if firms improve their environmental
performance through voluntary efforts, it would reduce governmental pressures and regulations.
This ensures a “win-win” situation for firms. Literature explains both the success and failures of
VEP, but it does reveal a consensus amongst scholars about the potential effects of design
features on effectiveness. Nevertheless, literature does not provide much empirical evidence
about the effectiveness of specific design features.
should perform better. According to literature, lax regulatory mechanisms contribute to the
program failures prevalent amongst VEPs. This implies if VEPs had sanctioning institutions
they would improve their performance. This study accepts this argument because sanctioning
mechanisms create a sense of consequence, which would motivate firms to improve performance
to avoid the negative publicity generated from sanctioning.
Literature also found that goal setting is largely ineffective if the goals are too weak.
This argument is persuasive because the stated goals of firms in VEPs are often general which
can result in immeasurable goals. Explicit reduction targets, in contrast, are specific and provide
measurable goals that have direct influence on improving environmental impact. While the other
features may contribute to VEPs’ performance, they may be less important than sanctioning and
reduction targets. The study analyzes sanctioning and reduction targets for two reasons.
Literature offers extensive coverage on the influence of sanctioning mechanisms but offers
limited coverage on explicit reduction targets; thus, this research seeks to analyze the influence,
if any, these features have on performance. If sanctioning mechanisms and explicit reduction
goals positively impact VEP performance, we may conclude that they are features that are more
important then incentives and certification. The question this research seeks to answer is
whether sanctioning and reduction targets affect effectiveness. This leads to the following
hypotheses:
Hypothesis 1: Programs with sanctioning mechanism will perform better than programs with no
sanctioning mechanisms.
Hypothesis 2: Programs with reduction targets will perform better than programs with no
Methodology
This is primarily a comparative study using secondary data. The data were obtained from
the EPA’s Toxic Release Inventory (TRI) and Greenhouse Gases Inventory (GHG). The
Emergency Planning and Community Right-to-Know Act (EPCRA) require the EPA and States
to collect data annually on the transfer and releases of specific toxic chemicals from industrial
facilities. The facilities submit the data through a report form, which is made public through the
TRI database. The purpose of the TRI is to inform communities about toxic release chemicals
and waste management activities (EPA 2011). Facilities annually submit greenhouse gases data
through a report to the EPA, which then becomes public through the GHG Inventory.
The EPA’s databases were selected because they provided a single source of data instead
of multiple, independent sources. The study uses descriptive statistics (e.g., histograms) and
inferential statistics (e.g., test of statistical significance) to analyze the independent variables
(design features) and the dependent variables (program effectiveness) to analysis the data.
To test the hypotheses, I examined four VEPs. The VEPs sampled in the research are
Responsible Care, Climate Leaders, ISO 14001 and Louisiana’s Environmental Leadership
Program (ELP). I selected these VEPs because they represent different types of programs and all
report emissions data, which meets the research’s criteria. Furthermore, these emissions reports
are publicly available data. The study compares the Hazardous Air Pollutants (HAPS) and
Greenhouse Gas emission data from the four VEPs and their design features. This research
examines the performance of each VEP by analyzing their ability to reduce emissions.
Therefore, while HAPs and Greenhouse Gases are different types of emissions, it does not affect
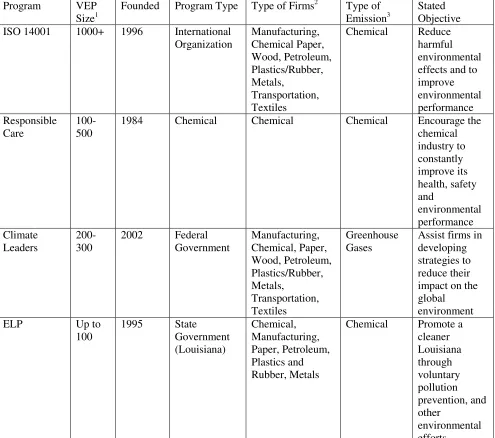
the comparison of program performance. Table 1 illuminates the background of the four
Table 1 Voluntary Environmental Programs Studied
Program VEP Size1
Founded Program Type Type of Firms2 Type of Emission3
Stated Objective ISO 14001 1000+ 1996 International
Organization Manufacturing, Chemical Paper, Wood, Petroleum, Plastics/Rubber, Metals, Transportation, Textiles
Chemical Reduce harmful environmental effects and to improve environmental performance Responsible Care 100-500
1984 Chemical Chemical Chemical Encourage the chemical industry to constantly improve its health, safety and environmental performance Climate Leaders 200-300
2002 Federal Government Manufacturing, Chemical, Paper, Wood, Petroleum, Plastics/Rubber, Metals, Transportation, Textiles Greenhouse Gases
Assist firms in developing strategies to reduce their impact on the global environment ELP Up to
100
1995 State Government (Louisiana) Chemical, Manufacturing, Paper, Petroleum, Plastics and Rubber, Metals
Chemical Promote a cleaner Louisiana through voluntary pollution prevention, and other environmental efforts
The International Standardization Organization offers an environmental management
standard known as ISO 14001. ISO 14001 provides facilities with environmental management
strategies, which requires them to adopt an Environmental Management System (EMS). An
1
Size of Program refers to the number of participating firms within the United States. 2
Type of firms refers to the firms included in each program. This list is not inclusive of all types of participating facilities. The firms included in this research are US firms only.
3
EMS requires firms to develop an environmental policy that states a commitment to prevent
pollution and plans for continual environmental performance. Next, it requires firms to produce
objectives (e.g., targets for environmental improvement and a management program to achieve
it). Firms must train proper personnel usually starting from top management on down. It then
requires firms to undergo assessment and implementation reviews. A certifying entity will
perform both a document review and site visit. Last, firms must certify their EMS. They must
meet these standards and obtain certification through self-certification or third party certification
(BSI 2011). Thus, the voluntary program is the adoption of the 14001 standard and EMS. The
14001 standard is at the facility level. Each individual facility of a company must meet the
requirements of the above standards independently. Any organization in any sector can pursue
ISO 14001 certification. ISO 14001’s program design features include mandatory auditing with
no public disclosure of audit findings, mandatory certification through either self-certification or
third-party certification, no formal sanctioning mechanism, no reporting requirements and no
requirement of explicit reduction targets. Based on these features, ISO 14001 is considered a
“weak” program as defined by Potoski and Prakash (2007).
Responsible Care is the chemical industry’s VEP, which also requires participants to
adopt an EMS. Like ISO 14001 standards, the EMS provides environmental management
strategies to assist companies in improving environmental performance, safety, and health.
Thus, the voluntary program is the adoption of the EMS. Unlike, ISO 14001, Responsible Care
is at the company level. All facilities belonging to a participating company adopt the EMS.
Responsible Care only admits chemical companies for membership. Responsible Care’s design
features include mandatory auditing with no public disclosure of audit findings, mandatory
reporting, and no requirement of explicit reduction targets. Responsible Care is a “weak”
program based on their features as defined by Potoski and Prakash (2007).
Climate Leaders is an industry-government voluntary program that works with
companies to set environmental management strategies. The program requires members to
maintain a greenhouse gas inventory based on a quality management system. Unlike
Responsible Care and Climate Leaders, Climate Leaders encourage organizations to set
aggressive reduction targets. Any organization in any sector can join Climate Leaders. Climate
Leaders’ design features include no auditing requirements and no mandatory certification but if
desired firms could self-certify or obtain third party certification. Their primary sanctioning
policy is removal or expulsion after continued failed performance; and they encourage setting
reduction targets. Despite these features, Climate Leaders is a “weak” program as defined by
Potoski and Prakash (2007).
Louisiana’s Environmental Leadership Program (ELP) is a state run program that
requires organizations to improve environmental performance by adopting an internal
management system and encouraging pollution and waste reduction targets. ELP is also at the
facility level. Any organization of individual in Louisiana can join ELP. ELP’s design features
include no mandatory auditing, certification, or sanctioning mechanism, but they encourage
explicit reduction targets. ELP is a “weak” program based on their features as defined by
Potoski and Prakash (2007).
The VEPs’ respective websites provide participating companies. The American
Chemistry website provides a list of participating companies in Responsible Care. The EPA’s
participating firms. However, a list of about 200 ISO 14001 participants can be accessed from
the Environmental, Health and Safety Online website. The roster list of certifying entities such
as ABS Quality Evaluations, Advantage International Registrar, and Eagle Registrations
provided the remaining participants for ISO 14001. These certifying entities also confirmed the
participants accessed from The Environmental, Health and Safety Online website. Current
literature, the programs’ respective websites and Memorandum of Understandings (MOUs)
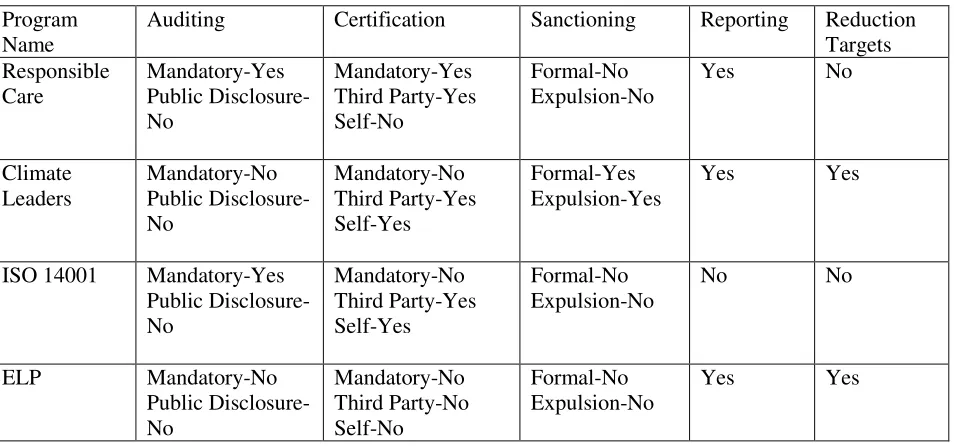
identified the design features of each VEP. Table 2 below displays the program design features
of each VEP.
Literature provided the features significant to VEPs. The features examined include
auditing, certification, sanctioning, reporting and explicit reduction targets. This research uses
guiding definitions of the program design features. Auditing is the monitoring of program
participants to ensure compliance with program standards. Public disclosure is the public release
of audit findings. Certification is the accreditation of program participants to signal compliance
to program standards. Depending on the VEP, certification is either mandatory or voluntary and
obtained through self or third party certification. Sanctioning is the mechanisms taken by the
program to reprimand participants for underperformance. Expulsion is the dismissal of
participants from the program. Reporting is the submission of participants’ program
performance progress. Reporting is usually done annually and allow the VEPs to track
participates’ progress towards goals. Reduction targets are goals with an explicit abatement level
of pollutants.
Table 2 Program Design Features
The study compares the emission data across the years 2007-2009. The emissions data
for ISO 14001, Responsible Care and ELP measure total Hazardous Air Pollutants (HAPs). The
data for Climate Leaders measure total Greenhouse Gases (GHG). The EPA identifies 188 air
toxics as HAPs pollutants. HAPS have hostile environmental effects and cause cancers,
reproductive problems, and birth defects. HAPs affect individuals through breathing the toxics
and consuming contaminated food products. HAPs are largely human-made toxics derived from
mobile sources (e.g., automobiles), stationary sources (e.g., power plants), indoor sources (e.g.,
cleaning products). They also come from natural sources (e.g., forest fires) (About Air Toxics
2010). Greenhouse gases affect both people and the environment, but the primary damage
occurs to the climate. Greenhouse gases cause adverse environmental effects by trapping heat in
the atmosphere. Natural (e.g., carbon dioxide) and human-made sources (e.g., sulfur
hexafluoride for industrial processes) create greenhouse gases. GHGs cause climate change,
which subsequently affects people. The EPA identifies many prevalent diseases, reduced farm Program
Name
Auditing Certification Sanctioning Reporting Reduction Targets Responsible Care Mandatory-Yes Public Disclosure- No Mandatory-Yes Third Party-Yes Self-No Formal-No Expulsion-No
Yes No
Climate Leaders Mandatory-No Public Disclosure-No Mandatory-No Third Party-Yes Self-Yes Formal-Yes Expulsion-Yes
Yes Yes
ISO 14001 Mandatory-Yes Public Disclosure- No Mandatory-No Third Party-Yes Self-Yes Formal-No Expulsion-No
No No
ELP Mandatory-No Public Disclosure-No Mandatory-No Third Party-No Self-No Formal-No Expulsion-No
productivity, severe floods and droughts, rising sea levels, and loss of habitat amongst others the
result of climate change (Greenhouse Gas Emissions 2011). HAPs and GHG are pollutants of
synthetic or natural sources that affect both the environment and humans. The difference in type
of pollutant is not significant since the analysis focuses on the overall percentage change in
emissions of firms.
The EPA’s Toxic Release Inventory (TRI) database provided the data for Responsible
Care, ISO 14001 and Environmental Leadership Program. The American Chemistry website
identifies 100 participating companies in Responsible Care. The population sampled for
Responsible Care is all participating firms with HAPs data reported in the TRI database for years
2007, 2008, 2009. The sample for Responsible Care consists of eighty-two different firms that
met this criterion. The population sampled for ISO 14001 is all participating facilities with ISO
14001 certification and/or in place by year 2007 and with HAPs data reported in the TRI
database for years 2007, 2008, 2009. The sample for ISO 14001 consists of eighty-eight
different firms that met this criterion. Louisiana Department of Environmental Quality identified
88 companies on their Environmental Leadership Program website. Unlike the other VEPs, ELP
has a very diverse roster of companies. For example, a significant number of members consist of
universities, towns, convenience stores, nonprofit organizations, etc. Therefore, the study
examines only those members in similar industries to the other VEPs. The reduction resulted in
a population of 46 firms in similar industries, which makes it the smallest VEP studied. The
population sampled for ELP is all firms with HAPs data reported in the TRI database for years
2007, 2008, 2009. The sample for ELP consists of fifteen different firms that met this criterion.
The EPA’s GHG Inventory form provided the data gathered for Climate Leaders. The
Climate Leaders VEP. The sample for Climate Leaders was all companies with greenhouse
gases emission data reported in the Greenhouse Gases Inventory for years 2007, 2008, 2009.
Fifty-one firms representing separate companies met this criterion.
This analysis employs a comparative approach to test the hypotheses. The study utilizes
the percent change formula to analyze the emission data for the years 2007-2009. For statistical
significance, Difference of means and proportion tests exam the statistical significance between
Results
Again, the change in emissions from 2007-2009 is the primary indicator of performance.
Figure 1 shows the average percentage change in emissions for each VEP. First, each VEP has a
net negative reduction in emissions. This suggests that all the programs on average produce
some reduction in emissions. However, it is still unclear how these reductions compare to
non-participating firms.
Figure 1 Average Emission Reduction of VEPs
Second, there is a clear leader amongst the three VEPs in emission reductions. The chart shows
that ELP had the highest reduction in emissions, followed by ISO 14001, Climate Leaders and
Responsible Care. Figure 1 shows that ELP has a -20% average reduction from years
2007-2009. ISO 14001 follows ELP with a -18% reduction, Climate Leaders with a -16% reduction
and Responsible Care with a -12%. The results show that the average emission reduction varies
little amongst all VEPs.
-20% -18%
-16%
-12%
-25% -20% -15% -10% -5% 0%
ELP ISO 14001 Climate Leaders Responsible Care
While this examination of average change in emission is helpful in comparing programs
it does not fully describe the difference between VEPs. The average percent change overlooks
other variation in the distribution of change within the programs. This information can revel if
firms are free riding or shirking in their environmental performance. Histograms of each
program shed some light on this aspect of VEP performance by showing the varying levels of
emission change across facilities. Figures 2-5 below illustrate the frequency of percentage
change amongst the individual firms in each VEP.
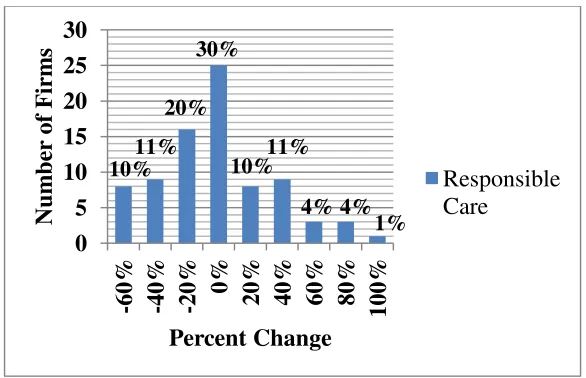
Figure 2 Responsible Care Histogram
Figure 3 ISO 14001 Histogram 0 5 10 15 20 25 30
-60% -40% -20% 0% 20% 40% 60% 80% 100%
N u m b er of F ir m s Percent Change Responsible Care 10% 11% 20% 30% 10%11% 4% 4% 1% 0 5 10 15 20
-60% -40% -20% 0% 20% 40% 60% 80% 100%
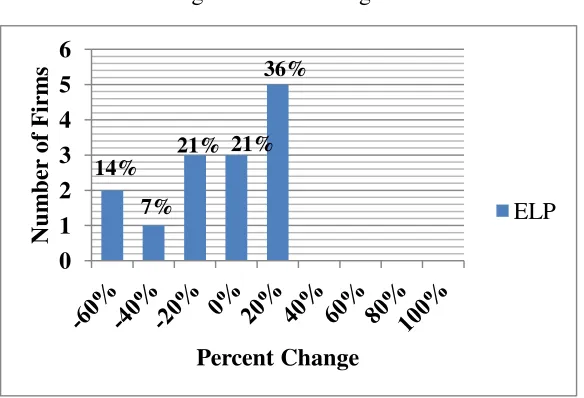
Figure 4 ELP Histogram
Figure 5 Climate Leaders Histogram
The histograms show a precise comparison between the performances of the individual firms in
each VEPs. Negative percent changes represent a reduction in emissions and positive percent
changes reflect an increase in emissions. Figure 1 shows that Responsible Care has eight firms,
which represent 10% of the total sampled population, with emission reductions equal to or
greater than -60%, whereas ISO 14001 in Figure 3 has fifteen firms with emission reductions
equal to or greater than -60%. ELP in Figure 4 has two firms with emission reductions equal to 0 1 2 3 4 5 6 N u m b er of F ir m s Percent Change ELP 14% 7% 21% 21% 36% 0 5 10 15 20 25 30 35
-60% -40% -20% 0% 20% 40% 60% 80% 100%
or greater than -60%. Comparing emission increases reveal significant differences. For
example, Figure 1 shows that Responsible Care has 8 firms with emission increases between 1%
and 20%, whereas ISO 14001 has 15 firms with increases between 1% and 20%. However, ELP
and Climate Leaders have no emission increases greater than 20%.
Figure 2 illustrates that most of the firms in Responsible Care (70%) make an emission
reduction. It also appears that a moderate number of firms made substantial emission increases.
ISO 14001’s histogram in Figure 3 displays both negative and positive percent changes. Like
Responsible Care, a large majority of participating firms made emission reductions (68%), and a
moderate number of firms made substantial emission increases (32%). ELP’s histogram in
Figure 4 reveals that a comparable 64% of firms made emission reductions and 36% made
emission increases. Unlike Responsible Care, ELP and ISO 14001, Climate Leaders’ histogram
illustrates a relatively trivial number of firms with percent increase (6%). It appears that the
majority of the firms (94%) have emission reductions. The number of firms with emission
increases in ISO 14001 and Responsible Care suggest little consistency amongst firms in making
reductions. However, the small number of increases in Climate Leaders suggests a greater
consistency amongst firms in making reductions. Table 3 displays the percentage of firms with
emission increases and decreases in each VEP.
Table 3 Percentages of Firms with Increases and Decreases in Emissions, 2007-2009
Responsible Care ISO 14001 Environmental Leadership Program
Climate Leaders Decrease
Increase
70% (52) 30% (25)
68% (60) 32% (28)
64% (10) 36% (5)
The preceding descriptive data analysis results offer significant information about the
performance of each VEP. It appears that ELP reduces emissions the most, but Climate Leaders
was more consistent in reducing emissions. This analysis shows the performance of the VEPs;
relative to one another, but it does not assess the efficacy of the design features covered in the
Literature Review. The specific hypotheses concerning these design features are as follows:
1.) H1: Sanctioning programs will reduce emissions more than non-sanctioning programs
H0: There will be no difference in emission reductions between sanctioning programs and
non-sanctioning programs
2.) H1: Programs with reduction targets will reduce emissions more than programs
without reduction targets
H0: There will be no difference in emission reductions between programs with reduction
targets and programs without reduction targets.
The results of the preceding descriptive analysis offer evidence that some programs
outperform the others in reducing emissions. However, the data spread in each VEP suggest that
further analysis of the differences in means is necessary. Differences of means tests examine the
differences across VEPs. To test the effects of sanctioning and reduction targets on program
performance the study employs a difference of means test on the combined means of programs
with sanctioning (Climate Leaders) and those without and programs with reduction targets
(Climate Leaders and ELP) to those without. Tables A-1 through A-6 in Appendix A present the
results of the difference of means test for all VEPs.
The statistics of most interest are the one-tail p values for each comparison. All the
between the means of the programs. Furthermore, the results in Tables A-1, A-2, A-3 can
answer hypothesis 1 because Climate Leaders is the only VEP with sanctioning. However, the
t-test results mean we cannot reject the null hypothesis in hypothesis 2. Thus, there is no
statistical significance between the difference in means of programs with sanctioning and those
without. The results show there is no significant differences in the performances of these VEPs,
despite the variation in their design features.
To more directly test the effects of sanctioning and reduction targets, a difference in
means test examines on the combined means of the programs without sanctioning in comparison
to the one program with sanctioning (Climate Leaders) and the combined means of programs
without reduction targets in comparison to those with explicit targets (Climate Leaders and ELP).
Tables A-7 and A-8 present the differences in combined means test.
The tables show a p-value greater than the alpha level .05. The results show that there is
no statistical significance between the differences in combined means of programs without
sanctioning to Climate Leaders; and there is no statistical significance between the differences in
combined means of programs without explicit reduction targets and Climate Leaders and ELP.
Therefore, I cannot reject the null hypothesis in each hypothesis.
The results of the t-tests provide a vital analysis of the relationship between the means of
the programs. However, the tests do not address the differences in the distribution of emissions
changes across the four VEPs. To test whether some VEPs and program design features are
more effective in reducing emissions, I examine the proportion of firms in each program that had
a negative percent change in emissions. Tests of proportions can then determine whether the
differences in rates, found in Table 3, are statistically significant; and compare differences in
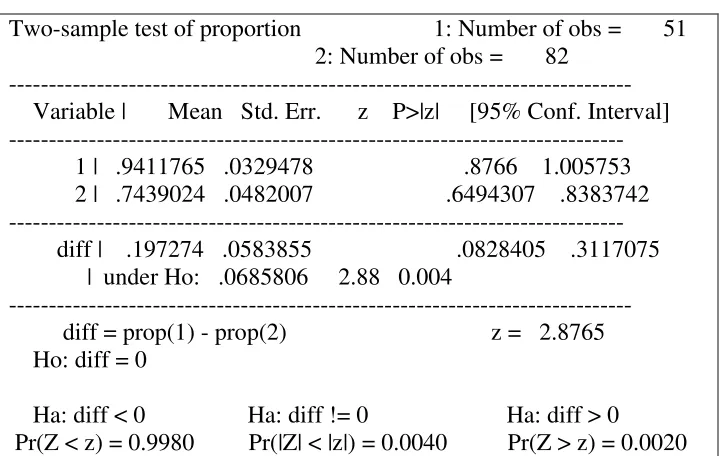
Table 4 Climate Leaders and Responsible Care Test of Proportion
Two-sample test of proportion 1: Number of obs = 51 2: Number of obs = 82
--- Variable | Mean Std. Err. z P>|z| [95% Conf. Interval] --- 1 | .9411765 .0329478 .8766 1.005753 2 | .7439024 .0482007 .6494307 .8383742 --- diff | .197274 .0583855 .0828405 .3117075 | under Ho: .0685806 2.88 0.004
--- diff = prop(1) - prop(2) z = 2.8765 Ho: diff = 0
Ha: diff < 0 Ha: diff != 0 Ha: diff > 0
Pr(Z < z) = 0.9980 Pr(|Z| < |z|) = 0.0040 Pr(Z > z) = 0.0020
Table 5 Climate Leaders and ISO 14001 Test of Proportion
Two-sample test of proportion 1: Number of obs = 51 3: Number of obs = 88
---
Variable | Mean Std. Err. z P>|z| [95% Conf. Interval] ---
1 | .9411765 .0329478 .8766 1.005753 3 | .7272727 .0474757 .634222 .8203234 ---
diff | .2139037 .0577884 .1006406 .3271669 | under Ho: .0696237 3.07 0.002
--- diff = prop(1) - prop(3) z = 3.0723 Ho: diff = 0
Ha: diff < 0 Ha: diff != 0 Ha: diff > 0
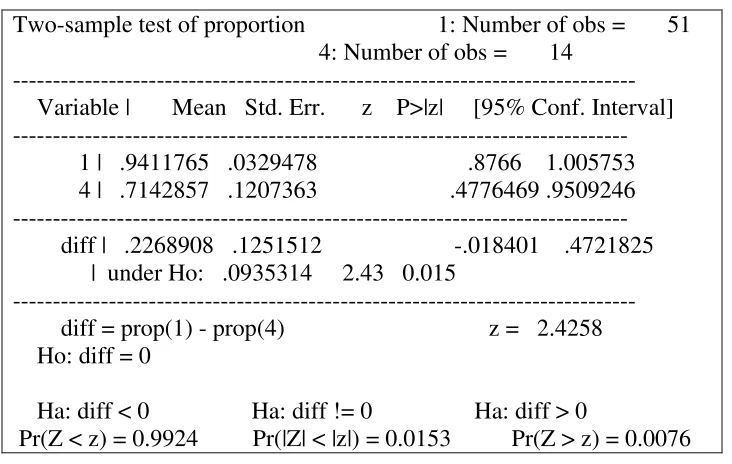
Table 6 Climate Leaders and ELP Test of Proportion
Two-sample test of proportion 1: Number of obs = 51 4: Number of obs = 14
--- Variable | Mean Std. Err. z P>|z| [95% Conf. Interval] --- 1 | .9411765 .0329478 .8766 1.005753 4 | .7142857 .1207363 .4776469 .9509246 --- diff | .2268908 .1251512 -.018401 .4721825 | under Ho: .0935314 2.43 0.015
--- diff = prop(1) - prop(4) z = 2.4258 Ho: diff = 0
Ha: diff < 0 Ha: diff != 0 Ha: diff > 0
Pr(Z < z) = 0.9924 Pr(|Z| < |z|) = 0.0153 Pr(Z > z) = 0.0076
The results of Tables 4-6 show z values greater than 1.96. 1.96 is the Z score found on the z table
for an alpha level of .05. The results can provide some support for hypothesis 1 because Climate
Leaders is the only program with sanctioning. The results show that there is a statistical
significance between the differences in proportions of Climate Leaders and Responsible Care,
ISO 14001 and ELP. Thus, I can reject the null hypothesis in hypothesis 1. Whereas, the results
of Tables A-9, A-10, and A-11 in Appendix A, show z values less than 1.96. Therefore, there is
no statistical significance between ISO 14001 and Responsible Care, ELP and Responsible Care
and ISO 14001 and ELP.
Again, to more directly test the hypotheses regarding design features, difference of
proportions test examine the proportions of the participating firms without sanctioning to firms
with sanctioning (Climate Leaders). Furthermore, difference of proportions tests examines the
(Climate Leaders and ELP). Tables 7 and 8 present the results of the difference in combined
proportions.
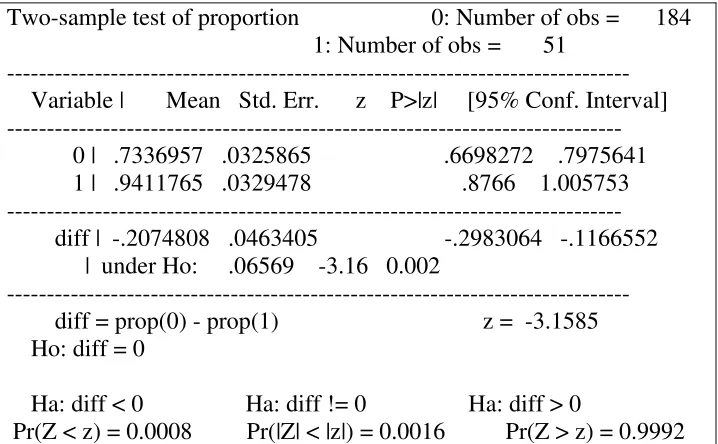
The tables show z values less than -1.96. -1.96 is the Z score on the z table for an alpha
level of .05. Table 7 shows that there is a statistical significance in the differences of proportions
in the combined programs without sanctioning and Climate Leaders. The results mean I can
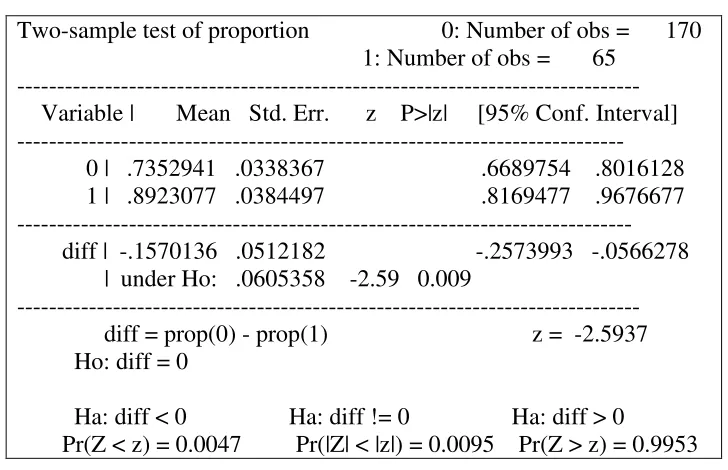
reject the null hypothesis in hypothesis 1. Table 8 shows that there is a statistical significance in
the differences of proportions in the combined programs without reduction targets and Climate
Leaders and ELP. The results suggest that having these design features may have an impact on
the proportion of firms that can effectively reduce emissions.
Table 7 Sanctions Test of Proportion
Two-sample test of proportion 0: Number of obs = 184 1: Number of obs = 51
--- Variable | Mean Std. Err. z P>|z| [95% Conf. Interval] --- 0 | .7336957 .0325865 .6698272 .7975641 1 | .9411765 .0329478 .8766 1.005753 --- diff | -.2074808 .0463405 -.2983064 -.1166552 | under Ho: .06569 -3.16 0.002
--- diff = prop(0) - prop(1) z = -3.1585 Ho: diff = 0
Ha: diff < 0 Ha: diff != 0 Ha: diff > 0
Table 84 Reduction Targets Test of Proportion
Two-sample test of proportion 0: Number of obs = 170 1: Number of obs = 65
--- Variable | Mean Std. Err. z P>|z| [95% Conf. Interval] ---
0 | .7352941 .0338367 .6689754 .8016128 1 | .8923077 .0384497 .8169477 .9676677 ---
diff | -.1570136 .0512182 -.2573993 -.0566278 | under Ho: .0605358 -2.59 0.009
--- diff = prop(0) - prop(1) z = -2.5937 Ho: diff = 0
Ha: diff < 0 Ha: diff != 0 Ha: diff > 0
Pr(Z < z) = 0.0047 Pr(|Z| < |z|) = 0.0095 Pr(Z > z) = 0.9953
The preceding results reveal the differences amongst the VEPs’ data. Table 9 shows the
results of comparing the design features of each VEP. Table 9 illustrates the similarities and
differences between the program design features and program performance.
Table 9 Program Design Features and Program Performance
The table shows multiple similarities and differences between the VEPs. Responsible
Care and ISO 14001 require auditing but no public disclosure of audit findings, whereas, Climate
Leaders and ELP does not require auditing. Responsible Care and ISO 14001 require
certification, but only ISO 14001 and Climate Leaders allow self-certification. Climate Leaders
is the only VEP with some form of sanctioning, which is expulsion for underperformance. ISO
14001 is the only VEP that does not require reporting. Climate Leaders and ELP differs from
Responsible Care and ISO 14001 by encouraging firms to set explicit reduction goals. Program Auditing Certification Sanctioning Reporting Reduction
Targets % Change % of Firms with Reduc. Responsible Care Mandatory-Yes Public Disclosure- No Mandatory-Yes Third Party-Yes Self-No Formal-No Expulsion-No
Yes No -12% 70%
Climate Leaders Mandatory-No Public Disclosure-No Mandatory-No Third Party-Yes Self-Yes Formal-No Expulsion-Yes
Yes Yes -16% 94%
ISO 14001 Mandatory-Yes Public Disclosure- No Mandatory-Yes Third Party-Yes Self-Yes Formal-No Expulsion-No
No No -18% 68%
ELP Mandatory-No Public Disclosure-No Mandatory-No Third Party-No Self-No Formal-No Expulsion-No
The program design features and the data results of each VEP provide greater insight into
each program’s performance. For example, Climate Leaders was the only VEP with consistent
emission reductions and the only VEP to have some form of sanctioning. Considering the
consistency in reductions, Climate Leaders’ data results theoretically supports arguments that
sanctioning controls free riding and shirking and contributes to positive environmental
performance (Rivera, Deleon, & Koerber 2006; Prakash and Potoski 2007 ). Climate Leaders
does not have mandatory certification, which also supports the argument that certification is not
necessarily a prerequisite for positive performance (Andrews, Hutson, and Edwards 2006;
Matthews, 2001).
The data results offer support and alternatives to many arguments about ISO 14001 and
Responsible Care. The striking evidence is the notion of extensive “free-riding” and “shirking”
within ISO 14001 and Responsible Care. The significant number of firms with substantial
emission increases illustrates this. Furthermore, since each VEP reduced total emissions, this is
evidence that underperforming firms actually benefit from the VEP’s overall performance. The
results support that weak programs, as classified by Prakash and Potoski (2007), are still
successful but without sanctioning mechanisms, “free riding” and “shirking” will be more
prevalent. Moreover, Responsible Care and ISO 14001 are the only VEPs that require
mandatory auditing and certification, yet they are still plagued with substantial “free riding” and
“shirking.” This suggests that the arguments that those elements may not be as important as
sanctioning to curb free riding are valid. Responsible Care, which exhibits the free riding
dilemma, requires reporting but lacks any sanctioning mechanisms. Climate Leaders, which
exhibits little “free riding”, also requires reporting but has some form of sanctioning. This is
requiring reporting (found in Responsible Care) the lack of sanctioning mechanisms does not
eliminate free riding.
The analyses of the design features show that Climate Leaders and ELP are the only
VEPs that encourage firms to set reduction targets. ELP is relatively successful but also has a
moderate number of firms with emission increases. This suggests that explicit reduction targets
alone may not curb “free riding” or “shirking”. Though both, ELP and Climate Leaders have
explicit reduction targets, only Climate Leaders has little free riding. This suggests that the
combination of sanctioning mechanisms and reduction targets may influence effectiveness. This
offers an alternative to recent literature, which contends that requiring programs to set
Discussion
This study had two objectives: identifying the ability of VEPs to reduce emissions and
analyzing the effects that various design features have on environmental performance. The
findings of this research both support and offer alternatives to the current literature. First, the
findings reveal that the studied VEPs have the ability to reduce emissions. Second, the findings
show statistical significance between the differences in proportions of programs with sanctioning
and explicit targets to programs without. Third, the study reveals the similarities and differences
of the design features of each VEP. Furthermore, the study offers insights into the effective
combination of features found in effective programs.
This study is not without limitations. There are multiple reasons that may account for the
VEP’s data. Substantial emission increases and decreases outside of the VEPs influence are
possible (e.g., production of new products at the facility, increase in current productions, and/or
use of new equipment). Furthermore, many explanations could account for Climate Leaders’
consistency in emission reductions. Last, the difference in contaminants may explain the
difference in VEP performance.
While the research cannot answer the question of which features determine success, it
does illuminate the design features of effective VEPs. Additional research such as the
examination and comparison of more VEPs, the analysis of program implementation, the
surveying of participants and more features beyond expulsion and reduction targets would
expand this research and offers for future areas for research. Despite future empirical research,
many critics will remain skeptical of VEPs ability to reduce emissions. While literature
design influences their performance. Continued research and improvement in the institutional
design of VEPs are necessary for them to be a viable instrument over command and control
policies. Despite the criticisms, VEPs are most likely here to stay.
The central implication offered from this research is that the viability of VEPs, as a
policy instrument, depends on their institutional design. A strategic design is necessary to foster
pollution reduction and control underperformers through enforcement mechanisms. The results
of this study suggest a combination of sanctioning and explicit reduction targets may influence
program performance and control underperformers. The study offers implications for the future
of VEPs, government and environmental policies. Although, arguments are valid about the
influence of sanctioning critics and scholars cannot expect VEPs to do it independently. Instead,
governments must bridge the gap between voluntary efforts and existing government policies.
VEPs should not continue to function outside of enforcement features. Mandating these features
through government is necessary to ensure program performance. Despite the voluntary nature
of the programs, firms receive significant benefits such as tax breaks and lax regulation for their
participation. Thus, if governments legally allow these benefits then they should legally enforce
these features. Despite the mandates, VEPs will remain voluntary because government
regulation does not require VEP membership as a requirement of environmental compliance.
Furthermore, the mandates will help control free riding and shirking firms by deterring them
Bibliography
About Air Toxics . 2010. http://www.epa.gov/ttn/atw/allabout.html (accessed March 2011).
Alberini, Anna, and Kathleen Segerson. "Assessing Voluntary Programs to Improve
Environmental Quality." Environmental and Resource Economics 22, no. 1-2 (2002): 157-184.
Andrews, R.N.L., A.M. Hutson, and D. Edwards Jr. "Environmental Management under Pressure How do Mandates Affect Performance?" In Leveraging the Private Sector: Management
Strategies for Environmental Performance, by Cary Coglianese and Jennifer Nash.
Washington, DC: Resources for the Future Press, 2006.
Arora, Seema, and Timothy N. Cason. "Why Do Firms Volunteer to Exceed Environmental Regulations? Understanding Participation in EPA's 33/50 Program." Land Economics 72, no. 4 (1996): 413-432.
Benefits of Becoming a Partner. 2011. http://www.epa.gov/partners/benefits/index.htm (accessed
November 2011).
Cambridge Dictionaries Online. 2011. http://dictionary.cambridge.org/ (accessed 2011).
Carmin, JoAnn, Nicole Darnall, and Joao Mil-Homens. "Stakeholder Involvement in the Design of U.S. Voluntary Environmental Programs: Does Sponsorship Matter?" Policy Studies
31, no. 4 (2003): 527-543.
Climate Leaders. 2011. http://www.epa.gov/climateleaders/ (accessed March 2011).
Daley M., Dorothy. "Voluntary Approaches to Environmental Problems:Exploring the Rise of Nontraditional Public Policy." The Policy Studies Journal 35, no. 2 (2007): 166-177.
Darnall, Nicole, and Joann Carmin. "Greener and Cleaner? The Signaling Accuracy of U.S. Voluntary Environmental Programs." Policy Sciences 38, no. 2/3 (2005): 71-90.
Darnall, Nicole, and Stephen Sides. "Assessing the Performance of Voluntary Environmental Programs: Does Certification Matter?" Policy Studies 36, no. 1 (2008): 95-117.
Darnall, Nicole, Matthew Potoski, and Aseem Prakash. "Sponsorship Matters: Assessing
Business Participation in Government-and Industry-Sponsored Voluntary Environmental Programs." Journal of Public Administration Research and Theory, 2009: 283-307.