University of New Orleans Theses and
Dissertations Dissertations and Theses
12-15-2007
Language Dysfunction in Traumatic Brain Injury While Controlling
Language Dysfunction in Traumatic Brain Injury While Controlling
for Effort
for Effort
Matthew T. Heinly
University of New Orleans
Follow this and additional works at: https://scholarworks.uno.edu/td
Recommended Citation Recommended Citation
Heinly, Matthew T., "Language Dysfunction in Traumatic Brain Injury While Controlling for Effort" (2007). University of New Orleans Theses and Dissertations. 610.
https://scholarworks.uno.edu/td/610
This Dissertation is protected by copyright and/or related rights. It has been brought to you by ScholarWorks@UNO with permission from the rights-holder(s). You are free to use this Dissertation in any way that is permitted by the copyright and related rights legislation that applies to your use. For other uses you need to obtain permission from the rights-holder(s) directly, unless additional rights are indicated by a Creative Commons license in the record and/ or on the work itself.
This Dissertation has been accepted for inclusion in University of New Orleans Theses and Dissertations by an
Language Dysfunction in Traumatic Brain Injury While Controlling for Effort
A Dissertation
Submitted to the Graduate Faculty of the University of New Orleans
in partial fulfillment of the requirements for the degree of
Doctor of Philosophy In
Applied Biopsychology
by
Matthew T. Heinly
B.S., Kutztown University of Pennsylvania, 1996 M.S., University of New Orleans, 2003
ii
iii
Table of Contents
List of Figures ... v
List of Tables ... vi
Abstract ... vii
Introduction ... 1
Traumatic Brain Injury ... 2
Neuropathology ... 3
Diagnosis ... 8
Cognitive and Neuropsychological Effects... 12
Effort ... 15
Assessing Effort ... 15
Controlling for Effort ... 17
Language Deficits ... 21
Language and Traumatic Brain Injury ... 21
Hypotheses... 24
Methods ... 25
Participants ... 25
Traumatic Brain Injury ... 25
Mild TBI groups ... 25
Moderate/severe TBI groups ... 26
Neurologic Control Groups ... 26
Left Hemisphere Stroke group ... 27
Dementia group ... 27
Tests/Variables ... 27
Classification Variables... 27
Dependent Variables ... 28
Effort Validation Tests... 28
Language Measures ... 29
Procedure ... 32
Analysis ... 33
Results ... 34
Demographics ... 34
Injury Characteristics ... 35
Effort Validation ... 37
Group Analyses ... 40
Effect of Effort vs Injury Severity ... 43
Impairment ... 44
Effect of Effort and Severity on Impairment ... 47
Outlier Analyses ... 47
Good Mild TBI ... 48
Moderate/Severe TBI ... 51
Diagnosed Malingering ... 54
Discussion ... 55
Effect of Severity ... 56
iv
Implications of the Findings ... 61
Limitations ... 62
Summary ... 63
References ... 65
v
List of Figures
vi List of Tables
Table 1………10
Table 2………32
Table 3………35
Table 4………36
Table 5………37
Table 6………40
Table 7………41
Table 8………42
Table 9………44
vii Abstract
The present study included three traumatic brain injury (TBI) groups (good effort
mild TBI, poor effort mild TBI, and good effort moderate/severe TBI) and two neurologic
control groups (dementia and unilateral left hemisphere stroke). Language impairment
was examined using the following measures: Wechsler Adult Intelligence Scale-III
Verbal Comprehension Index and the Vocabulary, Similarities, Information, and
Comprehension subtests; the Boston Naming Test; the Phonemic and Semantic cue
conditions of the Controlled Oral Word Association Test; the Auditory Comprehension
subtest of the Cognistat; Wide Range Achievement Test-3 Reading subtest; and the
Peabody Picture Vocabulary Test. When effort was controlled, there was a significant
effect of injury severity on language impairment. Poor effort and diagnosable
malingering were responsible for most of the neuropsychological test evidence of
language impairment in mild TBI.
1
FOR EFFORT
Introduction
Traumatic brain injury has a documented course of recovery that follows a
temporal and severity gradient, which has been seen in animal models at the neural
level and in humans on neuropsychological evaluations. Patients with the mildest
injuries recover within the first three months post-injury and should not have persistent
cognitive problems, while residual problems may be present in moderate-severe TBI
patients.
Some clinicians have accepted symptom presentation as evidence of
impairment. The nature of neuropsychological measures is such that it requires the
patient to have intact capacities, but also relies on the patient to put forth effort. This
means that if someone intentionally or unintentionally puts forth poor effort, the results
of the evaluation are not a true indication of that patient’s capacities. As a response to
this problem, measures and techniques have been developed to assess effort. Some
hold the position that if effort is not controlled in clinical and research settings, it is
impossible to truly understand the findings.
There have been some studies that have put this into practice in traumatic brain
injury and revealed that when effort is controlled, cognitive impairment is directly
associated with injury severity in a dose-response relationship. Despite the mounting
evidence in support of this position, some have reported persisting language impairment
2
study to examine the effect of traumatic brain injury on language impairment while
controlling for effort.
Traumatic Brain Injury
Thurman, Alverson, Dunn, Guerrero, and Sniezek (1999) define traumatic brain
injury as: “an occurrence of injury to the head (arising from blunt or penetrating trauma
or from acceleration-deceleration forces) that is associated with symptoms or signs
attributable to the injury: decreased level of consciousness, amnesia, other neurological
or neuropsychological abnormalities, skull fracture, diagnosed intracranial lesions—or
death” (p. 603). In penetrating head injuries (PHI) some sort of high velocity missile or
sharp object has penetrated the skull and meninges and directly damaged the brain
itself (for a review on PHI see Hannay, Howieson, Loring, Fischer, & Lezak, 2004). It
has been reported that 41% of survivors die within 48 hours in medical care (Zafonte,
Wood, Harrison-Felix, Valena, & Black, 2001). Penetrating injuries are relatively rare in
civilian populations where brain trauma is usually considered “closed” and is due to
blunt force.
Unlike brain injuries that have penetrated the cranial cavity, closed traumatic
brain injuries are caused by some blunt force that has been applied to the head of an
individual by way of contact forces, which are direct impacts to a relatively non-moving
head, or inertial forces, which are related to a moving head that impacts a stationary
object (Hannay et al., 2004). For the remainder of the paper, all references to traumatic
brain injury will be closed TBI, unless specified. Contact forces cause trauma directly to
the brain if the skull is molded inward and there may also be damage related to
3
traumatic force may be dissipated, but the fracture itself may result in distributed
damage and a higher risk for infection. Inertial forces include translational acceleration
forces, which relates to linear movement of the head and brain, rotational acceleration
forces, which describe the rotational movement of the brain around its center of gravity,
and angular acceleration, which is a combination of translational and rotational
acceleration, and is most often seen in impacts of the head, when the head and neck
are moving, which is typical in motor vehicle accidents (Hannay et al., 2004).
Neuropathology
There is evidence for both focal and diffuse injuries as a result of traumatic brain
injuries. Focal injuries will be discussed first. The primary injury that may occur as a
result of the application of traumatic forces to the skull is usually in the form of a
contusion (Gaetz, 2004; Hannay et al., 2004). Another type of direct damage is in the
form of a laceration, which may tear the pia mater or arachnoid. The two basic types of
contusions are: the coup, which is located at the point of impact, and the contrecoup,
which involves nonadjacent tissue and does not necessarily have to be opposite to the
coup injury (Gaetz, 2004). These contusions are most often seen at the crests of the
gyri, and the location of these contusions are most frequently found in the temporal
poles, inferior and lateral surfaces of the temporal lobes, cortex above the Sylvian
fissure, frontal poles, and the orbitofrontal cortex (Gennarelli & Graham, 1998; Hannay
et al., 2004; Levin, Williams, Eisenberg, High & Guinto, 1992). These focal contusions
are usually the result of the brain striking the bony protuberances of the interior of the
skull during rapid deceleration injuries like those often seen in motor vehicle accidents
4
Direct physical trauma can also disrupt or damage blood vasculature in the brain.
The hemorrhagic effects may cause either a tumor-like mass, which may exert pressure
on surrounding brain tissue (Hannay et al., 2004), or it may lead to ischemic effects due
to a lack of blood flow (Gennarelli & Graham, 1998).
The secondary effects of the injury are the resultant physiological processes,
which may do more harm than the primary trauma (Hannay et al., 2004). The two
secondary effects considered to be the most dangerous are ischemia and edema
(Gaetz, 2004). Ischemia is reduced cerebral blood flow, which is not sufficient enough
to meet the acute metabolic needs of brain tissue with resulting neuronal necrosis
(Bullock, Maxwell, Graham, Teasdale & Adams, 1991; Hannay et al., 2004; Muizelaar,
1996; Obrist & Marion, 1996). Graham, Adams, and Doyle (1978) had illustrated the
severity of ischemia, when they reported that 91% of fatal severe TBI patients had
histological evidence of ischemia. Ischemia has an indirect effect in adjacent brain
tissue. It leads to hypoxia-related depolarizations, which increase glutamate to
neurotoxic levels due to excessive release, decreased uptake, and a positive feedback
loop that is fed by an increase in the influx of calcium, which leads to further glutamate
release (Choi, 1988; Gaetz, 2004; Gennarelli, 1993). Edema is also potentially fatal. If
the swelling is great enough to cause a brainstem level herniation, life functions would
cease (Gaetz, 2004). In 1975, Fishman delineated two primary types of edema:
vasogenic, which is related to failures of the blood brain barrier; and cytotoxic, which
involves intracellular swelling as a result of hypoxia (Bullock et al., 1991; Fishman,
1975), increases in extracellular excitatory neurotransmitters like glutamate and glycine
5
deformations of the neuronal membrane. This last cause of cytotoxic edema leads to a
massive efflux of intracellular potassium ions, which causes subsequent astrocyte
swelling and damage, because the supportive glial cells are trying to maintain the
appropriate levels of ion concentrations in their vicinity (Schroder, Muizelaar, Bullock,
Salvant & Povlishock, 1995).
The same acceleration/deceleration forces responsible for the focal lesions (both
primary and secondary effects) described above have long been associated with white
matter degenerative changes (Oppenheimer, 1968; Strich, 1956, 1961). The
degenerative changes are often called diffuse axonal injury (DAI) and it has been
described as torn axons, retraction balls (extruded axoplasm that has leaked out of the
severed segments of an axon), and swelling of the damaged axons is often reported
(Hannay et al., 2004; Strich, 1961). Iverson (2005) stated that the term DAI is being
phased out for the more favorable term, traumatic axonal injury (TAI).
Research over the past two decades has accumulated, which suggests that the
original conception of DAI or traumatic shearing of neurons (primary axotomy) is not
complete. This new research has introduced the idea that most damage is technically
secondary axotomy, which is a process that occurs over hours and days after the injury
and is not unlike the physiological processes tied to the secondary effects of focal
injuries (Maxwell, Watt, Graham & Gennarelli, 1993). Gaetz (2004) provides a thorough
review describing the time-course and the process, which is initiated by the
acceleration/deceleration forces of an analogously mild injury. In this review, the author
describes how secondary axotomy creates the same retraction balls, swelling, and torn
6
changes were related to a time-course demonstrated in animal models and human
cadavers. One other interesting contribution from this research following the effects of
brain injury over time is the fact that torn axons do not necessarily lead to dead neurons
(Singleton, Zhu, Stone & Povlishock, 2002), and some axonal separation has been
followed by regenerative actions (Mandolesi, Madeddu, Bozzi, Maffei & Ratto, 2004;
Povlishock & Becker, 1985; Yaghmai & Povlishock, 1992).
All of the previous literature accepts the fact that mechanical strain is the cause
of axonal injury, but the question arises as to how much injury. Gennarelli (1996)
addressed this directly when he varied the amount of mechanical strain on neurons, and
noted that there were four stages of traumatic axonal injury. Mild strain forces lead to
Stage I damage, which involves transient ionic changes, which lead to imbalances that
impair the neuron’s ability to create and maintain action potentials. This is a temporary
effect that resolves within minutes. Strains of slightly greater force lead to Stage II TAI,
which initiates an extreme level of ionic imbalances, which is also temporary, but may
lead to secondary axotomy in very few cases. Even greater mechanical strain leads to
Stage III damage, which also has ionic imbalances, but it involves an irreversible influx
of calcium, whose negative effects were described above. Mechanical strains, that are
greater than the previous three levels, cause Stage IV damage, which is actual primary
axotomy.
Gaetz (2004) summarized the literature supporting the classic view that the
brainstem is often damaged leading to posttraumatic losses of consciousness. An
opposing view that is receiving increasing support was first posited by Ommaya and
7
necessarily tied to damage or disruption of the brainstem alone. They felt that
alterations or loss of consciousness could be explained in a graded fashion with mild
traumatic forces causing mechanical strains only at the cortical level and more severe
forces affecting deeper structures. Kallakuri, Cavanaugh, Özaktay and Takebayashi
(2003) and Saatman, Graham, and McIntosh (1998) both demonstrated in rat models of
TBI that the level of impact force is directly related to the depth of neuronal injury. Thus,
a mild injury might result in a mechanical strain that may cause a transient disruption of
cortical areas, which would result in an alteration or short loss of consciousness, but
definitely not affect the brainstem. A severe injury could potentially cause damage as
deep as the brainstem, and, hence, would result in a coma and irreversible damage.
According to this model, Ommaya and Gennarelli (1974) made a particularly interesting
prediction, that someone without a loss of consciousness may have cognitive symptoms
like confusion and disruption of memory processes, but no one could have a loss of
consciousness without acute cognitive symptoms.
In summary, the amount of force applied to the skull, whether it is in the form of
an acceleration injury or a deceleration injury, is related to the severity of the injury.
Greater forces lead to greater pathology. Mild forces affect cortical areas only with
minimal disruption of consciousness, and may cause enough mechanical strain to
disrupt neuronal processes temporarily with rapid resolution of functioning as the norm.
Greater forces that may lead to more severe traumatic brain injuries are more likely to
create lesions that are greater in size, and are more likely to have ischemia and edema.
These forces affect cortex and underlying structures with the possibility of disruption of
8
neurons is also much greater and may result in long-term temporary changes or
necrotic processes.
Diagnosis
The severity of a traumatic brain injury is defined by its acute neurological
characteristics. These are usually recorded by ambulance or other emergency
personnel (Alexander, 1995). Dikmen, Machamer, Winn and Temkin (1995)
summarized these acute characteristics: depth of coma (Alexandre, Colombo,
Nertempi, & Benedetti, 1983; Dikmen, McLean, Temkin, & Wyler, 1986; Levin et al.,
1990), length of coma (Dacey et al., 1991; Dikmen, Machamer, Temkin, & McLean,
1990; Dikmen, McLean, & Temkin, 1986; Levin et al., 1990), mass lesions (Alexandre et
al., 1983), non-reactive pupils (Levin et al., 1990), and conditions indicative of central
nervous system complications, such as, posttraumatic hydrocephalus or cardiac arrest
(Dikmen et al., 1995). Posttraumatic amnesia is also another acute indicator of injury
severity (Hannay et al., 2004). The Mild Traumatic Brain Injury Committee of the Head
Injury Interdisciplinary Special Interest Group of the American Congress of
Rehabilitation Medicine (1993) specifically addressed criteria for the diagnosis of mild
TBI, which included some of the above criteria and the addition of loss of
consciousness.
The depth of coma is most commonly assessed using the Glasgow Coma Scale
(GCS; Teasdale & Jennett, 1974), which measures the depth of coma by assigning a
numerical value to a patient’s level of responding in three different modalities: eye
opening, motor activity, and verbal communication. GCS scores range from three to 15
9
less are in a coma, and over 50% of all patients with a GCS of eight are also in a coma
(Jennett & Teasdale, 1977). GCS scores greater than 12 are considered to reflect mild
injury.
Posttraumatic amnesia (PTA) occurs in the acute phase following a traumatic
brain injury, which starts with the onset of the injury, includes the coma state (if
present), and usually lasts approximately four times as long as the coma itself (Brooks,
1989, as cited in Hannay et al., 2004). During PTA, the patient may be responsive, but
he is confused and disoriented with an inability to encode new memories (Sherer &
Madison, 2005). PTA is over when the patient exhibits continuous registration and
encoding, which may be particularly difficult to determine in patients with aphasic
features (Gronwall & Wrightson, 1980). In acute care and inpatient settings, patients
may be continuously monitored and given serial assessments of orientation (Sherer &
Madison, 2005).
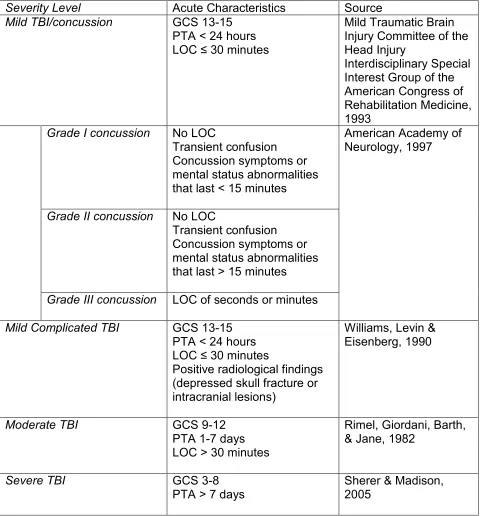
Using these characteristics, brain injury severity has been divided roughly into
three levels. Mild TBI or concussion has been defined by: 1) posttraumatic amnesia
(PTA) not greater than 24 hours; 2) after 30 minutes, an initial Glasgow Coma Scale
(GCS) of 13-15; 3) loss of consciousness of 30 minutes or less [See Table 1]. Just over
a decade later, the WHO Collaborating Centre for Neurotrauma Task Force on Mild
Traumatic Brain Injury provided an operational definition for mild TBI, that is basically
the same as the preexisting definition with the following addition: “These manifestations
of MTBI must not be due to drugs, alcohol, medications, caused by other injuries or
treatment for other injuries (e.g. systemic injuries, facial injuries or intubation), caused
10
conditions) or caused by penetrating craniocerebral injury” (Carroll, Cassidy, Holm,
Kraus, & Coronado, 2004, p. 115). It has been reported that 72-80% of all TBIs are of a
mild severity (Kraus & Arzemanian, 1989; Kraus & Nourjah, 1988).
Table 1 (TBI severity criteria).
Severity Level Acute Characteristics Source
Mild TBI/concussion GCS 13-15 PTA < 24 hours LOC ≤ 30 minutes
Mild Traumatic Brain Injury Committee of the Head Injury
Interdisciplinary Special Interest Group of the American Congress of Rehabilitation Medicine, 1993
Grade I concussion No LOC
Transient confusion Concussion symptoms or mental status abnormalities that last < 15 minutes
American Academy of Neurology, 1997
Grade II concussion No LOC
Transient confusion Concussion symptoms or mental status abnormalities that last > 15 minutes
Grade III concussion LOC of seconds or minutes
Mild Complicated TBI GCS 13-15 PTA < 24 hours LOC ≤ 30 minutes
Positive radiological findings (depressed skull fracture or intracranial lesions)
Williams, Levin & Eisenberg, 1990
Moderate TBI GCS 9-12
PTA 1-7 days LOC > 30 minutes
Rimel, Giordani, Barth, & Jane, 1982
Severe TBI GCS 3-8
PTA > 7 days
11
Mild TBI or concussion has been further subdivided into different grades
(American Academy of Neurology [AAN], 1997). The AAN defined three different grades
of concussion: Grade I is defined by transient confusion but no LOC and symptoms of
concussion or other mental status abnormalities that resolve within 15 minutes of the
injury; Grade II is defined by transient confusion but no LOC and the concussion
symptoms or mental status abnormalities last more than 15 minutes; and Grade III
involves any loss of consciousness that lasts seconds or minutes.
A subset of TBI patients meet the criteria for mTBI but have acute positive
radiological findings such as depressed skull fracture or intracranial lesions (Borgaro,
Prigatano, Kwasnica, & Rexer, 2003; Dikmen, Machamer & Temkin, 2003; Williams,
Levin & Eisenberg, 1990) [See Table 1]. These cases have been referred to as mild
complicated (Williams et al, 1990). There is some evidence that this group has a
neuropsychological outcome more like moderate TBI (Dikmen et al., 2003; Williams et
al., 1990).
Moderate TBI is characterized by GCS scores of 9-12 (Sherer & Madison, 2005),
LOC greater than 30 minutes, and/or PTA of 1 to 7 days. Severe TBI is characterized
by GCS scores of 3-8 (coma), a period of unconsciousness of greater than one hour,
and/or PTA of 7 or more days. Moderate and severe TBIs each comprise
approximately 10% of all traumatic brain injuries (Hannay et al., 2004; Kraus, McArthur,
Silverman, & Jayaraman, 1996). In the extant literature it is common for these two
severity levels to be combined into one moderate/severe TBI group because
researchers often have a limited number of severe cases. See Table 1 for details of the
12 Cognitive and Neuropsychological Effects
The last several years have seen the publication of several large-scale qualitative
and meta-analytic reviews of the literature that have served to consolidate the findings
from the best science on the cognitive and behavioral effects of TBI, particularly mild
TBI. The large literature on cognitive, neuropsychological and behavioral effects of TBI
was summarized by Schretlen and Shapiro (2003) in their extensive meta-analysis.
Although they examined over 2000 published articles on TBI, most had significant
methodological flaws and only 39 met inclusion criteria for the meta-analysis. They
found no significant effect of mTBI at 90 days post-injury (effect size = -.04), but the
effect of moderate-severe TBI two years post-injury was still large (effect size = .84).
More review articles have focused specifically on mild traumatic brain injury. In
their qualitative review of prognosis in mild TBI, the World Health Organization’s Mild
TBI Task Force (Carroll, Cassidy, Peloso, et al., 2004) consistently found that although
cognitive deficits may be present within the first few days following the mTBI, these
deficits are largely resolved within the first three months post-injury. These conclusions
are consistent with the nearly 20 year old findings of Binder (1986).
Two meta-analytic studies have examined the neuropsychological and cognitive
effects of mild traumatic brain injury and those results are consistent with the qualitative
reviews. Binder, Rohling, and Larrabee (1997) demonstrated that mild TBI did not
produce a clinically significant effect on neuropsychological measures at three months
post-injury. Binder et al. (1997) concluded that “the clinician assessing a case of MHT
(mild head trauma) is more likely to be correct when diagnosing no brain injury and less
13
Belanger, Curtiss, Demery, Lebowitz and Vanderploeg (2005) conducted a more
recent meta-analysis, breaking down their results by cognitive domain and the particular
type of sample. Like the other reviews, the results for unselected sample studies
demonstrated no significant effect of mTBI on neuropsychological tests after 3 months.
They found larger effect sizes for samples that included patients in litigation and
determined that when neuropsychological impairment was present beyond three
months, it was most likely due to litigation, poor effort, and/or malingering.
Rees (2003) stated that neuropsychological evaluation may be of value to
objectively assess subjective cognitive complaints and warned that deficits observed on
neuropsychological assessments are not specific to mTBI. He pointed out that
injury-related factors (e.g. pain, stress, lack of sleep, and mood disturbances), pre-morbid
psychological problems, learning difficulties, previous head injuries, and
motivation/effort issues could also produce similar profiles. Iverson (2005) integrated
data from a number of studies and demonstrated the relative effect sizes related to TBI
(different severities and time since injury) compared to the effects of psychiatric illness,
medications/drugs of abuse, and litigation/effort/malingering. The effect of mild TBI was
often the smallest reported.
Regarding the methodology of many mTBI studies, Larrabee (2005) stated that
the weakest designs involve clinical samples of convenience. He illustrated the strength
of a prospective TBI vs. orthopedic control study (Dikmen et al., 1995) by contrasting it
to two non-prospective studies that employed TBI vs. normal control designs (Guilmette
& Rasile, 1995; Leininger, Gramling, Farrell, Kreutzer, & Peck, 1990). Larrabee (2005)
14
non-prospective studies would be interpreted as significant effects of mild traumatic
brain injury, while the prospective study demonstrates no effect at all for mTBI.
Larrabee (2005) implies that due to the strength of the methodology, the Dikmen et al.
(1995) results are more plausible, and it is possible that the effect sizes found for the
other two studies may be explained by other factors such as motivational factors.
Larrabee (2005) further notes that the Leininger et al. (1990) study had very unequal
numbers of non-litigating vs. litigating subjects and did not report mean and standard
deviation information for these two groups, so a pattern cannot be discerned. In the
Guilmette and Rasille (1995) study, Larrabee (2005) points out that they had employed
symptom validity tests (described below) to screen the subjects, but did not use the
symptom validity test performance to control for any effects seen between patients and
normal controls.
The Dikmen et al.’s (1995) study is important due to the strength of the
methodology. The independent variables in their study were measures that determine
the level of severity of injury. The primary independent variable was length of coma,
which was defined as the time it took to follow commands post-injury. This variable
divided the TBI group into six different groups. Dikmen et al. (1995) administered a test
battery that included the Halstead-Reitan Neuropsychological Test Battery and other
neuropsychological measures, which served as the dependent variables. The cognitive
domains assessed included: motor functioning, attention/concentration, flexibility,
quickness, memory, and global verbal and performance skills (verbal and performance
IQs). The relationship between these different groups and performance on the
15
found a dose-response relationship between time to follow command (length of coma),
which is related to injury severity, and the performance on the following
neuropsychological measures: the Halstead-Reitan Neuropsychological Test Battery
(Reitan & Wolfson, 1993), the Wechsler Adult Intelligence Scale-Revised (Wechsler,
1981) and the Wechsler Memory Scale-Revised (Wechsler, 1987).
In summary, the cognitive effects of a moderate to severe TBI will improve over
the first two years, but, in many of these patients there will still be lingering effects that
differentiate their neuropsychological test performance from normative groups. In
contrast, there is consistent agreement that the brain impairment related cognitive
effects of mild traumatic brain injury should be resolved by three months post-injury at
the latest. The only exception for mild TBI is the subset of mild complicated injuries.
Thus, with mild TBI there is an acute period wherein brain impairment related symptoms
are seen and after this period persistent brain related impairment is not expected.
Symptoms and deficits present after a year are not reasonably attributed to the direct
neurological effects of mild TBI.
Effort
Assessing Effort
Neuropsychological tests are measures of capacity and thus require full effort for
accurate assessment of cognitive capacity (Bianchini, Mathias, & Greve, 2001).
Clinicians are only slightly better than chance at identifying persons asked to fake
neurological impairment on neuropsychological tests (Heaton, Smith, Lehman, & Vogt,
1978), and the same is true for identifying children instructed to fake neurological
16
wish to appear more impaired can simply not perform at their best on
neuropsychological testing. In response to these concerns, neuropsychologists
developed specific measures to detect effort.
Pankratz (1983) adapted a technique that had originally been used to detect
patients with suspicious symptom presentations to use with persons suspected of
exaggerated memory deficits. This type of measure is a forced-choice measure that
presents a stimulus to the subject, followed by a delay, which is then followed by
presentation of 2 stimuli that the subject will decide which of these was previously
presented. These tests are usually termed symptom validity tests (SVT). The strength
of SVTs is that they require cognitive effort but not cognitive ability, so failure on them is
not a reflection of cognitive deficits but of poor effort (Bianchini et al., 2001). A recent
study demonstrated that poor performance on recognition memory SVTs was indicative
of poor performance on neuropsychological measures in general, as opposed to the
idea that results on recognition memory effort tests may only be applied to other
memory measures (Constantinou, Bauer, Ashendorf, Fisher, & McCaffrey, 2005).
Bianchini et al. (2001) provided a history of symptom validity testing, a
comprehensive list of the literature on SVTs, and a methodology to improve the strength
of SVTs in the context of medico-legal cases. Lynch (2004) summarized measures that
are suitable for determining effort level within the context of neuropsychological
assessments, and specifically focused on measures that were created for the purpose
of determining effort (SVTs). Lynch concluded that all neuropsychological assessments
should include some measure of effort. This sentiment has been reflected in a position
17
another recent article (Iverson, 2006), which both discuss the importance of the
inclusion of SVTs and symptom validity assessment, more broadly, as an ethical
necessity within the context of neuropsychological assessment.
Some of the SVTs with the best validation and empirical support are the Portland
Digit Recognition Test (PDRT; Binder, 1993a, b; Binder & Willis, 1991), the Test of
Memory Malingering (TOMM; Tombaugh, 1996, 1997), the Computerized Assessment
of Response Bias (CARB; Allen, Conder, Green, & Cox, 1997), and the Word Memory
Test (WMT; Green, Allen, & Astner, 1996). Bianchini et al. (2001) summarized the
empirical support for these and other SVTs. Two new papers provide a more current
review and classification accuracy of the PDRT (Greve & Bianchini, 2006a) and the
TOMM (Greve, Bianchini, & Doane, 2006). Both of these papers demonstrated that the
PDRT and TOMM are not affected by more severe TBIs, and that the PDRT may be the
more sensitive of the two tests to poor effort.
Controlling for Effort
Green (2003) proposed that there must be a paradigm shift in
neuropsychological research that addresses the issue of effort. He suggested that
instead of focusing attention squarely on biological variables only, non-biological
variables must also be considered. Green offered the possibility that poor effort may be
responsible for impaired scores in mild TBI patients. He made an important assertion
that if effort is not considered and controlled for systematically it will contaminate test
data at both the single clinical case level and in group studies. This assertion gets at the
18
seems we know one thing, but then when effort is controlled, what we thought we knew
was proven false.
The effect of controlling for effort has been investigated in sensory impairment.
Green and Iverson (2001a) investigated olfactory discrimination in traumatic brain injury
patients with different levels of injury severity while controlling for effort by administering
two SVTs designed to detect exaggeration of cognitive functioning, and used them to
divide the TBI sample into a good effort group and a poor effort group. In the poor effort
group there was no significant correlation between smell test scores and injury severity
level. However, in the good effort group, there was a significant correlation between
injury severity and olfactory impairment.
Green, Rohling, Iverson, and Gervais (2003) also investigated olfactory test
scores in TBI patients. Patients that demonstrated poor effort on the effort tests were
taken out of the data, leaving a good effort only sample. In this study they
demonstrated that olfactory test scores correlated highly with injury severity, and also
that olfactory test scores correlated better with acute injury characteristics than
neuropsychological test scores. In these two studies where effort is controlled for, there
is support for the notion that there is a dose-response relationship between injury
severity and amount of dysfunction, which is reminiscent of Dikmen et al.’s (1995)
findings.
The effect of effort on neuropsychological test performance has also been
investigated. Green and colleagues investigated the effect of effort on a
neuropsychological test battery (Green, Rohling, Lees-Haley, & Allen, 2001). When the
19
this mild TBI group was not better than the severe TBI and neurological diseases
groups. When the poor effort patient data were removed, the severe TBI and
neurological disease groups performed worse than the mild TBI group (as expected). In
this study the authors found that effort explained 53% of the variance in the test battery
data versus 1% each for the acute characteristics (PTA, GCS, and loss of
consciousness).
Binder, Kelly, Villanueva, & Winslow (2003) compared neuropsychological test
performance of three groups of traumatic brain injury patients: mild TBI, financial
incentive, good effort; mild TBI, financial incentive, poor effort; and moderate-severe
TBI, good effort. The poor effort mild TBI group performed worse than the other two
groups on tests of tactile sensory function and recognition memory. The poor effort mild
TBI group was not significantly different from the moderate-severe TBI group on tests of
learning and memory, tests of sensory and motor abilities, and problem solving. The
findings of this study reflect those of the previous study, because they also found that
effort had a stronger effect on some measures than the injury severity level.
Moss, Jones, Fokias, & Quinn (2003) controlled for effort using the TOMM and
correlated the injury severity defined by the length of the PTA with patients performance
on the Wechsler Memory Scale, 3rd edition (WMS-III, Wechsler, 1997a) and the IQ
scores from the Wechsler Adult Intelligence Scale, 3rd edition (WAIS-III, Wechsler,
1997b). Moss et al. found that when effort was controlled a dose response relationship
existed between injury severity and impairment on the administered tests, but no such
relationship existed in the poor effort group. One weakness with this study is that
20
thus eliminating the possibility of detecting persons that had gone on to fail the retention
trial only (Greve & Bianchini, 2006b).
Green (2007) investigated the effect of effort on several common
neuropsychological tests. He stratified his sample based on the level of effort given on
the WMT, a computer-based SVT. He found that there was a dose-response
relationship between the amount of poor effort and the level of impairment on the
various neuropsychological tests.
The effect of controlling for effort has even been investigated in chronic pain. In
a recent study, attention and memory was assessed in pain patients and TBI patients
while controlling for effort (Curtis, Greve, & Bianchini, 2006). Effort measures were
utilized to divide the pain patients into good effort and poor effort groups. The effort
measures were also used to ensure that the TBI group was demonstrating good effort.
The authors found that the good effort pain and good effort TBI groups did not score
significantly different from each other or normative data on most of the measures of
attention and memory. However, the poor effort pain group scored worse than the
normative data, the good effort pain group, and even the good effort TBI group on
measures assessing cognitive domains.
In summary, the SVTs described above are necessary to carry forward the
suggestion of Green (2003) by controlling for effort to elucidate hidden injury
severity-dysfunction correlations. This was demonstrated in a number of studies across different
response domains (olfaction, general cognition, and pain). In the studies described
here, it is clear that by removing or controlling effort, the level of impairment is indicative
21
TBI that don’t control for effort demonstrate? It is possible that the findings up to this
point are not accurate and need to be reexamined. There are many cognitive domains
that deserve attention: memory, attention and concentration, language, problem-solving,
etc. It is not practical to study all of them, so the focus of this particular study will be on
language, which has the greatest historical significance in relation to brain and behavior.
Language Deficits
Language disturbances are commonly reported as a result of neurological
damage. Evidence of this dates back to the Edwin Smith Papyrus in the second
millennium B.C. (Minagar, Ragheb, & Kelley, 2003), which describes a man who
suffered a head injury and lost the ability to speak without paralysis of the tongue.
Thousands of years later, patients are still reporting language deficits as a result of
strokes, traumatic brain injuries (TBI), and other neurological insults. Within the past
century and a half there has been a better understanding of language impairments and
the neurological mechanisms behind them.
Language and Traumatic Brain Injury
Most of the early aphasia literature was concerned with stroke patients
investigated post-mortem. Aphasia is sometimes found in cases of PHI (Ludlow et al.,
1986; Mohr et al., 1980). In fact, the earliest reports of aphasia and other language
disorders resulting from traumatic brain injury included cases of penetrating head
wounds (Goldstein, 1948; Luria, 1970; Russell & Espir, 1961; Schiller, 1947). Like
strokes, a penetrating missile wound produces a fairly focal lesion. Luria (1970)
compared language disturbances in penetrating head injuries and closed traumatic
22
accident. In 1983, Groher reanalyzed Luria’s (1970) results and found that the open
head injuries were associated with greater language deficits that lasted longer than did
those in closed head injured. The focal nature of PHI may be one reason for the higher
prevalence of aphasia in PHI compared to the more diffuse injuries of closed TBI that
have been described above (Marquardt, Stoll, & Sussman, 1988; Murdoch, 1990).
There have been two perspectives on the nature of language impairments in
closed TBI: 1) deficits seen in TBI are aphasia; 2) language impairment following TBI is
caused by general cognitive disorganization as a result of the diffuse nature of these
injuries (Marquardt, Stoll, & Sussman, 1988). Hagen (1984) described the language
deficits in TBI as a consequence of impairment of both linguistic and basal nonlinguistic
cognitive processes.
Language is a cognitive domain like those that have been described in the
context of mild TBI in the sections above. Language as a cognitive domain was
included in one of the previously described meta-analyses. In their meta-analysis,
Belanger et al. (2005) found a significant language effect size (.64) when testing was
done at less than 90 days post-injury but not for greater than 90 days (.20). These
findings reflect what is known about the effect of mild TBI on cognitive domains, namely
that there may be impairment post-acutely, but resolution of problems is expected within
the first few months (Binder et al., 1997; Carroll et al., 2004; Iverson, 2005; Schretlen &
Shapiro, 2003). Belanger et al. (2005) also found that the most commonly used
measures to assess language functioning included the Controlled Oral Word
Association Test (COWAT; Spreen & Strauss, 1998) and the Boston Naming Test
23
It is also worth mentioning that the Dikmen et al. (1995) study that was praised
earlier for its methodology assessed several different neuropsychological areas in TBI
patients at one year post-injury. Unfortunately, the only measure that assessed
language functioning in this set of tests was a global measure of verbal abilities, the
Verbal IQ score (VIQ) from the WAIS-R (Wechsler, 1981). Like many of the other
measures in this study, the VIQ scores also demonstrated the characteristic
dose-response curve when considered across the different severity levels based on time to
follow commands.
Despite this evidence that the resolution of language impairment takes place
within the first few months post-injury, there have been some sources that have
reported language impairment in cases of mild TBI beyond the first few months. The
first study worth mentioning was a study that investigated TBI patients across a broad
range of severity as defined by the range of coma lasting from 15 minutes, which would
be considered a mild TBI, to six months (Sarno, 1984). In this study Sarno found that
all of the patients that had been diagnosed using neuropsychological test data were
impaired on another global language measure. Raskin and Rearick (1996) found that
mTBI patients were more impaired on tests of verbal fluency when compared to normal
controls. This finding was replicated in Mathias and Coats (1999) study. In a
widely-used neuropsychology text (Hannay et al., 2004), there is a brief case report of a patient
with language impairment following a mild TBI (GCS of 14). More recently there has
been a case study of a patient who suffered a mild TBI defined by a GCS of 14 and
LOC of 5 minutes that had multiple impaired scores on neuropsychological language
24
Murdoch, & Bellamy, 2007). All of these studies reporting impairment in mTBI did not
assess effort or mention the possibility of alternative explanations.
In summary, language deficits occur as a result of focal neurological damage.
Early on, aphasia was commonly studied in stroke patients. In traumatic brain injury,
penetrating head injuries have been associated with patterns of language disturbances
similar to the aphasias seen in stroke patients. Some have described aphasias and
aphasia-like symptoms in TBI with anomia being the most frequently reported symptom.
A meta-analytic study that investigated the cognitive effects of mTBI included language
as one of its dependent variables, and found that language impairments may be seen
early after an injury, but like other cognitive domains lasting language impairments are
not expected. There have been some contrary reports of persistent language
impairments in mild TBI after the acute phase. One striking feature about all of these
contrary reports is that none of them had accounted for effort. Thus the purpose of this
study is to address this apparent contradiction between the overall literature on the
cognitive effects of TBI and the specific literature on the effect of TBI on language.
Specifically, this study will examine the effect of TBI as well as other forms of
neuropathology (i.e., stroke and dementia) on performance on clinical measures of
language ability while controlling for the effects of effort in the TBI sample.
Hypotheses
1) In traumatic brain injury patients putting forth good effort, there will be a
dose-response relationship between the injury severity and the amount of impairment on the
language measures; this dose-response relationship will extend to the neurological
25
a) Good effort mild TBI patients will score better than moderate/severe TBI
patients on the language measures.
b) Good effort mild TBI patients will also score better on the language measures
than the neurologic control patients that have been diagnosed with a unilateral
stroke of the left-hemisphere or dementia.
2) Effort will account for more variance than severity.
a) Poor effort mild TBI patients will perform worse than the Good effort mild TBI
patients on the language measures.
b) Poor effort mild TBI patients will perform the same as or worse than
moderate/severe TBI patients and neurologic control patients.
Methods
Participants
Traumatic Brain Injury
This sample consisted of 71 native English-speaking persons who were older
than 18 years of age, but less than 50 years old, and had experienced a blunt force
trauma to the head at least one year prior to the neuropsychological evaluation.
Patients with less than ten years of education or more than 13 years of education were
excluded. Due to the lack of normative data for other races on some of the dependent
variables, only Caucasians and African-American patients were included in the study.
Patients were classified into one of three groups based on injury severity and effort.
Mild TBI groups. Patients were included in the mild TBI groups if they suffered
an independently documented blow to the head (whiplash injuries were not sufficient)
26
Interdisciplinary Special Interest Group of the American Congress of Rehabilitation
Medicine (1993): 1) posttraumatic amnesia (PTA) not greater than 24 hours; 2) after 30
minutes, an initial Glasgow Coma Scale (GCS) of 13-15; 3) loss of consciousness of
approximately 30 minutes or less. Patients with linear skull fractures but no intracranial
findings were included; whereas, patients with intracranial findings or a depressed skull
fracture were excluded. A total of 51 patients met these entry criteria. This mild TBI
group was then classified into Good and Poor effort groups based on the Portland Digit
Recognition Test (PDRT; Binder & Willis, 1991; Binder, 1993) and Test of Memory
Malingering (TOMM; Tombaugh, 1996, 1997) [see sections below for details of this
procedure]. Good effort patients passed both of these tests, while Poor effort patients
failed at least one. This process resulted in a Good effort sample of 30 patients and a
Poor effort sample of 21 patients.
Moderate/Severe TBI group. Patients were included in the moderate/severe TBI
group (m/s TBI), if they suffered an independently documented blow to the head and
met the following criteria for moderate and severe TBI: an initial GCS score less than or
equal to 12, PTA greater than 24 hours, and/or LOC greater than 30 minutes (Rimel,
Giordani, Barth, & Jane, 1982). Twenty patients met these inclusion criteria. All of
these patients were determined to be giving good effort based on the PDRT and
TOMM. A Poor effort m/s TBI group was considered, but only eight m/s TBI patients
that met all other criteria were identified as Poor effort.
Neurologic Control Groups
Two control groups consisting of 57 patients with neurologic conditions (stroke
27
some of the variables, only native English-speaking Caucasians and African-American
patients were included in the study. Patients with less than ten years of education were
excluded.
Left Hemisphere Stroke Group. The left hemisphere stroke group (LHD)
consisted of right-handed persons who were referred for neuropsychological evaluation
after a unilateral left forebrain cerebral vascular accident (CVA). Patients were
excluded if they had incentive, such as pursuing a disability claim. Twenty-five patients
met these inclusion criteria.
Dementia Group. The dementia (DEM) group consisted of persons who were
able to be diagnosed with dementia via neuropsychological assessment independent of
their scores on language measures. Patients were included only if their diagnosis was
either probable Alzheimer’s disease or fronto-temporal dementia. Patients with
vascular-type dementia or subcortical dementias were excluded. Thirty-two patients
met these inclusion criteria.
Tests/Variables
The tests were divided into three types of variables: independent (classification)
variables, validation variables, and dependent variables.
Classification Variables
The following tests were used to determine whether mTBI patients were included
in the Good or Poor effort groups. They were also used to determine if m/s TBI patients
exhibited good effort.
Portland Digit Recognition Test (PDRT; Binder & Willis, 1991; Binder, 1993a, b)
auditorily-28
presented five-digit number strings. The PDRT has 72 items, and is divided into two
sets of 36 items each. The first 36 items are considered the “Easy” items, and the
second 36 items are considered the “Hard” items based on the apparent level of
difficulty. An abbreviated version of the PDRT was sometimes administered, if the
patient demonstrated mastery of the test (Binder, 1993c; Doane, Greve, & Bianchini,
2005). An individual had to obtain a score of 19 or greater on the “Easy” items in order
to qualify for the abbreviated version. If this criterion was met, a score of seven out of
nine or 12 of 18 on the “Hard” items had to be achieved in order to pass the abbreviated
form. Since some of the patients met the abbreviated form criteria, all PDRT
administrations included the “Easy” items but not all of them included every “Hard” item.
Using the published cut-offs of Binder and Kelly (1996), patients with scores of less than
19 on the “Easy”, less than 18 on the “Hard”, or less than 39 on the Total score were
classified as giving poor effort.
Test of Memory Malingering (TOMM; Tombaugh, 1996, 1997) is a three-trial
forced-choice symptom validity test that employs visual recognition of line drawings of
common objects. In the first two trials, 50 items were presented followed by a
two-choice recognition test for each trial. After a delay of 15 minutes, a retention trial was
administered without further training. Patients scoring <45 on Trial 2 or the Retention
Trial were classified as giving poor effort according to the published recommendations
(Tombaugh, 1996).
Dependent Variables
Effort Validation Tests. Reliable Digit Span (RDS; Greiffenstein, Baker, & Gola,
29
Minnesota Multiphasic Personality Inventory-2 (MMPI-2; Butcher, Dahlstrom, Graham,
Tellegen, & Kaemmer, 1989) were used to assess whether the TBI patients were
appropriately assigned to the good or poor effort groups.
The Reliable Digit Span is derived from the WAIS-III Digit Span subtest and it is
calculated by summing the last forward and backward digit strings in which both trials
were completed without error. RDS is an embedded validity indicator that capitalizes on
being perceived as a memory test, however, research has shown that it is unaffected by
brain trauma (Greiffenstein et al., 1994; Heinly, Greve, Bianchini, Love, & Brennan,
2005; Iverson & Franzen, 1996; Iverson & Tulsky, 2003). A score of six or less on RDS
is associated with 39% sensitivity to malingering and a false-positive rate of only 4%
(Heinly et al., 2005). These findings have been replicated in chronic pain (Etherton,
Bianchini, Greve & Heinly, 2005) and toxic exposure (Greve et al., 2007).
The Fake Bad Scale is comprised of 43 MMPI-2 items and is useful in detecting
exaggerated claims of disability particularly in forensic settings. In a meta-analysis of
FBS, Nelson, Sweet, and Demakis (2006) found that FBS had the largest effect size
(.96) of all the MMPI-2 validity scales in groups over-reporting symptoms compared to
comparison groups. The recommended cut-offs for FBS are: > 22 is an indicator of
threatened validity; and >28 is an indicator of invalidity (Ben-Porath & Tellegen, 2007).
Language Measures. The following tests were chosen because they address
different language capacities, such as: comprehension, naming, and reading. They
were also chosen, because of their frequency of use by many neuropsychologists in
clinical and research settings (Rabin, Barr, & Burton, 2005). The most frequently used
30
Scale, 3rd edition (WAIS-III, Wechsler, 1997b), which is where the first five of the
following language measures originate.
1. Verbal Comprehension Index (VCI) is an index score of the WAIS-III, and it is
a general language measure that encompasses verbal conceptualization, expression,
and knowledge. VCI is comprised of the three subsequent subtests.
2. Vocabulary (Voc) subtest assesses the patient’s recall vocabulary. Patients
were visually and verbally presented words and were asked to define them.
3. Information (Inf) subtest assesses the patient’s ability to answer some general
knowledge questions. Patients were presented with questions that address learned
knowledge.
4. Similarities (Sim) subtest assesses the patient’s ability to describe how two
things are alike. Patients were verbally presented with two-word items that increase in
difficulty from concrete to abstract and were asked how they are similar.
5. Comprehension (Comp) subtest assesses verbal reasoning regarding socially
relevant questions and understanding of proverbs. Patients were verbally presented
these different questions.
6. Boston Naming Test 2nd edition (BNT; Kaplan, Goodglass & Weintraub, 1983)
is a confrontation naming test that includes 60 line drawings of objects. If the participant
could not recall the object name directly, the participant was given a semantic cue
followed by a phonemic cue. When phonemic cues were presented, the item was
coded as incorrect, whether the response was correct or not.
7. The Phonemic cue condition (Phon) of the Controlled Oral Word Association
31
presented three different trials, where they were given 60 seconds to produce as many
words that begin with a particular letter with the exception of proper words (ones that
begin with a capital letter) and different forms of the same word (e.g. have, has, had).
8. The Semantic cue condition (Sem) of the COWAT is also a word fluency test.
Patients were administered one trial where they were required to name as many
animals as they could in 60 seconds.
9. The Auditory Comprehension (AC) subtest of the Neurobehavioral Cognitive
Status Examination (Cognistat; Kiernan, Mueller, & Langston, 1995) assesses the
patients’ ability to comprehend and carry out commands. During this subtest, the
examinee was presented with the screening item, which was a simple three-step
command. If the examinee passed the screen a perfect score was recorded. If the
examinee did not pass the screen, the examiner proceeded to read commands ranging
from one to three steps.
10. The Reading subtest of the Wide Range Achievement Test, 3rd edition
(WRAT-3; Wilkinson, 1993) assesses reading recognition ability. Patients were
presented with a card that has 42 words on it, and they were asked to read each word.
The WRAT-3 Reading subtest is often used as an estimate of pre-morbid intellectual
functioning (Ball, Hart, Stutts, Turf, & Barth, 2007; Orme, Johnstone, Hanks, & Novack,
2004).
11. Peabody Picture Vocabulary Test-III (PPVT-III; Dunn & Dunn, 1997) is a
measure that assesses receptive vocabulary. The PPVT-III consists of 204 picture
plates, with four pictures per plate. The examiner read from a word list and the
32
that was read. The PPVT-III is often used to estimate verbal intelligence (Bell, Lassiter,
Matthew, & Hutchinson, 2001; Smith, 1997).
T-scores that were corrected for age, race, sex, and education were calculated
for the WAIS-III scores, the BNT, Phon and Sem of the COWAT. T-scores that were
corrected only for age were calculated for AC using normative data. Standard scores
were calculated for the WRAT-3 Reading subtest and the PPVT using the normative
data that only corrected for age and not for other demographic factors, the most
important of which is education. All of the sources of the normative data used for these
score calculations are listed in Table 2.
Table 2 (Sources of normative data for the language measures).
Test Source
WAIS-III Taylor and Heaton, 2001
BNT
Phonemic and Semantic cues of the COWAT Heaton, Miller, Taylor, and Grant, 2004
Cognistat Auditory Comprehension The Northern California
Neurobehavioral Group, Inc, 1988
WRAT-3 Reading Wilkinson, 1993
PPVT Dunn & Dunn, 1997
Procedure
The data were retrospectively collected from patients seen for
neuro-psychological evaluations at a Southeastern United States
Psychology/Neuropsychology clinic. The tests examined in this study are part of the
routine neuropsychological evaluation for which these patients were referred. With the
exception of the TOMM administered to some dementia patients, these tests were not
included specifically for research purposes. The TOMM was administered to the
33
patients were referred by attorneys, physicians, rehabilitation professionals, or worker’s
compensation case managers. The neurologic controls were referred by physicians or
rehabilitation professionals. Only the TBI patients had external incentive (i.e. worker’s
compensation claims, personal injury lawsuits, etc.). Approximately 500 medical
records were reviewed for the purposes of selecting individuals that met inclusion
criteria and determining the appropriate group assignment.
Analysis
Nominal variables (i.e. gender and race) were analyzed with a Chi-square (Χ2)
analysis. Group effects for continuous variables were examined with univariate
analyses of variance (ANOVAs), and post-hoc comparisons were performed using the
Tukey B procedure. The assumption of homogeneity of variance was tested for all
ANOVAs that were conducted. If the assumption was not met, ANOVAs were still run,
since the ANOVA is robust to violations, and they were followed by a non-parametric
Kruskal-Wallis test to confirm the results of the ANOVA. The ANOVA results were
considered accurate if the group differences were maintained in the non-parametric
procedure. The post-hoc analyses for these analyses were performed using the
Dunnet’s C procedure, because this procedure does not assume homogeneity of
variance.
The dependent language variables were not analyzed with a multivariate analysis
of variance (MANOVA) due to the unequal group sizes across variables. The use of a
MANOVA would have resulted in the exclusion of some of the patient’s test scores, so
multiple univariate ANOVAs were conducted instead to ensure that all scores would be
34
Type 1 error that could occur as a result of conducting multiple ANOVAs. The method
maintained experiment-wise error rates at the desired alpha level while not affecting the
power of the study (Jaccard & Guilamo-Ramos, 2002). The Holm (1979) method is a
step-down Bonferroni-based approach to setting the alpha level. The p values obtained
from the analyses were ordered from smallest to largest. Then, the smallest p value
was compared to an alpha level of .05/k, where k was the number of analyses (11 for
the present study). Each subsequently higher p value was compared to an alpha level
of 0.5/k-1, 0.5/k-2, etc. until there was a non-significant finding.
Results
Demographics
The sample included 30 Good mTBI, 21 Poor mTBI, 20 m/s TBI, 25 LHD, and 32
DEM patients. Some of the LHD and DEM patients were not administered all of the
measures. Table 3 provides the number of patients per group for each test, and Table
4 presents the demographic data.
Demographic variables were statistically analyzed to verify that the groups were
sufficiently matched on these variables. There was a significant group effect for age (F
[4,123] = 109.30, p < .001, partial eta2 = .78) with the m/s TBI group significantly
younger than the Good and the Poor mTBI groups and the LHD group significantly older
and the DEM group older still. There was also a significant group effect for time since
injury (F [3, 92] = 9.28, p < .001, partial eta2 = .23) and education (F [4,123] = 8.37, p <
.001, partial eta2 = .21). On time since injury, the LHD group was seen significantly
earlier post-injury than the TBI groups, and were often seen post-acutely on the hospital
35
Table 3 (Number of patients per group that were administered each measure).
Good m/s Poor LHD Dem
PDRT 30 20 21 0 0
TOMM 30 20 21 0 17
RDS 30 20 21 23 32
FBS 30 20 21 12 13
WAIS-R 0 0 0 10 0
WAIS-III 30 20 21 12 25
BNT 30 20 21 23 30
Phon 30 20 21 25 31
Sem 30 20 21 24 31
Cognistat 30 19 21 23 28
WRAT-3 30 20 21 22 30
PPVT 28 19 19 7 20
Note: Good = good effort mild TBI, m/s = moderate/severe TBI, Poor = poor effort mild TBI, LHD = Left-hemisphere damaged CVA, Dem = dementia; PDRT = Portland Digit Recognition Test, TOMM = Test of Memory and Malingering, RDS = Reliable Digit Span, FBS = Fake Bad Scale, WAIS-R = Wechsler Adult Intelligence Scale-Revised, WAIS-III = Wechsler Adult Intelligence Scale-3rd ed., BNT = Boston Naming Test, Phon = Phonemic cue condition of COWAT, Sem = Semantic cue condition of COWAT, WRAT-3 = Wide Range Achievement Test-3rd ed., PPVT = Peabody Picture Vocabulary Test.
of the TBI groups, which did not differ. The sexes were unequally represented in the
sample (Χ2[4] = 15.61, p < .01) and the same is true of race (Χ2 [4] = 12.58, p < .05).
The same inequality was seen for all groups on both variables with the exception of the
dementia group countering the trend of more males (only 34.4% males). Therefore, the
only demographic variable that the TBI patients differed on was age, and the neurologic
control groups differed in that they were older, more educated, and the LHD patients
were seen earlier in their recovery.
Injury Characteristics
It is also important to verify that the mTBI cases (Good and Poor) differ from the
36 Table 4 (Demographic variables).
Good m/s Poor LHD DEM
m (sd) m (sd) m (sd) m (sd) m (sd)
Age 37.9 (9.0)a 25.5 (6.1)b 37.9 (8.4)a 54.0 (10.8)c 71.3 (8.3)d
Education 11.8 (.8)a 11.7 (1.0)a 11.7 (.8)a 13.8 (3.3)b 13.8 (2.6)b
Time Since Injury (months)
33.8 (16.8)a 38.1 (15.3)a 27.9 (13.3)a 10.0 (29.3)b n/a
% male 70.0 75.0 71.4 76.0 34.4
%
Caucasian
76.7 70.0 76.2 92.0 100
GCS* 14.9a (.3) 5.4b (3.1) 14.8a (.6) - - Note: Good = good effort mild TBI, m/s = moderate/severe TBI, Poor = poor effort mild TBI, LHD = Left-hemisphere damaged CVA, Dem = dementia; m = mean, sd = standard deviation; GCS = Glasgow Coma Scale.
abc
row means with the same letter are not significantly different from each other. * Good n = 19, m/s n = 16, Poor n = 14.
the injury. GCS is a measure of depth of coma, that was not reported for all of the TBI
patients, but it was used to define most of the TBI patients into the appropriate severity
groups (mild vs. m/s). There was a significant group effect for GCS (F [2, 46] = 144.54,
p < .001, partial eta2 = .86), but the Good mTBI and Poor mTBI groups did not differ
from each other (see Table 4). The two mTBI groups did not differ in the frequency of
reported loss of consciousness (LOC; Good mTBI = 38%, Poor mTBI = 27%) or
post-traumatic amnesia (PTA; Good mTBI = 10%, Poor mTBI = 5%). The m/s TBI patients
had 90% of the group with reported LOC and 80% with a PTA (see Table 5).
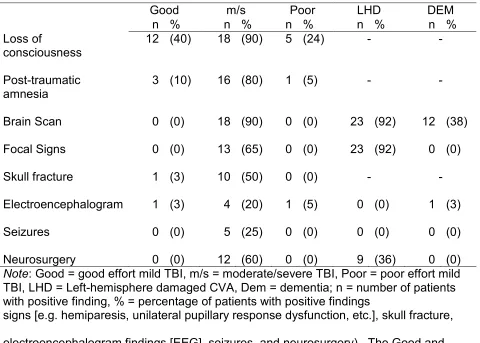
Besides acute characteristics, there are other sources of evidence of potential
neuropathology. Table 5 presents a summary of the number of patients per group that
37 Table 5 (Injury characteristics).
Good m/s Poor LHD DEM
n % n % n % n % n %
Loss of
consciousness
12 (40) 18 (90) 5 (24) - -
Post-traumatic amnesia
3 (10) 16 (80) 1 (5) - -
Brain Scan 0 (0) 18 (90) 0 (0) 23 (92) 12 (38)
Focal Signs 0 (0) 13 (65) 0 (0) 23 (92) 0 (0)
Skull fracture 1 (3) 10 (50) 0 (0) - -
Electroencephalogram 1 (3) 4 (20) 1 (5) 0 (0) 1 (3)
Seizures 0 (0) 5 (25) 0 (0) 0 (0) 0 (0)
Neurosurgery 0 (0) 12 (60) 0 (0) 9 (36) 0 (0)
Note: Good = good effort mild TBI, m/s = moderate/severe TBI, Poor = poor effort mild TBI, LHD = Left-hemisphere damaged CVA, Dem = dementia; n = number of patients with positive finding, % = percentage of patients with positive findings
signs [e.g. hemiparesis, unilateral pupillary response dysfunction, etc.], skull fracture,
electroencephalogram findings [EEG], seizures, and neurosurgery). The Good and
Poor mTBI patients do not have more than 10% of their respective groups with evidence
from any of these indicators. These data combined with the lack of differences in the
acute characteristics (GCS, LOC, or PTA) indicate that the Poor mTBI group was not
injured more severely than the Good mTBI group, but both groups were definitely less
severely injured than the m/s TBI, LHD, and DEM groups, which had multiple pieces of
evidence indicating neuropathology.
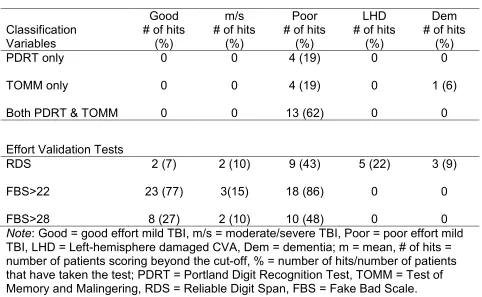
Effort Validation
Although the Good and Poor effort groups were separated based on TOMM and