Max Planck Institute for Demographic Research Konrad-Zuse Str. 1, D-18057 Rostock·GERMANY www.demographic-research.org
DEMOGRAPHIC RESEARCH
VOLUME 20, ARTICLE 31, PAGES 817-874
PUBLISHED 23 JUNE 2009
http://www.demographic-research.org/Volumes/Vol20/31/ DOI: 10.4054/DemRes.2009.20.31
Research Article
Subjective expectations in the context of
HIV/AIDS in Malawi
Adeline Delavande
Hans-Peter Kohler
This publication is part of the proposed Special Collection “HIV/AIDS in sub-Saharan Africa”, edited by Susan Watkins, Jere Behrman, Hans-Peter Kohler, and Simona Bignami-Van Assche.
c
°2009 Adeline Delavande & Hans-Peter Kohler.
2 Background 819
3 Data and context 822
4 Interactive elicitation of probabilistic expectations 825
5 Response patterns 830
5.1 Item non-response 830
5.2 Focal answers 833
5.3 Consistency of subjective expectations with probability theory 833
5.4 Tendencies to be optimistic or pessimistic 834
5.5 Comparison with verbal scale 835
5.6 Measurement error 835
6 Expectations about common events 838
6.1 Going to the market 838
6.2 Food shortage and financial assistance 839
6.3 Infant mortality 844
7 HIV/AIDS-related expectations 845
7.1 Expectations about own HIV infection 845
7.2 Expectations about HIV prevention strategies: Condom use with spouse and other partners 851
7.2.1 Condom use with spouse 851
7.2.2 Condom use with a partner other than the spouse 853
8 Mortality 854
9 Conclusions 858
10 Acknowledgements 860
References 861
Appendix A 868
Subjective expectations in the context of HIV/AIDS in Malawi
Adeline Delavande1 Hans-Peter Kohler2
Abstract
In this paper we present a newly developed interactive elicitation methodology for collect-ing probabilistic expectations in a developcollect-ing country context with low levels of literacy and numeracy, and we evaluate the feasibility and success of this method for a wide range of outcomes in rural Malawi. We find that respondents’ answers about their subjective expectations take into account basic properties of probabilities, and vary meaningfully with observable characteristics and past experience. From a substantive point of view, the elicited expectations indicate that individuals are generally aware of differential risks. For example, individuals with lower incomes and less land rightly feel at greater risk of fi-nancial distress than people with higher socioeconomic status (SES), and people who are divorced or widowed rightly feel at greater risk of being infected with HIV than currently married individuals. Meanwhile many expectations—including the probability of being currently infected with HIV—are well-calibrated compared to actual probabilities, but mortality expectations are substantially overestimated compared to life table estimates. This overestimation may lead individuals to underestimate the benefits of adopting HIV risk-reduction strategies. The skewed distribution of expectations about condom use also suggests that a small group of innovators are the forerunners in the adoption of condoms within marriage for HIV prevention.
1Associate Economist, RAND Corporation, 1776 Main Street, Santa Monica, CA 90407-2138, USA and
Assistant Professor of Economics, Universidade Nova de Lisboa, Faculdade de Economia, Lisbon, Portugal. E-mail: [email protected].
2Professor of Sociology, 3718 Locust Walk, University of Pennsylvania, Philadelphia, PA 19104-6299, USA.
1. Introduction
Sub-Saharan Africa is at the epicenter of the HIV/AIDS epidemic, and estimated adult HIV prevalence ranges from less than 0.1% in Comoros to 32.4% in Swaziland (UN-AIDS 2006). Because the epidemic has become generalized, heterosexual sexual inter-course among low-risk individuals is the most common pathway of infection for rural populations (Gouws et al. 2005). Behavioral change with respect to sexual relationships, marriage/divorce, condom use and partner selection is therefore crucial for all efforts tar-geted at curtailing the disease (Aggleton et al. 1994; UNAIDS 1999; Cerwonka, Isbell, and Hansen 2000). However, the adoption of behavioral change in AIDS-related be-haviors depends critically on individuals’ subjective expectations about their own HIV infection status and life expectancy, the prevalence of HIV in the local population, and the availability of antiretroviral treatments for AIDS. Several theoretical frameworks that seek to identify the determinants of risk-taking behaviors in the context of HIV/AIDS— including, for example, rational choice theories (Philipson and Posner 1993), the health-belief-model (UNAIDS 1999), the theory of reasoned action (Ajzen and Fishbein 1980), or the information-motivation-behavioral skills (IMB) model (Fisher and Fisher 1992)— therefore emphasize (correct) expectations about AIDS risks as a central prerequisite for behavioral change. However, despite this alleged central role of expectations, very few empirical studies have used well-defined subjective expectations in their analyses of HIV-infection risks and the determinants of risk-taking behaviors. In cases where expectations and risk perceptions have been investigated, researchers often make non-verifiable as-sumptions, for example, with respect to the interpretation of verbal scales measuring de-grees of subjective likelihood (very likely vs. not very likely), or the interpersonal com-parability of subjective risk assessments (e.g., Akwara, Madise, and Hinde 2003; Prata et al. 2006; Anglewicz and Kohler 2009).
To resolve the limitations of existing approaches, economists have recently
devel-oped approaches to elicitprobabilistic expectations: i.e., expectations that are measured
on a well-defined numerical scale, that are comparable across domains, and that can be consistently interpreted as probabilities. For example, probabilistic expectations can be
elicited using questions such as, “What do you think is thepercent chancethat you will
rainfall expectations by asking household heads in Kenya and Ethiopia to allocate twelve stones into three piles, with each pile representing a different state of nature regarding the precipitation level for the coming rainy season (above normal, normal and below normal); Santos and Barrett (2006) and Hill (2006), who have used a similar technique to elicit expectations about herd size and coffee prices, respectively; McKenzie, Gibson, and Stillman (2006), who have used the percent chance wording to elicit expectations about future post-migration employment and income from Tongans intending to emigrate to New Zealand; and Delavande (2004) and Attanasio, Meghir, and Vera-Hernánde (2005), who have used a visual scale labeled from zero to ten (or hundred) to elicit probabilistic expectations about contraceptive failures and birth outcomes in Ghana or future income in Colombia. In most of the existing cases, however, these methods to elicit probabilistic expectations were implemented in populations that have a relatively high level of literacy or numeracy compared to the sub-Saharan African countries where HIV/AIDS is most prevalent, or were limited to small-scale surveys without extensive socioeconomic or de-mographic information.
To investigate the relevance of subjective expectations for understanding AIDS-related risk behaviors and behavioral change in Sub-Saharan Africa (SSA), we have developed an innovative interactive elicitation technique to elicit probabilistic expectations, and have implemented this technique as part of the 2006 survey of the Malawi Diffusion and Ideational Change Project (MDICP), which covers more than 3,000 adult respondents in rural Malawi. In this paper, we present this interactive technique, and evaluate its success at eliciting probabilistic expectations about HIV-related outcomes and other important life events in rural Malawi. The analyses in this paper find that the reported expectations are remarkably consistent with a basic property of probability theory (the monotonicity of nested events), and vary in meaningful ways with individual or contextual characteris-tics. In addition, several important substantive findings emerge from our analyses. We find that respondents have relatively well-calibrated beliefs about infant mortality, but are greatly pessimistic about their own survival—perhaps as an overreaction to the sub-stantial increases in adult mortality that have occurred as a result of HIV/AIDS in the last decade. We also find that AIDS-related subjective expectations exhibit heterogeneity across individuals and socioeconomic groups that may partially explain the substantial variation in the extent to which rural Malawians engage in risk-taking behaviors or adopt risk-reduction strategies.
2. Background
behaviors of others, or on aspects of the environment that are difficult or impossible to observe. Social scientists therefore typically assume that individuals use available
in-formation to form subjective probability distributions (subjectiveexpectations) about
un-certain events, and rely on these expectations to make decisions. Knowing individuals’ expectations is therefore crucial to making accurate inferences regarding the determinants of individual behaviors and their variations across persons and social groups. To illustrate the central relevance of knowing individuals’ expectations for making accurate inferences about the determinants of individual behaviors, consider a young man who engages in sexual activities without using a condom. His behavior can be consistent with many al-ternative specifications of his preferences and expectations. For example, he may believe that he is at great risk of contracting HIV from unprotected sex, but dislikes condoms so much that he chooses not to use one. Alternatively, he might not dislike condoms that much, but believes that his partner and he have the same serostatus, and therefore chooses not to use condoms. A third hypothesis is that he believes condoms are ineffective at preventing the transmission of sexually transmitted diseases. Other plausible competing explanations could be advanced. Choice data alone (e.g., data on condom use)—that is, choice data without accompanying information on the subjective expectations related to the respective choices—do not enable researchers to discriminate between these
compet-ing explanations,which have very different policy implications.3
To overcome this limitation, some attitudinal researchers have used verbal questions to measure “qualitative” expectations, such as whether an event is “very likely” or “un-likely” to occur. A main difficulty with the interpretation of these verbal scales is that answers may not be comparable across respondents (King et al. 2004), and individuals may have very different perceptions about what “very likely” is. Thus, two respondents who provide the same answers based on a verbal scale might still make different deci-sions, even if they were to share identical tastes. Moreover, even if interpersonal com-parability is improved using anchoring vignettes (King et al. 2004; Salomon, Tandon, and Murray 2004) or similar techniques, the interpretation of likelihood scales in terms of probabilistic expectations remains problematic, and is inherently coarse. Cognitive
psychologists and economists have therefore started to elicitprobabilistic expectations,
which have the advantage of being measured on a numeric scale on which answers can be consistently interpreted as probabilities across different types of outcomes (Manski 2004). Several large-scale surveys—including the Survey of Economic Expectations (SEE), the Health and Retirement Study (HRS), the National Longitudinal Survey of Youth (NLSY), and the Michigan Survey of Consumers—have included questions eliciting respondents’ expectations in a probabilistic form. Respondents’ answers to these questions about sub-jective expectations have been shown to vary in a systematic manner with covariates
fecting the underlying events, and the elicited expectations have also been found to have strong predictive power for subsequent outcomes (e.g., Dominitz and Manski 1996, 1997; Lillard and Willis 2001). For example, the subjective assessments of the probability of survival in the HRS have been found to vary systematically with other variables, such as smoking (Hurd and McGarry 1995); to evolve coherently over time in response to new information, such as the onset of a disease or the death of a parent at an early age (Hurd and McGarry 2002); and to be predictive of actual mortality (Hurd and McGarry 2002; Delavande and Rohwedder 2008).
The theoretical models guiding most of this research on subjective expectations are generally based on economic inter-temporal choice frameworks that explicitly recognize uncertainty and incorporate subjective expectations to reflect individuals’ perceptions of this uncertainty. Consider, for example, an individual with an uncertain monthly income stream, and who cares about present and future consumption. Enjoying future consump-tion depends on survival, which is a funcconsump-tion of current and future health. Future health outcomes are determined by a health production function that includes the current health status and various health inputs (e.g., nutrition, health care utilization, etc.; but also as-pects such as sexual behaviors involving HIV infection risks). An individual may be uncertain about his/her current health, as well as the health production itself that deter-mines relationships between health inputs and health outcomes (e.g., an individual may be uncertain about the HIV infection risk associated with sexual intercourse, either due to uncertainty about the infection risk per intercourse, or uncertainty about the HIV status of the sexual partner). There may also be uncertainty about the health production function as a result of technological change in the context of this research: for example, because an-tiretroviral treatment (ART) may change the health consequences of being infected with HIV. In this uncertain intertemporal context, individuals need to allocate resources (e.g., income, time) and make behavioral decisions (e.g., about sexual behaviors, condom use, etc.) to maximize expected lifecycle utility. In this model, optimal resources allocations and behaviors will depend critically on an individual’s expectations about aspects such as future income streams, the health production function, survival probabilities, etc. Optimal allocations and behaviors may also change over time as expectations change, for example, as a result of new information or environmental changes (e.g., price changes or changes in the HIV prevalence in the pool of actual/potential sexual partners), and as a result of the passage of time, which shortens the remaining expected life.
con-stant sum game, Delavande (2008) estimates a random utility model of contraceptive be-havior using expectations about birth control methods, Erdem, Keane, and Strebel (2005) incorporate price expectations in a dynamic discrete choice model of information search and technology choice, Hurd, Smith, and Zissimopoulos (2004) and Delavande and Willis (2007) study how subjective expectations of survival affect the timing of retirement and of claiming Social Security, and, finally, Lochner (2007) investigates criminal behavior using subjective expectations of arrest.
3. Data and context
The analyses in this paper are based on the 2006 wave of the Malawi Diffusion and
Ideational Change Project(MDICP). The general goal of this project is to investigate the multiple processes and influences that contribute to varying degrees of HIV risks in sexual partnerships in a sub-Saharan African context, the variety of ways in which people man-age risk through prevention strategies within marriman-age and other sexual relationships, and the potential effect of HIV risk-reduction programs on infection risks and disease dynam-ics. For this purpose, the MDICP has collected, and continues to collect, an unusually rich combination of panel survey data (1998, 2001, 2004, 2006, 2008, with ongoing data col-lection until 2010), qualitative data, and biomarkers for HIV and other sexually transmit-ted infections. Detailed descriptions of the MDICP sample selection, data collection, and data quality are provided on the project website at http://www.malawi.pop.upenn.edu, in
a Special Collection of the online journalDemographic Researchdevoted to the MDICP
(Watkins et al. 2003), and in a recent working paper that incorporates the 2004 and 2006 MDICP data (Anglewicz et al. 2009). Mortality and migration are the primary sources of attrition in the MDICP, and verbal autopsies (VAs) conducted as part of the MDICP suggest that approximately two-thirds of respondents who died between the 1998–2001 surveys had AIDS-related symptoms (Doctor and Weinreb 2003).
as funerals and other community activities, and number of people known to have died of AIDS; and (e) the respondent’s HIV status using HIV rapid tests that were administered to all consenting respondents after the household survey. In addition to various questions about subjective risk assessments that have been asked in the MDICP since 1998, includ-ing, for instance, the respondent’s assessment of his/her own and partner’s current HIV status and expected lifetime HIV risk, the 2006 wave of the MDICP also included a newly
developedexpectations modulethat was designed to elicit probabilistic expectations on
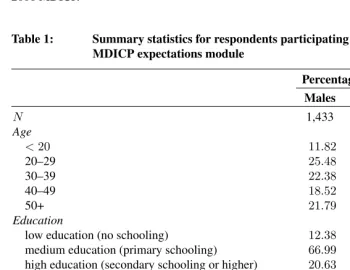
HIV/AIDS related behaviors and outcomes. This expectation module was administered to more than 3,000 respondents (see Table 1 for summary statistics), and this paper provides the first detailed set of analyses of the probabilistic expectation collected as part of the 2006 MDICP.
Table 1: Summary statistics for respondents participating in the 2006 MDICP expectations module
Percentage of Respondents
Males Females Total
N 1,433 1,739 3,172
Age
<20 11.82 11.18 11.46
20–29 25.48 28.98 27.46
30–39 22.38 26.67 24.81
40–49 18.52 20.50 19.64
50+ 21.79 12.66 16.62
Education
low education (no schooling) 12.38 26.38 20.06
medium education (primary schooling) 66.99 64.00 65.35
high education (secondary schooling or higher) 20.63 9.62 14.59
Marital status
married 79.05 82.04 80.69
divorced/separated/widowed 2.30 11.74 7.48
never married 18.65 6.22 11.83
Land ownership
≤2acres 36.24 47.17 42.25
2–4 acres 32.51 32.27 32.38
Table 1: (Continued)
Percentage of Respondents
Males Females Total
N 1,433 1,739 3,172
Lifetime number of sexual partners
0 4.33 3.23 3.73
1 17.26 42.57 31.13
2 22.08 31.11 27.03
3 17.54 13.82 15.50
4+ 38.78 9.27 22.61
Ever tested for HIV (prior to 2006 MDICP survey)
no 37.67 37.86 37.77
yes, learned result 58.61 55.78 57.06
yes, did not learn result 3.72 6.36 5.17
2006 HIV status (determined after 2006 MDICP survey)
negative 88.38 86.33 87.24
positive 3.60 6.15 5.02
no test 8.02 7.52 7.74
Region
North (Rumphi) 31.96 31.69 31.81
Center (Mchinji) 33.29 34.24 33.81
South (Balaka) 34.76 34.07 34.38
Note: The expectation module included in the 2006 wave of the MDICP was administered to 3,237 respondents
4. Interactive elicitation of probabilistic expectations
To elicit probabilistic expectations in the context of low literacy and numeracy, we have
developed an innovativeinteractive elicitationtechnique based on asking respondents to
allocate up to ten beans on a plate to express the likelihood that an event will be realized. Interviewers during the 2006 MDICP introduced this technique by reading the following text to the respondents:
"I will ask you several questions about the chance or likelihood that cer-tain events are going to happen. There are 10 beans in the cup. I would like you to choose some beans out of these 10 beans and put them in the plate to express what you think the likelihood or chance is of a specific event hap-pening. One bean represents one chance out of 10. If you do not put any beans in the plate, it means you are sure that the event will NOT happen. As you add beans, it means that you think the likelihood that the event happens increases. For example, if you put one or two beans, it means you think the event is not likely to happen but it is still possible. If you pick five beans, it means that it is just as likely it happens as it does not happen (fifty-fifty). If you pick six beans, it means the event is slightly more likely to happen than not to happen. If you put ten beans in the plate, it means you are sure the event will happen. There is no right or wrong answer, I just want to know what you think. Let me give you an example. Imagine that we are playing Bawo. Say, when asked about the chance that you will win, you put seven beans in the plate. This means that you believe you would win seven out of ten games on average if we play for a long time."
The bean format outlined in this introductory text is visual, relatively intuitive, and fairly engaging for respondents. In addition, the format can be designed to improve the con-sistency of answers. Following the above introduction and any clarifying questions, re-spondents were first asked a training question about the probability of winning in a local board game (Bawo), followed by a question about the likelihood of a newborn baby dying before his first birthday. To evaluate whether respondents understand the concept of
prob-ability, respondents were then asked about twonestedevents: going to the market within
property, the interviewer was instructed to explain the incoherency of the answers with
the following statement: "As time goes by, you may find more time to go to the market.
Therefore, you should have added beans to the plate." And the respondent was invited to reformulate the answer. For this first set of training questions, the interviewers were also instructed to prompt the respondent if s/he allocated zero or ten beans in the plate.
Respondents were then asked a series of questions related to economic outcomes, health outcomes, and risk-prevention strategies (see Appendix A for the expectations module included in the 2006 MDICP questionnaire). For the analyses in this paper, we
fo-cus on the following events: (a) going to market within the nexttwo days; (b) going to the
market within the nexttwo weeks; (c) experiencing a food shortage within the next twelve
months; (d) having to rely on family members for financial assistance in the next twelve
months; (e) being infected with HIV now; (f) using a condom at the next sexual encounter
with a spouse; (g) using a condom at the next sexual encounter with someone other than
a spouse (not asked if the respondent reports having sex only with a spouse); and (h) the
respondent dying within (i)one year; (ii)five years; and (iii)ten years. The mortality
questions were designed to ensure that respondents provided answers that would allow us to construct well-defined survival curves. In particular, respondents were first asked to pick the number of beans that reflect how likely it is that they will die within a one-year period beginning today. Then, with the beans of the previous question still on the plate,
they were asked toadd more beans to reflect how likely it is that they would die within
a five-year period. The same procedure was followed for the ten-year period mortality question. This ensured that respondents provided weakly increasing answers when the time horizon increased.
In our subsequent analyses, we use two related scales to represent respondents’
an-swers to the subjective expectation questions.First, the direct response to the expectation
questions in terms of the number of beans that the respondent put on the plate (ranging
from zero to ten).Second, we interpret the reported number of beans asimplied subjective
probabilitiesby assuming that each number of beans between zero and ten corresponds to a specific probability interval between zero and one. This approach assumes that respon-dents choose the number of beans that best represents their subjective probability, and it reflects our beliefs that all respondents who place zero (ten) beans on the plate do not believe literally that this event has a probability of zero (one). We therefore calculate the
as a function of their underlying subjective probabilityPias follows:
zerobeans if Pi<0.05
onebean if 0.05≤Pi<0.15
..
. ...
Xibeans if Xi
10 −0.05≤Pi <
Xi
10 + 0.05 (1)
..
. ...
ninebeans if 0.85≤Pi<0.95
tenbeans if Pi≥0.95,
whereXiis the number of beans allocated by respondentigiven his/her underlying
sub-jective probabilityPi.
In addition to providing various summary statistics of these implied probabilities, we
will also use a standardized boxplot-like diagram to display thedistribution of
subjec-tive probabilities. This boxplot-like graph displays the mean and median of the reported
expectations, as well as the 10th, 25th, 75th, and 90thpercentiles of the distribution (see
also Appendix Figure B1). The median and percentiles of the distribution of subjective probabilities are calculated assuming a uniform distribution of the underlying subjective
probabilitiesPiwithin each interval in Eq. (1). The mid-point of each interval in Eq. (1)
is used in calculations of the average (implied) subjective probability.4
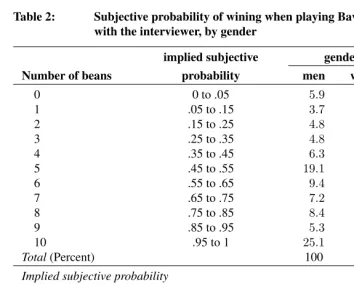
The first question in the expectation module asked respondents about the likelihood that they would win if they were playing Bawo with the interviewer. Bawo is a common board game played in Malawi. It is a strategy game, and can be as complex as checkers
or chess.5 Table 2 presents the distribution of answers in terms of the number of beans
allocated by respondents, and Figure 1 depicts the distribution of theimplied subjective
probabilities.
The elicited respondents’ expectations about winning in a game of Bawo reveal a considerable heterogeneity in beliefs, as is expected given that the probability of winning depends on many factors, such as the respondent’s and the interviewer’s skill and expe-rience. The inter-quartile range for both men and women in Figure 1 is .48–.51: 25% of men believe that they have a less than 44% chance of winning, while 25% believe that they are highly likely—with a subjective probability of more than 95%—to win. Women are less optimistic about winning in Bawo, and the distribution is shifted downward com-pared to men, but with a similarly high variance: 25% of women believe that they have
4This midpoint of the interval in Eq. (1) is equal to the number of beans,X, divided by ten, except for zero
beans, where the midpoint is .025, and ten beans, where the midpoint is .0975.
a less than 16% chance of winning, while 25% believe that they will win with a subjec-tive probability of more than 64%. The average implied probability of winning is 62%
for men and 44% for women, with the difference being statistically different (Figure 1).6
This gender difference is consistent with the fact that men play Bawo more often than women, and thus tend to be more experienced; the gender difference is also in agreement with the large body of literature reporting that women have lower expectations of success than men in many areas of achievement (e.g., Erkut 1983; Mura 1987). In addition to this gender difference, Figure 1 reveals a slight age pattern: males aged 20 to 39 report a higher subjective probability of winning in a Bawo game against the interviewers than males in younger or older age groups, perhaps reflecting higher skills in this age group, or generally more optimistic perceptions of young adult men in their own abilities.
Figure 1: Distribution of respondents’ subjective probability of winning if playing bawo, by gender, region, and age group
0 .0 0 .2 0 .4 0 .6 0 .8 1 .0 males females by gender 0 .0 0 .2 0 .4 0 .6 0 .8 1 .0 0 .0 0 .2 0 .4 0 .6 0 .8 1 .0
N C S
males by region
0 .0 0 .2 0 .4 0 .6 0 .8 1 .0 0 .0 0 .2 0 .4 0 .6 0 .8 1 .0 0 .0 0 .2 0 .4 0 .6 0 .8 1 .0
N C S
females by region
0 .0 0 .2 0 .4 0 .6 0 .8 1 .0 0 .0 0 .2 0 .4 0 .6 0 .8 1 .0 0 .0 0 .2 0 .4 0 .6 0 .8 1 .0
<20 20− 30− 40− 50+ 29 39 49
males by age group
0 .0 0 .2 0 .4 0 .6 0 .8 1 .0 0 .0 0 .2 0 .4 0 .6 0 .8 1 .0 0 .0 0 .2 0 .4 0 .6 0 .8 1 .0 0 .0 0 .2 0 .4 0 .6 0 .8 1 .0 0 .0 0 .2 0 .4 0 .6 0 .8 1 .0
<20 20− 30− 40− 50+ 29 39 49
females by age group
0 .0 0 .2 0 .4 0 .6 0 .8 1 .0 0 .0 0 .2 0 .4 0 .6 0 .8 1 .0 0 .0 0 .2 0 .4 0 .6 0 .8 1 .0 0 .0 0 .2 0 .4 0 .6 0 .8 1 .0 0 .0 0 .2 0 .4 0 .6 0 .8 1 .0
Notes:Region is coded as: N = North (Rumphi), C = Center (Mchinji), S = South (Balaka).
The reported probabilities of winning in a game of Bawo reveal some important fea-tures of subjective expectations that continue to characterize many of the outcomes, which are analyzed as follows: (a) subjective probabilities often exhibit considerable variation between respondents, who differ substantially in their assessments of the likelihood of various events; (b) they vary importantly and meaningfully across subpopulations defined
6 The mean answer in terms of beans is 6.16 for men compared to 4.35 for women, and the difference is
by age, gender, region, and as we show later, also by marital status, socioeconomic sta-tus, and health; (c) mean and median answers are often close to each other, indicating that the distribution of beliefs tends to be symmetric, with the exception of respondents’ expectations about currently being infected with HIV, which is highly skewed.
Table 2: Subjective probability of wining when playing Bawo with the interviewer, by gender
implied subjective gender
Number of beans probability men women Total
0 0 to .05 5.9 15.0 10.9
1 .05 to .15 3.7 8.8 6.5
2 .15 to .25 4.8 9.5 7.4
3 .25 to .35 4.8 8.1 6.6
4 .35 to .45 6.3 7.9 7.2
5 .45 to .55 19.1 18.1 18.5
6 .55 to .65 9.4 8.2 8.8
7 .65 to .75 7.2 6.2 6.7
8 .75 to .85 8.4 5.8 7.0
9 .85 to .95 5.3 2.6 3.8
10 .95 to 1 25.1 9.9 16.7
Total(Percent) 100 100 100
Implied subjective probability
Mean 0.62 0.44 0.52
10thpercentile 0.16 0.03 0.05
25thpercentile 0.44 0.16 0.25
Median 0.61 0.45 0.51
75thpercentile 0.95 0.64 0.79
90thpercentile 0.98 0.95 0.97
5. Response patterns
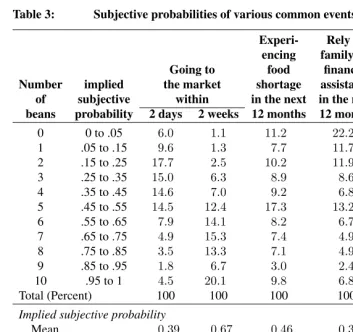
This expectation module included in the 2006 wave of the MDICP was administered to 3,237 respondents in three regions of rural Malawi. For 65 respondents, the gender variable is missing, and our analyses focus on the 3,172 respondents with known gender who answered the expectation module. Table 3 reports the responses in terms of number of beans to the questions about going to the market, experiencing a food shortage, having to rely on family members, infant mortality, being infected with HIV, condom use, and mortality. As these responses are based in a newly developed interactive approach to elicit probabilistic expectations in developing country contexts, we include in our analyses a careful evaluation of this approach. Before embarking on the substantive analyses of these subjective probabilities covering several domains of respondents’ lives, we begin in this section with an evaluation of the quality of the elicited expectation data, including item non-response, focal answers, and the internal consistency of respondents’ answers about nested events. We then provide detailed descriptions of respondents’ subjective expectations about common events, HIV infection, and prevention strategy and mortality, and evaluate how these subjective probabilities vary with respondents’ characteristics or reported behaviors.
5.1 Item non-response
Table 3: Subjective probabilities of various common events
Experi- Rely on
encing family for
Going to food financial Baby
Number implied the market shortage assistance dying
of subjective within in the next in the next before 1st
beans probability 2 days 2 weeks 12 months 12 months birthday
0 0 to .05 6.0 1.1 11.2 22.2 18.4
1 .05 to .15 9.6 1.3 7.7 11.7 22.4
2 .15 to .25 17.7 2.5 10.2 11.9 17.7
3 .25 to .35 15.0 6.3 8.9 8.6 10.7
4 .35 to .45 14.6 7.0 9.2 6.8 7.3
5 .45 to .55 14.5 12.4 17.3 13.2 17.6
6 .55 to .65 7.9 14.1 8.2 6.7 2.8
7 .65 to .75 4.9 15.3 7.4 4.9 1.3
8 .75 to .85 3.5 13.3 7.1 4.9 0.9
9 .85 to .95 1.8 6.7 3.0 2.4 0.4
10 .95 to 1 4.5 20.1 9.8 6.8 0.7
Total (Percent) 100 100 100 100 100
Implied subjective probability
Mean 0.39 0.67 0.46 0.36 0.25
10thpercentile 0.09 0.33 0.05 0.02 0.03
25thpercentile 0.20 0.51 0.21 0.07 0.08
Median 0.36 0.69 0.47 0.30 0.20
75thpercentile 0.53 0.88 0.68 0.56 0.43
90thpercentile 0.75 0.98 0.94 0.83 0.53
Table 3: (Continued)
Using condom at next sexual encounter with
Number Being someone Own Mortality:
of infected with spouse other than Probability of dying within
beans HIV now spouse 1-year 5-years 10-years
0 66.7 64.3 10.1 29.1 6.0 2.0
1 9.6 7.5 1.5 24.2 8.4 2.0
2 7.5 6.7 3.8 16.2 16.2 4.9
3 4.8 4.4 3.6 8.9 16.6 8.0
4 2.3 2.9 3.4 5.4 12.2 10.0
5 5.6 6.1 11.2 13.2 20.2 24.9
6 0.5 2.6 8.2 0.8 7.1 10.1
7 0.5 0.9 5.3 0.4 5.9 11.2
8 0.9 1.4 8.8 0.5 3.3 9.8
9 0.7 0.5 7.4 0.3 0.9 4.9
10 1.0 2.7 36.6 0.9 3.3 12.2
Total (Percent) 100 100 100 100 100 100
Implied subjective probability
Mean 0.12 0.16 0.67 0.20 0.39 0.58
10thpercentile 0.01 0.01 0.05 0.02 0.10 0.27
25thpercentile 0.02 0.02 0.47 0.04 0.22 0.43
Median 0.04 0.04 0.78 0.14 0.37 0.54
75thpercentile 0.14 0.20 0.97 0.31 0.53 0.77
90thpercentile 0.41 0.52 0.99 0.50 0.71 0.96
5.2 Focal answers
Expectations questions have been found to exhibit heaping at focal answers of 0%, 50% and 100% (e.g., see Hurd and McGarry 1995), and responses of 50% have been shown to reflect uncertainty (Bruine de Bruin et al. 2000). In Malawi, the pattern of focal answers— zero, five, and ten beans—is quite similar to those found in surveys conducted in devel-oped countries. From Table 2 we can see that for the Bawo question, focal answers repre-sent about 46% of the overall answers. This compares to 44% for the income expectations in the SEE (Dominitz and Manski 1997), 46% for the probability of getting the flu next year in the NLSY 1997 (Fischhoff et al. 2000), and 56% for the probability of working past age 62 in HRS 2002. The mortality expectations exhibit less heaping than in the HRS (even though the two surveys are not directly comparable due to the difference in age groups). For example, 39% of the MDICP respondents provided a focal answer when asked about their 10-year mortality (Table 3). If we restrict the HRS sample to respon-dents aged 64 and 65 in 1992, we find that half of them provided either 0%, 50% or
100% when asked about the probability of being alive at age 75.7 We have little
bench-mark data from developing countries. However, Attanasio, Meghir, and Vera-Hernánde (2005) report that, in Colombia, 15% of their sample answered 50% when asked about the probability that their income would be above a threshold.
Overall, the pattern of focal answers in Table 3 is sensible. For example, as the length of time for the probability of going to the market increases, the proportion of respondents answering with zero beans decreases sharply, while the proportion of those responding with ten beans increases substantially. There is a similar pattern for the mortality ques-tions. Moreover, for events with a low likelihood, like the one-year mortality of a baby or their own HIV infection, the proportion of responses at zero beans is far greater than those at ten beans.
5.3 Consistency of subjective expectations with probability theory
After the completion of the survey, interviewers were asked to evaluate whether the
re-spondents understood the concept of likelihood or chance.8 In 34% of the interviews,
the interviewer reported that the respondent fully understood; in 35%, that s/he mostly understood; in 30%, that s/he understood after a while. In about 1% of the interviews, the
7Source: author’s computation (N = 227). We use HRS 1992 because respondents were asked to provide
a number between zero and ten, as in the present survey. In later waves, respondents were asked to provide a number between zero and hundred.
8Interviewers were asked to evaluate: "Did the respondent understand the concept of likelihood or chance in
interviewers thought that the concept remained unclear until the end, or that the respon-dent did not understand at all.
A more direct test to evaluate whether respondents understand the concept of proba-bilistic expectations is to analyze nested events. Nested events are subsets of each other, and thus imply an ordering of the subjective probabilities. In our interactive approach, we used two questions about the respondent’s likelihood of going to the market to test this consistency of expectations: going to the market within two days, and going to the market within two weeks. A remarkably high number of respondents said that the probability of “going to the market within two days” was less than or equal to the likelihood of “going to the market within two weeks”. Only 19 respondents out of 3,221 (0.6%) violated the property of the probability of nested events. Note that the design of the question did not force this high consistency rate. While interviewers were instructed to leave on the plate the beans expressing the likelihood of going to the market within two days, they did not ask respondents to add more beans for the two-week period. One may wonder if this very high consistency rate results from the fact that respondents provided the same answers to both questions. However, only about 6% of the respondents gave the same answer to both questions. Adding two and three beans was the most common action taken by respon-dents when the length of time increases from two days to two weeks (29% added two, and 25% added three beans; see Appendix Table B1 for a full tabulation). This consis-tency of the implied probabilities of going to the market within two days and two weeks provides strong support for the assumption that respondents understood the concept of likelihood. The mortality expectations contain another set of nested events: respondents were asked about the probability of dying within one year, five years, and ten years. The mortality questions deal with an event that, unlike going to the market, respondents do not experience regularly. Out of the 3,180 respondents who answered the questions for the three time horizons, only 1.41% violated the monotonicity property of the probabilities. This high level of consistency is, however, due in part to the question design, which aimed at obtaining consistent answers (see Section 4).
5.4 Tendencies to be optimistic or pessimistic
one-year mortality in the upper quartile. When we compare the answers of the five-year mortality with the infant mortality, there is not such a clear pattern, even though we can observe that, among respondents who are optimistic about their own mortality (those with answers in the first quartile), half also have their answer in the first quartile for infant mor-tality. However, if we compare the Bawo question with the survival, there is clearly no tendency to report similar answers to both questions. This pattern holds more generally across all questions: while individual’s responses to questions in a similar domain—such as mortality—are correlated, there is an absence of a marked correlation in the responses to questions that are not substantively related (Appendix Table B2). This lack of a marked correlation across substantively unrelated questions indicates that respondents evaluated each question separately, taking into account question-specific information rather than following a similar response pattern—such as “always pick five beans”—across all ques-tions.
5.5 Comparison with verbal scale
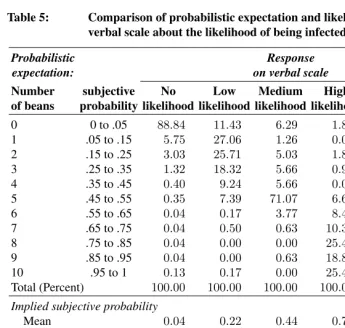
Table 5 compares respondents’ answers to the question, “In your opinion, what is the likelihood (chance) that you are infected with HIV/AIDS now?” with the number of beans provided when asked how likely they think it is that they are currently infected with HIV/AIDS. It shows that respondents who estimate a higher likelihood of being infected using the verbal scale are also more likely to provide a higher number of beans. For example, the modal answer is zero beans among respondents who said “no likelihood”, one bean among those who said “low likelihood”, and five beans among those who said “medium likelihood.” However, Table 5 also highlights that there is a great variation in what probability respondents associate with “low likelihood” or “medium likelihood.” For example, a bit more than a quarter of the respondents who said “low likelihood” allocated one bean and another quarter allocated two beans, 18% allocated four beans, and 12% allocated zero beans. This suggests that the bean measure may be more informative in comparing risk rankings across individuals.
5.6 Measurement error
Sec-ond, we can compare the standard deviation of the distributions of beliefs for different outcomes. If respondents were randomly answering the beans questions, the standard de-viations would be very similar independent of the events considered. As an example, we test using an F-test for equality of the standard deviation of the distributions associated with the likelihood of going to the market within two weeks, and the likelihood of expe-riencing a food shortage within the next twelve months. The respective sample standard deviations are 2.45 and 3.04, and we can reject equality of the standard deviations at 1%. Finally, the systematic variation of the percentiles of the distributions with observable characteristics suggests that respondents report meaningful answers.
Table 4: Tendencies to by systematically optimistic or pessimistic: Distri-bution of survey response across different subjective probabilities
Five-year mortality
1st quartile 2nd quartile 3rd quartile 4th quartile Total
One-year mortality
1st quartile 69.12 17.26 13.31 1.57 29.09
2nd quartile 30.04 40.98 13.31 2.35 24.15
3rd quartile 0.32 41.20 50.87 14.29 25.18
4th quartile 0.53 0.56 22.50 81.79 21.58
Total 100.00 100.00 100.00 100.00 100.00
Infant mortality
1st quartile 55.93 41.54 30.16 27.59 40.78
2nd quartile 16.37 20.27 18.10 15.83 17.73
3rd quartile 11.65 20.60 20.00 21.63 17.95
4th quartile 16.05 17.59 31.75 34.95 23.53
Total 100.00 100.00 100.00 100.00 100.00
Win if play Bawo
1st quartile 33.61 31.59 30.79 28.53 31.42
2nd quartile 23.95 25.03 30.16 24.45 25.62
3rd quartile 21.85 22.47 21.11 24.45 22.41
4th quartile 20.59 20.91 17.94 22.57 20.55
Total 100.00 100.00 100.00 100.00 100.00
Table 5: Comparison of probabilistic expectation and likelihood-based verbal scale about the likelihood of being infected with HIV
Probabilistic Response
expectation: on verbal scale
Number subjective No Low Medium High Don’t
of beans probability likelihood likelihood likelihood likelihood know Total
0 0 to .05 88.84 11.43 6.29 1.89 23.81 66.75
1 .05 to .15 5.75 27.06 1.26 0.00 28.57 9.50
2 .15 to .25 3.03 25.71 5.03 1.89 19.05 7.47
3 .25 to .35 1.32 18.32 5.66 0.94 9.52 4.78
4 .35 to .45 0.40 9.24 5.66 0.00 0.00 2.31
5 .45 to .55 0.35 7.39 71.07 6.60 19.05 5.57
6 .55 to .65 0.04 0.17 3.77 8.49 0.00 0.54
7 .65 to .75 0.04 0.50 0.63 10.38 0.00 0.51
8 .75 to .85 0.04 0.00 0.00 25.47 0.00 0.89
9 .85 to .95 0.04 0.00 0.63 18.87 0.00 0.70
10 .95 to 1 0.13 0.17 0.00 25.47 0.00 0.98
Total (Percent) 100.00 100.00 100.00 100.00 100.00 100.00
Implied subjective probability
Mean 0.04 0.22 0.44 0.79 0.20 0.12
10thpercentile 0.01 0.04 0.20 0.53 0.02 0.01
25thpercentile 0.01 0.10 0.45 0.70 0.05 0.02
Median 0.03 0.20 0.49 0.83 0.14 0.04
75thpercentile 0.04 0.31 0.52 0.95 0.29 0.14
90thpercentile 0.07 0.43 0.54 0.98 0.50 0.42
6. Expectations about common events
This section provides detailed descriptions of the expectations questions about common events occurring in the respondents’ lives or environments.
6.1 Going to the market
Table 3 reports the actual allocation of the number of beans and summary statistics of the elicited subjective probabilities. The most common answers are two, three, four, and five beans for the shorter time frame; and ten and seven beans for the longer time frame. The average answer is 3.9 beans for the two-day period (3.7 for women and 4.1 for men), and
6.7 beans for the two-week period (6.5 for women and 7.0 for men).9
The elicited expectations about going to the market are highly consistent with the re-ports about market activities collected in other parts of the MDICP survey. For instance, men report going to the market more often: the mean answer for men is 7.7 trips per
month, compared to 5.4 for women.10 A similar pattern exists with age. Further evidence
that the elicited probabilities about going to the market correspond with actual behav-iors is obtained from an individual-level regression of a respondent’s answer—measured in terms of the number of beans—on the reported number of trips in the last month— measured as the number of trips or the quintile of the distribution of trips—controlling also for gender, region, and age (Appendix Table B3). Individuals who have been to the market more frequently in the previous month report a higher probability of going in the next two weeks. Compared to those who made no more than two trips to the market in the previous month, having been to the market three to four times is associated with 0.77 additional beans (an increase in subjective probability of 7.7 percentage points), having been to the market five to nine times is associated with 1.2 additional beans (an increase in subjective probability of 12 percentage points), and having been to the market more than tentimes is associated with 2.4 additional beans (an increase in subjective probability of 24 percentage points). The answers to the market questions also appear on average to be relatively well-calibrated. The median number of trips in the past month is four. This may roughly correspond to one trip per week. If there are five open days per week, one would expect a 40% chance of an individual going to the market in the next two days, which is the median answer provided by respondents. The median answer for the likelihood of going to the market in the next two weeks is seven beans, or a 70% chance. This answer may seem low compared to the median number of trips in the past month, though it may be consistent with the stochastic nature of going to the market.
6.2 Food shortage and financial assistance
Food shortages have become a common problem for rural Malawians in recent years. In particular, in 2005, due to a prolonged dry spell and problems with the distribution of fertilizer, Malawi experienced its lowest crop production in seven years. The production in 2005 of the most important staple crop, maize, was the lowest in a decade, and 26% below the already relatively poor 2004 harvest (European Commission 2005). While food aid distribution programs alleviated some of the consequences of this famine, the impact on rural households was nevertheless severe. Transfers among family members are an important mechanism for coping with the consequences of crises such as famine, drought, crop failure, death, etc. (van de Ruit and Vandemoortele 2005; Weinreb 2006). Analyses of the family roster and transfer questionnaire collected as part of the 2006 MDICP survey reveal, for example, that 45% of family members (excluding children below age 15) received a little or some financial assistance in the past two years, and 14% received a great deal of help.
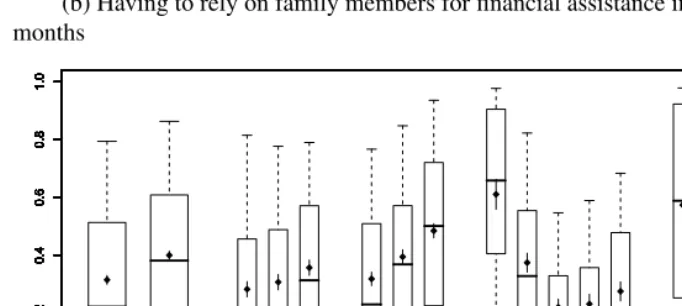
Given the volatility of food availability and the prevalence of transfers among family members, respondents were asked during the expectation module about the likelihood of experiencing a food shortage within the next twelve months, and the likelihood of having to rely on family members for financial assistance in the next twelve months. Figure 2 shows the distribution of the respondents’ subjective probabilities for these two events, and Table 3 reports the actual allocation of the number of beans along with summary statistics for the elicited subjective probability.
The average subjective probability of experiencing a food shortage within the next twelve months is 46% (men, 43%; women, 49%). The most common answers to the question were five, two, and zero beans (Table 3), suggesting that most of the respondents do not believe another food shortage to be highly likely in the coming year, which is consistent with FAO assessments about the 2006/07 harvest season (FAO 2007). Females estimate a higher likelihood of food shortage than men (Figure 2a), and this difference remains even after controlling for age, schooling, marital status, subjective likelihood of
food shortage, and other socioeconomic characteristics.11 Subjective probabilities about
having to rely on family members for financial assistance are generally lower than the expected likelihoods of experiencing a food crisis, but follow a similar pattern by gender. While there is no marked age pattern in the expectations of a food shortage, younger and older respondents report—consistent with observed transfer patterns—a higher likelihood
11This gender difference is consistent with several related findings in the literature, including that(i)women
of having to rely on family members for financial assistance.12 The average likelihood is 36% in the next year, which appears to be consistent with the finding that 59% of the respondents received financial help in the past two years.
The subjective probabilities in Figure 2 also indicate that there is considerable hetero-geneity among respondents in their assessments of the likelihood of facing a food crisis or of having to rely on family members. This heterogeneity may be related in part to dif-ferent experiences during the most recent food crisis in 2005, and it may also be related to a considerable variance in the susceptibility to a food crisis as a result of differences in land ownership, soil conditions, crop choices, etc. Our analyses of variation in these expectations by socioeconomic status below suggest that the latter factors are important, and that they systematically influence expectations.
Figure 2: Distribution of respondents’ subjective probability of
(a) experiencing a food shortage within the next twelve months, and (b) having to rely on family members for financial assistance in the next twelve months, by gender, region, and age group (a) Experiencing a food shortage within the next twelve months
0 .0 0 .2 0 .4 0 .6 0 .8 1 .0 males females by gender 0 .0 0 .2 0 .4 0 .6 0 .8 1 .0 0 .0 0 .2 0 .4 0 .6 0 .8 1 .0
N C S
males by region
0 .0 0 .2 0 .4 0 .6 0 .8 1 .0 0 .0 0 .2 0 .4 0 .6 0 .8 1 .0 0 .0 0 .2 0 .4 0 .6 0 .8 1 .0
N C S
females by region
0 .0 0 .2 0 .4 0 .6 0 .8 1 .0 0 .0 0 .2 0 .4 0 .6 0 .8 1 .0 0 .0 0 .2 0 .4 0 .6 0 .8 1 .0
<20 20− 30− 40− 50+ 29 39 49
males by age group
0 .0 0 .2 0 .4 0 .6 0 .8 1 .0 0 .0 0 .2 0 .4 0 .6 0 .8 1 .0 0 .0 0 .2 0 .4 0 .6 0 .8 1 .0 0 .0 0 .2 0 .4 0 .6 0 .8 1 .0 0 .0 0 .2 0 .4 0 .6 0 .8 1 .0
<20 20− 30− 40− 50+ 29 39 49
females by age group
0 .0 0 .2 0 .4 0 .6 0 .8 1 .0 0 .0 0 .2 0 .4 0 .6 0 .8 1 .0 0 .0 0 .2 0 .4 0 .6 0 .8 1 .0 0 .0 0 .2 0 .4 0 .6 0 .8 1 .0 0 .0 0 .2 0 .4 0 .6 0 .8 1 .0
Figure 2: (Continued)
(b) Having to rely on family members for financial assistance in the next twelve months 0 .0 0 .2 0 .4 0 .6 0 .8 1 .0 males females by gender 0 .0 0 .2 0 .4 0 .6 0 .8 1 .0 0 .0 0 .2 0 .4 0 .6 0 .8 1 .0
N C S
males by region
0 .0 0 .2 0 .4 0 .6 0 .8 1 .0 0 .0 0 .2 0 .4 0 .6 0 .8 1 .0 0 .0 0 .2 0 .4 0 .6 0 .8 1 .0
N C S
females by region
0 .0 0 .2 0 .4 0 .6 0 .8 1 .0 0 .0 0 .2 0 .4 0 .6 0 .8 1 .0 0 .0 0 .2 0 .4 0 .6 0 .8 1 .0
<20 20− 30− 40− 50+ 29 39 49
males by age group
0 .0 0 .2 0 .4 0 .6 0 .8 1 .0 0 .0 0 .2 0 .4 0 .6 0 .8 1 .0 0 .0 0 .2 0 .4 0 .6 0 .8 1 .0 0 .0 0 .2 0 .4 0 .6 0 .8 1 .0 0 .0 0 .2 0 .4 0 .6 0 .8 1 .0
<20 20− 30− 40− 50+ 29 39 49
females by age group
0 .0 0 .2 0 .4 0 .6 0 .8 1 .0 0 .0 0 .2 0 .4 0 .6 0 .8 1 .0 0 .0 0 .2 0 .4 0 .6 0 .8 1 .0 0 .0 0 .2 0 .4 0 .6 0 .8 1 .0 0 .0 0 .2 0 .4 0 .6 0 .8 1 .0
Notes:Region is coded as: N = North (Rumphi), C = Center (Mchinji), S = South (Balaka).
Figure 2 also reveals marked regional differences, and respondents in the northern region report the smallest probabilities of experiencing food shortages or of having to rely on family members for financial assistance. This pattern is consistent with the regional variation in the most recent drought in 2005: the worst affected part of the country was the southern region, followed by the central region and then the northern region (European
Commission 2005; USAID 2005b).13 The subjective expectations about food shortage
and financial assistance reported follow exactly the regional variation in the drought. Figure 3a reveals that respondents’ subjective assessments of probability of food shortages vary meaningfully with respondents’ socioeconomic status (SES). For example, respondents who have more education, are married, own relatively large amounts of land, and have any savings all rate the probability of experiencing a food shortage lower than their counterparts who have less education, are divorced/separated/widowed, own little land, or do not have savings. A very similar—albeit less pronounced—pattern exists with
13The southern region was the hardest hit by the drought, with over 70 % of the affected population being
respect to the expectation of having to rely on family members for financial assistance within the next twelve months. In summary, Figure 3a provides a clear indication that in-dividuals with higher socioeconomic status are less concerned about experiencing a food shortage or of having to rely on family members for assistance in the near future, consis-tent with the finding that higher SES individuals are less vulnerable to food and financial
crises.14 These marked socioeconomic differences in subjective expectations regarding
food shortages, or of having to rely on family members for financial assistance, are in sharp contrast to the subjective probability of winning in a game of Bawo, where—except for a modest education gradient—socioeconomic differences are absent (Figure 3c). This pattern is expected if the ability to win in a game of Bawo against the interviewer depends on individual-specific aspects of the respondent and the interviewer that do not rely on marital status, land ownership, or similar factors.
Figure 3: Distribution of ever-married respondents’ subjective probability of (a) experiencing a food shortage within the next twelve months, and (b) having to rely on family members for financial assistance in the next twelve months, and (c) winning a game of Bawo played against the interviewer, by gender and socioeconomic status
(a) Experiencing a food shortage within the next twelve months
0 .0 0 .2 0 .4 0 .6 0 .8 1
.0 Males Females
Education low med high
0 .0 0 .2 0 .4 0 .6 0 .8 1 .0 0 .0 0 .2 0 .4 0 .6 0 .8 1 .0 0 .0 0 .2 0 .4 0 .6 0 .8 1 .0 Marital status mar div sep/wid 0 .0 0 .2 0 .4 0 .6 0 .8 1 .0 0 .0 0 .2 0 .4 0 .6 0 .8 1 .0 Land owner− ship <=2 2−4 >4
acres 0 .0 0 .2 0 .4 0 .6 0 .8 1 .0 0 .0 0 .2 0 .4 0 .6 0 .8 1 .0 0 .0 0 .2 0 .4 0 .6 0 .8 1 .0 Any savings no yes 0 .0 0 .2 0 .4 0 .6 0 .8 1 .0 0 .0 0 .2 0 .4 0 .6 0 .8 1 .0 Education low med high
0 .0 0 .2 0 .4 0 .6 0 .8 1 .0 0 .0 0 .2 0 .4 0 .6 0 .8 1 .0 0 .0 0 .2 0 .4 0 .6 0 .8 1 .0 Marital status mar div sep/wid 0 .0 0 .2 0 .4 0 .6 0 .8 1 .0 0 .0 0 .2 0 .4 0 .6 0 .8 1 .0 Land owner− ship <=2 2−4 >4
acres 0 .0 0 .2 0 .4 0 .6 0 .8 1 .0 0 .0 0 .2 0 .4 0 .6 0 .8 1 .0 0 .0 0 .2 0 .4 0 .6 0 .8 1 .0 Any savings no yes 0 .0 0 .2 0 .4 0 .6 0 .8 1 .0 0 .0 0 .2 0 .4 0 .6 0 .8 1 .0
14The differences by education, marital status and land ownership are statistically significant in linear
Figure 3: (Continued)
(b) Having to rely on family members for financial assistance in the next twelve months 0 .0 0 .2 0 .4 0 .6 0 .8 1
.0 Males Females
Education low med high
0 .0 0 .2 0 .4 0 .6 0 .8 1 .0 0 .0 0 .2 0 .4 0 .6 0 .8 1 .0 0 .0 0 .2 0 .4 0 .6 0 .8 1 .0 Marital status mar div sep/wid 0 .0 0 .2 0 .4 0 .6 0 .8 1 .0 0 .0 0 .2 0 .4 0 .6 0 .8 1 .0 Land owner− ship <=2 2−4 >4
acres 0 .0 0 .2 0 .4 0 .6 0 .8 1 .0 0 .0 0 .2 0 .4 0 .6 0 .8 1 .0 0 .0 0 .2 0 .4 0 .6 0 .8 1 .0 Any savings no yes 0 .0 0 .2 0 .4 0 .6 0 .8 1 .0 0 .0 0 .2 0 .4 0 .6 0 .8 1 .0 Education low med high
0 .0 0 .2 0 .4 0 .6 0 .8 1 .0 0 .0 0 .2 0 .4 0 .6 0 .8 1 .0 0 .0 0 .2 0 .4 0 .6 0 .8 1 .0 Marital status mar div sep/wid 0 .0 0 .2 0 .4 0 .6 0 .8 1 .0 0 .0 0 .2 0 .4 0 .6 0 .8 1 .0 Land owner− ship <=2 2−4 >4
acres 0 .0 0 .2 0 .4 0 .6 0 .8 1 .0 0 .0 0 .2 0 .4 0 .6 0 .8 1 .0 0 .0 0 .2 0 .4 0 .6 0 .8 1 .0 Any savings no yes 0 .0 0 .2 0 .4 0 .6 0 .8 1 .0 0 .0 0 .2 0 .4 0 .6 0 .8 1 .0
(c) Winning a game of Bawo
0 .0 0 .2 0 .4 0 .6 0 .8 1
.0 Males Females
Education low med high
0 .0 0 .2 0 .4 0 .6 0 .8 1 .0 0 .0 0 .2 0 .4 0 .6 0 .8 1 .0 0 .0 0 .2 0 .4 0 .6 0 .8 1 .0 Marital status mar div sep/wid 0 .0 0 .2 0 .4 0 .6 0 .8 1 .0 0 .0 0 .2 0 .4 0 .6 0 .8 1 .0 Land owner− ship <=2 2−4 >4
acres 0 .0 0 .2 0 .4 0 .6 0 .8 1 .0 0 .0 0 .2 0 .4 0 .6 0 .8 1 .0 0 .0 0 .2 0 .4 0 .6 0 .8 1 .0 Any savings no yes 0 .0 0 .2 0 .4 0 .6 0 .8 1 .0 0 .0 0 .2 0 .4 0 .6 0 .8 1 .0 Education low med high
0 .0 0 .2 0 .4 0 .6 0 .8 1 .0 0 .0 0 .2 0 .4 0 .6 0 .8 1 .0 0 .0 0 .2 0 .4 0 .6 0 .8 1 .0 Marital status mar div sep/wid 0 .0 0 .2 0 .4 0 .6 0 .8 1 .0 0 .0 0 .2 0 .4 0 .6 0 .8 1 .0 Land owner− ship <=2 2−4 >4
acres 0 .0 0 .2 0 .4 0 .6 0 .8 1 .0 0 .0 0 .2 0 .4 0 .6 0 .8 1 .0 0 .0 0 .2 0 .4 0 .6 0 .8 1 .0 Any savings no yes 0 .0 0 .2 0 .4 0 .6 0 .8 1 .0 0 .0 0 .2 0 .4 0 .6 0 .8 1 .0
Notes: Ever-married respondents only; region is coded as: N = North (Rumphi), C = Center (Mchinji),
The availability of subjective expectations about food shortage and having to rely on family members also allows us to test whether respondents take into account that the out-comes of two events may have common underlying causes. For example, since assistance exchanged between family members is an important mechanism in rural Malawi for cop-ing with crises such as food shortages, respondents’ subjective expectations about these two events should be correlated: respondents who feel at greater risk of food shortage should also be more likely to expect to need financial help. To test this hypothesis, we estimate a linear regression of the responses to the question about the likelihood of having to rely on financial assistance (the number of beans), and on the likelihood of experienc-ing food shortage. Other demographic and economic variables are used as independent variables (Appendix Table B4). The regression results show that a higher likelihood of experiencing a food shortage is significantly and positively associated with reporting a higher likelihood of needing financial assistance: an additional bean on the likelihood of food shortage is associated with 0.22 additional beans on the likelihood of needing financial assistance. The magnitude of this association remains essentially unchanged if additional controls for education, marital status, land ownership, or having savings are introduced.
6.3 Infant mortality
Respondents were asked the likelihood that a baby born in their community this month
will die within one year.15 Infant mortality, unfortunately, continues to be a fairly
com-mon event in rural Malawi. The Malawi DHS, for instance, estimated an infant mortality rate, i.e., the probability of dying before the first birthday, of 98 per 1,000 for rural ar-eas during 1994–2004 (Malawi DHS 2004). Respondents subjective expectations about infant mortality are in close correspondence to these DHS-estimated probabilities (Ta-ble 3): one bean—corresponding, on average, to an implied infant mortality of 100 per 1,000 births—is the most common answer, with the two next common answers being zero and two beans. Overall, 58% of the respondents placed two or fewer beans in the plate, thus estimating infant mortality as less than 250 per 1,000, which corresponds well with the DHS estimates, as infant mortality varies considerably across regions and can be as high as 145 per 1,000 in some districts. Respondents are aware of these regional differ-ences: the central tendencies and percentiles of the distribution of implied probabilities by region match remarkably well the regional differences reported in the Malawi DHS (graphs not shown). Respondents are also clearly aware that the death of an infant is not a very likely event, as 77% of them placed four beans or fewer in the plate, and the me-dian of subjective probabilities about infant mortality is 20%. Nevertheless, about 25%
15The question asked about “a baby born in your community,” and the interpretation of “community” was left
of respondents—both male and female—made subjective estimates of the probability of infant mortality in excess of 43%. This is somewhat in contrast to actual mortality trends for Malawi overall, which show declines in infant mortality over the last decade, despite
HIV/AIDS (Malawi DHS 2000, 2004).16 A possible explanation for this overestimation
of infant mortality in a subset of the population may be related to the problem of inferring mortality risks by observing trends in infant deaths. In particular, when the population is growing, infant mortality rates can decrease, while the total number of infant deaths increases (Montgomery 1998). Another possibility could be that people’s estimates are based on the “availability” heuristic (Tversky and Kahneman 1974). For example, Licht-enstein et al. (2008) find that people overestimate the probability of lethal events due to sensational causes like tornado or homicides because those are widely reported in the media.
7. HIV/AIDS-related expectations
Individuals have been shown to mostly overestimate, but sometimes also underestimate, their risk of HIV infection (e.g., Aggleton et al. 1994; Pinkerton et al. 2000; Tharawan et al. 2003). In this section we evaluate the ability to elicit HIV/AIDS-related expectations using the interactive approach introduced in Section 4, and how respondents’ subjective expectations about their own HIV status or the adoption of risk-prevention strategies (such as condom use) vary by socioeconomic characteristics. We will also assess whether per-ceptions of being HIV-positive are consistent with recent estimates of HIV prevalence, and whether respondents can accurately identify whether they belong to groups with el-evated or reduced risk of HIV infection. We also compare whether the expectations of individuals about condom use in the future are consistent with their behavior in the past.
7.1 Expectations about own HIV infection
Figure 4a presents the distribution of answers about the likelihood of being currently in-fected with HIV/AIDS (see Table 3 for actual responses in terms of number of beans). These subjective probabilities of HIV infection can be compared to the actual HIV preva-lence among MDICP respondents of 6.9% (7.9% for females and 5.6% for males) (Obare
et al. 2009).17 This prevalence among MDICP respondents is somewhat below the DHS
estimate of 10.8% for rural Malawi (12.5% for females and 8.8% for males) (Malawi DHS 2004), but very close to the SSA average HIV prevalence of 6.1% (UNAIDS 2006).
16However, in many countries of sub-Saharan Africa, particularly those severely affected by AIDS, there is
evidence of a reversal of the child mortality decline during the 1990s (Zaba, Whiteside, and Boerma 2004).
17Prevalence is tested based on the subset of respondents (N= 3,037) who participated in the HIV test after
The difference between the DHS and MDICP prevalence is not due to age structure dif-ferences or difdif-ferences in the HIV test participation rates (Obare 2006), but is likely due to the absence of peri-urban areas—such as rural trading centers—among the MDICP sample villages (Obare et al. 2009).
Contrary to claims that individuals in sub-Saharan Africa tend to overestimate their risk of being HIV-positive and are fatalistic about their infection status, the elicited sub-jective probabilities of current HIV infection are relatively low. Two-thirds of the respon-dents allocated zero beans in response to this question, while only 1% choose ten beans. The most common answers were, in order, zero beans (67% of respondents), one bean (9.6% of respondents), and two beans (7.5% of respondents). Women’s mean subjective probability is equal to 14.5%, and that of men equals 9.5%. The sign and magnitude of this difference corresponds to the observed differences in HIV prevalence by gender, which show a 30% higher prevalence for women than for men. If we restrict the sample to individuals aged 15 to 49, the average implied probability is 12.7% (14.7% for females and 9.8% for males).
Figure 4: Respondent’s subjective probability of being infected with HIV now
(a) By gender, region and age-group
0 .0 0 .1 0 .2 0 .3 0 .4 0 .5 males females by gender 0 .0 0 .1 0 .2 0 .3 0 .4 0 .5 0 .0 0 .1 0 .2 0 .3 0 .4 0 .5
N C S
males by region
0 .0 0 .1 0 .2 0 .3 0 .4 0 .5 0 .0 0 .1 0 .2 0 .3 0 .4 0 .5 0 .0 0 .1 0 .2 0 .3 0 .4 0 .5
N C S
females by region
0 .0 0 .1 0 .2 0 .3 0 .4 0 .5 0 .0 0 .1 0 .2 0 .3 0 .4 0 .5 0 .0 0 .1 0 .2 0 .3 0 .4 0 .5
<20 20− 30− 40− 50+ 29 39 49 males by age group
0 .0 0 .1 0 .2 0 .3 0 .4 0 .5 0 .0 0 .1 0 .2 0 .3 0 .4 0 .5 0 .0 0 .1 0 .2 0 .3 0 .4 0 .5 0 .0 0 .1 0 .2 0 .3 0 .4 0 .5 0 .0 0 .1 0 .2 0 .3 0 .4 0 .5
<20 20− 30− 40− 50+ 29 39 49 females by age group