Journal of Plant Molecular Breeding (JPMB) Vol. 3/ Issue 1/ June 2015/ 35-49
Study of genetic diversities and relatedness of Iranian citrus genotypes
using morphological and molecular markers
Hajar Abedinpour1, Nad Ali Babaeian Jelodar1, Gholam Ali Ranjbar1 & Behrouz Golein2
1. Department of Plant Breeding, Sari Agricultural Sciences and Natural Resources University, Sari, Iran.
2. Iran Citrus Research Institute, Ramsar, Iran.
Corresponding Author, Email: h_abedinpour@ymail.com
Received: March 2015 Accepted: June 2015
Abstract
Having knowledge about genetic relationships among accessions is necessary for developing breeding strategies to produce improved cultivars. In present study, genetic diversity and inter-relationship among 29 genotypes of citrus were comparatively analyzed using morphological and RAPD markers. Significant variability was observed among citrus genotypes for 61 quantitative and qualitative morphological characters of leaves, fruits and seeds. Furthermore, the RAPD markers revealed a high polymorphism rate (91.82 %). A pair-wise similarity value between genotypes ranged from 0.14 to 0.97 with average of 0.62. Both morphological and molecular analysis indicated a high degree of variation among studied genotypes. In current research, genotypes “pummelo” and “mandarin” were confirmed as true species of citrus in distinct cluster. Results of present study proved that both of morphological and molecular markers are potential tools for determining genetic diversities and genetic relationships of citrus genotypes and can be used in citrus breeding programs.
Keywords: Citrus, Cluster analysis, Genetic variability, Molecular markers.
Introduction
Citrus is one of the most economically important fruit crops in worldwide (20).
Citrus and its closed relatives are represented by 28 genera from tribe Citreae of subfamily Aurantioideae in family Rutaceae (32). Citrus taxonomy and phylogeny are very complicated, controversial and confusing, mainly due to sexual compatibility between Citrus
and its related genera, the high frequency of bud mutations and the
long history of cultivation and wide distribution (24).
36
Morphological characterization in combination with molecular markers would be more rewarding in terms of
accurate identification and
characterization of most closely related cultivars at intra-specific level. Molecular marker techniques are
routinely used for proper
characterization, management and conservation of germplasm collections of horticultural species (16).
Among molecular markers, random amplified polymorphic DNA (RAPD) markers have been employed most widely for characterization of plant species. RAPD markers are simple, fast, and sensitive. They require no prior knowledge about DNA sequence and can amplify a large number of DNA fragments for reaction (35).
RAPD markers are routinely used for proper characterization, management and conservation of germplasm collections of Citrus species. For example, RAPD has been used to generate linkage map for citrus (6). Federici et al. (11) examined the phylogenetic relations of 88 accessions representing 45 Citrus species and six related genera by utilizing RFLP and RAPD markers. Overall, these previous studies demonstrated that molecular markers are powerful tools for elucidating genetic diversity, determining parentage, and revealing phylogenetic relationships among various citrus species. Nicolosi et al.
(24) used RAPD, SCAR, and cpDNA markers to elucidate phylogenetic relationships and genetic origins of hybrids in 36 accessions of Citrus and one accession from each of four related
genera and indicated that Fortunella is phylogenetically close to Citrus while the other three related genera are distant from Citrus and from each other. Dehestani et al. (9) evaluated the genetic diversity in 52 genotypes of Navel orange in Mazandaran province (Iran) using RAPD marker and reported high polymorphism (70.13%). Malik et al. (20) investigated genetic diversity and inter-relationship among 22 cultivars of C. sinensis based on morphological and RAPD markers. In their study, RAPD markers proved to be useful for germplasm characterization and diversity analysis in C. sinensis
cultivars. Pal et al. (27) studied genetic variability and relationships of mandarins using morphological and molecular markers. Their study revealed that both morphological and molecular markers can be successfully utilized for inferring genetic diversity and genetic relationship of mandarin group. Tripolitsiotis et al. (33) evaluated genetic similarity among 36 accessions of the Greek Citrus germplasm using RAPD and ISSR markers and indicated that both techniques were proven to be equally analytical with an average discrimination power above 0.9. The RAPD and ISSR markers were highly correlated and clustering based on their results are highly correspondence.
Citrus accessions formed separate clusters according to their species, even though sweet orange and mandarin cultivars revealed high affinity, while lemons were more divergent.
37
study was to assess genetic diversity and relationship of some important
Citrus genotypes using morphological and RAPD markers.
Materials and methods
Plant material and sample collection
A total of 29 genotypes of Citrus were collected from Iran Citrus Research
Institute, located at Tonekabon, Iran. These genotypes were used for morphological and molecular studies (Table 1). Flower, leaf and fruit samples of each genotypes were collected for confirmation of taxonomic identity, characterization and DNA extraction.
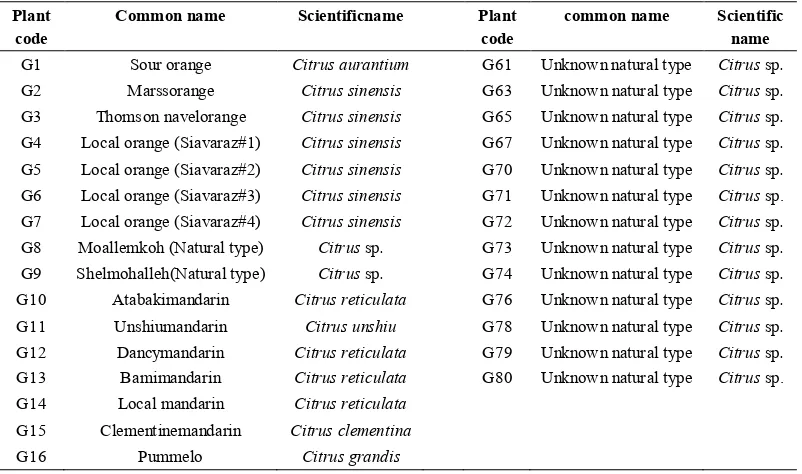
Table 1. Plant materials utilized for morphological and RAPD analysis.
Plant code
Common name Scientificname Plant code
common name Scientific name G1 Sour orange Citrus aurantium G61 Unknownnatural type Citrus sp. G2 Marssorange Citrus sinensis G63 Unknown natural type Citrus sp. G3 Thomson navelorange Citrus sinensis G65 Unknown natural type Citrus sp. G4 Local orange (Siavaraz#1) Citrus sinensis G67 Unknown natural type Citrus sp. G5 Local orange (Siavaraz#2) Citrus sinensis G70 Unknown natural type Citrus sp. G6 Local orange (Siavaraz#3) Citrus sinensis G71 Unknown natural type Citrus sp. G7 Local orange (Siavaraz#4) Citrus sinensis G72 Unknown natural type Citrus sp. G8 Moallemkoh (Natural type) Citrus sp. G73 Unknown natural type Citrus sp. G9 Shelmohalleh(Natural type) Citrus sp. G74 Unknown natural type Citrus sp. G10 Atabakimandarin Citrus reticulata G76 Unknown natural type Citrus sp. G11 Unshiumandarin Citrus unshiu G78 Unknown natural type Citrus sp. G12 Dancymandarin Citrus reticulata G79 Unknown natural type Citrus sp. G13 Bamimandarin Citrus reticulata G80 Unknown natural type Citrus sp. G14 Local mandarin Citrus reticulata
G15 Clementinemandarin Citrus clementina
G16 Pummelo Citrus grandis
Morphological characters
For achieving uniformity in current study only genotypes from Iran Citrus Research Institute were used. 15 leaves, 10 flowers and 10 fruits were randomly collected from each plant with three replications. 61 morphological characters (qualitative and quantitative) of flower, leaf, fruit and seed were determined according to the International Plant Genetic Resources Institute (IPGRI) protocols (13).
Samplings were done by randomly collection of 15 leaves, 10 flowers and
38
the unweighted pair group method with arithmetic average (UPGMA) based on simple matching coefficient using XLSTAT software version 2012.3.01 (2). Principal coordinate analysis (PCo) was also carried out for studying correlations among the variables and
establishing relationships among genotypes using the Genalex ver 6.5 software (28). The two-way Mantel test (21) for goodness of fit for the UPGMA cluster was also performed using the NTSYS ver. 2.10e software.
DNA isolation
From each genotyepe, five young leaves were taken and total genomic DNA was isolated from leaves using the CTAB
(hexadecyltrimethylammonium-bromide) method (22). The DNA concentration was determined spectrophotometrically (Nano Drop 1000) at 260 nm and its quality was checked by electrophoresis on 0.8 % agarose gel. The extracted DNA was diluted to 20ng/μl and stored at -20°C for PCR amplification.
PCR amplification
Thirty RAPD primers were initially screened and finally 19 primers that produced scorable polymorphic bands were selected for further analysis (Table 2).
DNA amplification was carried out in 25 μL reactions containing 20 ng of template DNA, 0.2 mM dNTPs, 10μM primer, 2.5 μL of 10× PCR Buffer (CinnaGen, Iran), 3 mM of magnesium chloride, 17.2 μL ddH2O and 1.5 unit of
Taq polymerase (CinnaGen, Iran). PCR amplification was carried out in a PTC-10096V Thermocycler (MJ Research,
Table 2. Statistical analysis and results of genetic diversity of 29 citrus genotypes.
Row
Primer Name
Primer Sequence 5' 3'
Annealing temperature
Total number of Bands
Number of Polymorphic
Bands
% polymorphism
PIC
1
OPB-12 CCTTGACGCA 37 15 13 86/66 0.216
2
OPE-09 CTTCACCCGA 37 16 16 100 0.120
3
OPA-04 AATCGGGCTG 37 15 14 93/33 0.263
4
OPA-07 GAAACGGGTG 37 19 19 100 0.235
5
OPA-08 GTGACGTAGG 37 10 9 90 0.282
6
OPA-19 CAAACGTCGG 37 12 11 91/66 0.267
7
OPG-05 CTGAGACGGA 37 11 9 81/81 0.247
8
OPG-06 GTGCCTAACC 37 16 14 87/5 0.226
9
OPB-08 GTCCACACGG 35 14 12 85/71 0.215
10
OPA-12 TCGGCGATAG 35 13 12 92/30 0.249
11
OPA-05 AGGGGTCTTG 37 9 8 88/88 0.224
12
OPA-18 AGGTGACCGT 37 19 18 94/73 0.197
13
OPM-11 GTCCACTGTG 37 17 15 88/23 0.265
14
OPM-14 AGGGTCGTTC 35 12 12 100 0.309
15
OPM-18 CACCATCCGT 37 11 10 90/90 0.189
16
OPG-04 AGCGTGTCTG 37 16 15 93/75 0.267
17
OPC-07 GTCCCGACGA 37 16 15 93/75 0.223
18
OPA-10 GTGATCGCAG 37 16 15 93/75 0.213
19
OPA-09 GGGTAACGCC 37 12 11 91/66 0.266
39
Inc, USA). The thermal cycler conditions for PCR reactions were an initial denaturation of 1 min at 94°C followed by 40 cycles comprising 1 min at 94°C, 1 min at 35-37℃ (annealing temperature was optimized for each primer) (Table 2), and 1 min and 30 s at 72°C. An additional step of 7 min at
72°C was used for final extension. Amplification products were separated by electrophoresis (8.3 V.cm-1) in 1.5% agarose gel and stained by ethidium bromide (10µg.ml-1). A photographic
record was taken under UV
illumination.
Table 3. Cophenetic coefficients obtained from algorithms with similarity coefficient.
UPGMA algorithm Simple connection algorithm
Complete connection algorithm
Dice similarity coefficient 0.972 0.979 0.986
Jaccard similarity coefficient
0.975 0.984 0.989*
Simple matching similaritycoefficient
0.979 0.977 0.986
Data analysis
Only clear and repeatable amplification products were scored as 1 for present bands and 0 for absent ones. Data were analyzed with the NTSYS-pc software package version 2.10 (29). A cluster analysis was performed using the unweighted pair group method with arithmetic average (UPGMA) based on simple matching coefficient using XLSTAT software version 2012.3.01 (2). The representativeness of dendrograms was evaluated by estimating cophenetic correlation for the dendrogram and comparing it with the similarity matrix, using Mantel’s matrix correspondence test (21). The result of this test is a cophenetic correlation coefficient, r, indicating how well the dendrogram represents similarity data. The percent of polymorphism was calculated using the formula (number of polymorphic bands/ total bands).
polymorphism information content (PIC) was calculated for dominant markers that the allelic relationship between their bands was unclear with the formula PIC=Σ [2fi (1-fi)]. The principal coordinate analysis (PCo) of the original binary data matrix was also performed using Genalex ver 6.5 software (28).
Results and Discussion
Morphological analysis
40
Figure 1. Dendrogram generated using UPGMA, showing relationships between 29 citrus genotypes based on morphological data.
The dendrogram obtained with 29 genotypes based on 61 quantitative and qualitative morphologic characteristics, separated citrus genotypes into five clusters (A, B, C, D and E), which diverged at a similarity index of 0.47 (Figure 1). Cluster A comprised pummelo (G16). Cluster B comprised Clementine mandarin (G15). Cluster C was divided into two sub-clusters, so that, sub-cluster C1 consisted of Shelmohalleh (G9) and sub-cluster C2 contained Dancy (G12), Local (G14), Bami (G13), Unshiu (G11) and Atabaki (G10) mandarins. In current study, Clementine (G15) and Unshiu (G11) were classified into two distinct clusters. In view of morphological characteristics of mandarins, similar results have been reported in previous studies (18, 7). Cluster D, contained sour orange (G01). Cluster E, the largest group, consisting genetically unknown local genotypes (G8, G61, G63, G65, G67, G70, G71, G72, G73,
G74, G76, G78, G79 and G80), Siavaraz (G4, G5, G6 and G7), Thomson Navel (G3) and Marss (G2) oranges. Within this cluster, the genetically unknown local genotypes G61 and G65 showed 0.70 genetic similarities. The Siavaraz oranges (G4, G5, G6 and G7) were very similar to Thomson navel (G3) (Figure 1). Rouhi Ghorabaie et al. (30) reported high similarity among oranges using morphological traits which is in agreement with the present study. The cophenetic analysis comparing the UPGMA cluster analysis and the simple
matching similarity matrix
demonstrated a correlation r= 0.86, indicating that data in matrix was well represented by the dendrogram.
Principal coordinate analysis:
41
A two-dimensional plot generated from PCA showed four groups which supporting the clustering pattern of the UPGMA dendrogram, except for
genotype sour orange (G01) which was included in oranges group, while it was present in cluster D in UPGMA clustering.
Figure 2. Principle Coordinate Analysis (PCo) ordination based on morphological data.
The analysis oriented the first three
principal components, which
contributed 62.27 % of the total variability of collected genotypes. Maximum variability was contributed by the first coordinate (27.07 %) followed by the second coordinate (20.47 %), and the third coordinate (14.72 %).
RAPD analysis
From total of 19 screened primers, 269 bands with high intensity were scored. The number of bands scored per primer combination ranged from 9 (OPA-05) to 19 (OPA-07 and OPA-18), with a mean of 14. Overall, the polymorphic band number varied between 8 (OPA-05) and 19 (OPA-07), with a mean of 13. The PIC values for the 19 primers ranged from 0.120 to 0.309, with an average of 0.230 (Table 2).
In order to classify genotypes based on RAPD data, Dice, Jaccard and the Simple matching similarity coefficient
were calculated. Based on comparison of the correlations in matrices of similarity, each matrix of similarity was used to draw clusters using UPGMA algorithms, simple and complete connection. Cophenetic coefficient was calculated for every cluster. This coefficient shows the severity of similarity between matrix and cluster. Therefore, greater number resulted from the comparison between coefficient matrix and cophenetic matrix, indicating goodness of fit of the cluster analysis to the similarity matrix (23). Accordingly, Jaccard similarity coefficient and UPGMA algorithms were chosen as the most compatible similarity coefficient and clustering algorithm (Table 3).
42
and similarity matrix was found to be high (r= 0.98, P < 0.01), suggesting that the cluster analysis strongly represents
the similarity matrix. The genotypes studied had similarity values ranging from 0.14 to 0.97.
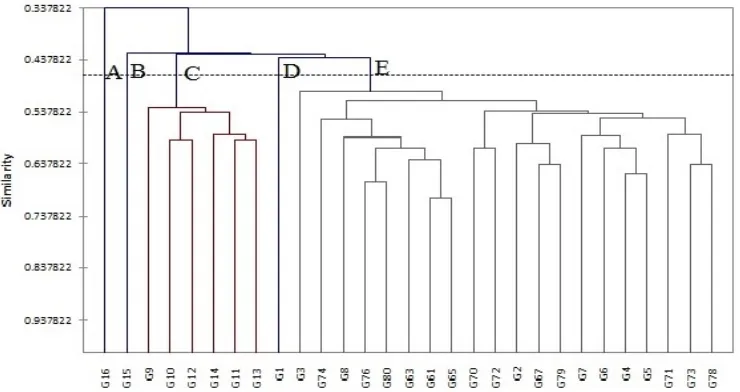
Figure 3. Dendrogram generated using UPGMA, showing relationships between 29 citrus genotypes, using RAPD data.
Results of similarity matrix showed that the highest genetic similarity (0.97) was existed between genotypes G74 and G73 and the lowest genetic similarity (0.14) was observed between genotypes of pummelo and Local mandarin. UPGMA dendrogram was generated by RAPD data and average similarity (0.49) for all genotype pairs was used as a cut off value for defining the clusters (Figure 3). From this dendrogram, 29 genotypes could be classified into five classes (A, B, C, D and E).
Considering the dendrogram (Figure 3), cluster A, included sour orange (G1). Sour orange showed similarity values of 0.26 and 0.42 with pummelo and mandarin, respectively. According to previous works, have suggested that sour orange is a natural hybrid between
43
large number of oranges, there is a high level of genetic similarity among oranges (34). Furthermore, accessions arising from spontaneous mutations are also often difficult to be distinguished (4). According to our data, Siavaraz genotypes were high similar to Thomson navel orange (G3), indicating that probably originated from bud mutation, and the idea was supported by SSR analysis(17, 15, 30).
Shelmohalleh (G9) had high similarity (0.68) to Siavaraz 3, whereas based on morphological data it was clustered in mandarin group. Also, Moallemkoh (G8) showed high similarity to Siavaraz 2 and Thomson navel. The present findings were consistent with the results of Jannati et al. (15). Using SSR markers, they reported that Moallemkoh (G8) had similarity to Thomson and Siavaraz and they concluded that this genotype probably obtained through the hybridization between them or a bud mutation.
Cluster D comprised with two subclusters, D1 including Clementine mandarin (G15) and D2 consisting of Dancy (G12), Local (G14), Bami (G13) and Atabaki (G10) mandarins. Within subcluster D2, high genetic similarity (0.82) was observed between the genotypes of Bami (G13) and Atabaki (G10) in spite of morphological differences. In both RAPD and morphological analysis, Clementine (G15) and Unshiu (G11) were classified into two distinct clusters. Coletta Filho
et al. (8) reported that they belong to two different groups. A high level of polymorphism (86%) was also reported by Campos et al. (7) in mandarins based
on morphological and AFLP markers. Although Coletta Filho et al. (8) reported very narrow genetic base of mandarin group using RAPD marker and proposed mandarin group as a single species mandarin. Mandarins are one out of three citrus types that Barrett and Rhodes (5) proposed as true species and a number of researches (24, 4, 34) supported this idea.
Using both of morphological and RAPD markers, Pummelo (G16) was placed into group E separately and showed a little similarity in comparison with other genotypes. Pummelo was reported as one of the three true citrus species by Barrett and Rhodes (5) and most of subsequent studies were followed by this statement (11, 24, 4, 34). Thus, Pummelo has played an important role as the parent of many citrus fruits, such as lemons, oranges and grapefruits.
Principal coordinate analysis:
44
(G8) were stayed together at the same group, whereas, in UPGMA clustering they were presented at two different clusters. Clemantine mandarin (G15) also formed a separate group in 2D plot but in dendrogram, it was placed at cluster D.
The analysis demonstrated that the first three principal components have contributed 77.74 % of total variability of collected genotypes. Maximum variability was created by the first component (46.17 %) followed by the second (20.44%), and the third components (11.13 %). In molecular set of data, two or three of the first
components can defined about 10-20 percent of changes, in which, are not statistically suitable for graphic display, but represents genetically desirable sample of total genome (31). In present study, 77.74% of total changes were determined mainly because of measuring only a few numbers of components. The applied primers have covered only a little chromosomal regions and have poor dispersion in various parts of genome. Hence, further investigation using more primers is necessary for covering whole plant genome.
Figure 4. Principle Coordinate Analysis (PCo) ordination based on RAPD data
Comparison between RAPD and morphological data
Comparing matrices of RAPD and morphological data showed a weak correlation between dendrograms (r= 0.47, P=0.99) following 500 random permutations with the Mxcomp procedure from NTSYS program. Despite the weak correlation between morphological and molecular analysis, similar groups were placed at respective dendrograms. Formation of five clusters was consistently found in both analyses,
45
found in mandarins by Koehler-Santos
et al. (18), who detected differences between dendrograms generated from morphological and SSR data, and suggested that morphological and molecular differences were apparently independent, due to different selection and evolutionary factors. The reasons for the non-correlation or weak correlation between morphological and molecular markers can be fallowing by these acts: 1- Low number of primers that are probably not cover as well genomic level and resulting in a weak correlation between the genes those controllers the molecular and morphological traits. 2- Morphological traits are affected by the environment or the effects of genotype and environment interaction or maybe have involved the effects of dominance, epistatic and pleiotropic or different allelic combinations may be lead to similar phenotypes and the resulting morphological differences that is not consistent with genetic differences. 3- Morphological characteristics are compared by RAPD sequences that may be have various levels of changes in evolutionary, as a nucleotide change that can alter RAPD phenotype but morphological trait may be preserve due to compatibility despite random mutations contingency. 4- Most of the genome of eukaryotic organisms are comprises non-coding regions that during evolution were exposed to mutation. RAPD sequences existed in the coding and non-coding sequences. Therefore many of the molecular markers are created in non-coding
regions that have not linkage with coding genes (3).
Conclusion
Comparison of morphological and molecular characterization data is of immense importance to conclude the extent of genetic diversity present in the set of cultivars (20). Generally, the applied primers in present study showed high PIC that indicating polymorphism and high efficiency. Furthermore, the morphological data showed highly variation among the selected citrus
genotypes. However, since
46
Acknowledgments
The help and cooperation received from Citrus Research Institute, I.R. Iran is fully acknowledged.
References
1. Abkenar, A.A., Isshiki, S., Matsumoto, R., and Tashiro, Y. 2007. Comparative analysis of organelle DNAs in acid citrus grown in Japan using PCR-RFLP method. Genet Resour Crop Evol, 55(4): 487-492.
2. Addinsoft, S.A.R.L. 2012: Leading Data Analysis and Statistical Solution for Microsoft Excel. Addinsoft SRL.
3. Azizian, A., Yazdi Samadi, B., Mozafari3, J., Shahnejat Boshehri A.A., and Naghavi, M.R. 2014. Genetic diversity of diploid wheat (Triticum urartu) using morphological traits and RAPD markers. J Plant Prod Res, 21(1): 149-166.
4. Barkley, N.A., Roose, M.L., Krueger, R.R., and Federici, C.T. 2006. Assessing genetic diversity and population structure in a citrus germplasm collection utilizing simple sequence repeat markers (SSRs). Theor Appl Genet, 112(8): 1519-1531.
5. Barrett, H.C., and Rhodes, A.M. 1976. A numerical taxonomic study of affinity relationships in cultivated Citrus and its close relatives. Syst Bot, 105-136.
6. Cai, Q.G.C.L., Guy, C.L., and Moore, G.A. 1994. Extension of the linkage map in Citrus
using random amplified polymorphic DNA (RAPD) markers and RFLP mapping of cold-acclimation-responsive loci. Theor and Appl Genet, 89(5): 606-614.
7. Campos, T.E., Gutiérrez Espinosa, M.A., Warburton, M.L., Santacruz Varela, A., and Villegas Monter, Á., 2005. Characterization of madarin (Citrus spp.) using morphological and AFLP markers. Interciencia, 30(11): 687-693.
8. Coletta Filho, H.D., Machado, M.A., Targon, M.L.P.N., Moreira, M.C.P.Q.D.G., and Pompeu Jr, J. 1998. Analysis of the genetic diversity among mandarins (Citrus spp.) using RAPD markers. Euphytica, 102(1): 133-139.
9. Dehestani, A., Kazemitabar, S.K., and Rahimian, H. 2007. Assessment of genetic diversity of navel sweet orange cultivars grown in Mazandaran province using RAPD markers. Asian J Plant Sci, 6:1119–1124.
10. Fang, D.Q., and Roose, M.L. 1997. Identification of closely related citrus cultivars with inter-simple sequence repeat markers. Theor Appl Genet, 95(3): 408-417.
11. Federici, C.T., Fang, D.Q., Scora, R.W., and Roose, M.L. 1998. Phylogenetic relationships within the genus Citrus (Rutaceae) and related genera as revealed by RFLP and RAPD analysis. Theor Appl Genet, 96(6-7): 812-822.
12. Herrero, R., Asins, M.J., Carbonell, E.A., and Navarro,L. 1996. Genetic diversity in the orange subfamily Aurantioideae. Intraspecies and intragenus genetic variability. Theor Appl Genet, 92(5): 599-609.
13. IPGRI (International Plant Genetic Resource Institute), 2000. Descriptors of Citrus. International Plant Genetic Resources Institute, Rome, Italy. p75.
47
15. Jannati, M., Fotouhi, R., Pourjanabad, A., and Salehi, Z. 2009. Genetic diversity analysis of Iranian citrus varieties using micro satellite (SSR) based markers. J Hortic For, 1(7): 120-125.
16. Karp, A,. Kresovich, S,. Bhat, K.V., Ayad, W.G., and Hodgkin, T. 1997. Molecular tools in plant genetic resources conservation: a guide to the technology. IPGRI Bull, 2-47.
17. Kianoush, S., Babaeian Jelodar, N., and Asadi Abkenar, A. 2009. Evaluation of genetic diversity in citrus germplasm using microsatellite (SSR) Markers. J Agri Sci Nat Resour, 15(6): 109-117.
18. Koehler-Santos, P., Dornelles, A.L.C., and Freitas, L.B.D. 2003. Characterization of mandarin citrus germplasm from Southern Brazil by morphological and molecular analyses. Pesqu Agropecu Bras, 38(7): 797-806.
19. Luro, F., Laigret, F., Bové, J.M., and Ollitrault, P. 1995. DNA amplified fingerprinting, a useful tool for determination of genetic origin and diversity analysis in Citrus. Hortscience, 30(5): 1063-1067.
20. Malik, S.K., Rohini, M.R., Kumar, S., Choudhary, R., Pal, D., and Chaudhury, R. 2012. Assessment of genetic diversity in Sweet Orange [Citrus sinensis (L.) Osbeck] cultivars of India using morphological and RAPD markers. Agric Res, 1(4): 317-324.
21. Mantel, N. 1967. The detection of disease clustering and a generalized regression approach. Cancer Res, 27: 209-220.
22. Murray, M. G., and Thompson, W.F., 1980. Rapid isolation of high molecular weight plant DNA. Nucleic Acids Res, 8(19): 4321-4326.
23. Nei, M., and Feldman, M. W. 1972. Identity of genes by descent within and between populations under mutation and migration pressures. Theor Popul Biol, 3(4): 460-465. 24. Nicolosi, E., Deng, Z.N., Gentile, A., La Malfa, S., Continella, G., and Tribulato, E., 2000.
Citrus phylogeny and genetic origin of important species as investigated by molecular markers. Theore Appl Genet, 100(8): 1155-1166.
25. Novelli,V.M., Cristofani, M., Souza, A.A., and Machado, M.A., 2006. Development and characterization of polymorphic microsatellite markers for the sweet orange (Citrus sinensis
L. Osbeck). Geneti Mol Biol, 29(1): 90-96.
26. Novelli, V.M., Machado, M.A., and Lopes, C.R. 2000. Isoenzymatic polymorphism in Citrus spp. and Poncirus trifoliata (L.) Raf.(Rutaceae). Genet Mol Biol, 23(1): 163-168. 27. Pal, D., Malik, S.K., Kumar, S., Choudhary, R., and Sharma, K. C. 2013. Genetic variability
and relationship studies of mandarin (Citrus reticulata Blanco) using morphological and molecular markers. Agric Res, 2(3): 236-245.
28. Peakall, R.O.D., and Smouse, P.E. 2006. GENALEX 6: genetic analysis in Excel. Population genetic software for teaching and research. Mol Ecol Notes, 6(1): 288-295. 29. Rohlf, F.J. 2000. NTSYS-pc: numerical taxonomy and multivariate analysis system, ver.
2.10e. Exeter Ltd., Setauket.
30. Rouhi Ghorabaie, H.R.R., Ghazvini, R.F., Golein, B., and Nabipour, A.R. 2010. Identification of some citrus accessions in a citrus germplasm utilizing simple sequence repeat markers (SSRs). Hortic Environ Biotechnol, 51(4): 343-347.
48
32. Swingle, W.T., and Reece, P.C. 1967. The botany of citrus and its wild relatives in the orange subfamily. In: Reuther, W., Webber, H.J., Batchelor, L.D. (Eds.), The Citrus Industry. University of California Press, Berkeley. pp:190–430.
33. Tripolitsiotis, C., Nikoloudakis, N., Linos, A., and Hagidimitriou, M. 2013. Molecular characterization and analysis of the greek citrus germplasm. Not Bot Horti Agrobotanici Cluj-Napoca, 41(2): 463-471.
34. Uzun, A., Yesiloglu, T., Tuzcu, O., and Gulsen, O. 2009. Genetic diversity and relationships within Citrus and related genera based on sequence related amplified polymorphism markers (SRAPs). Sci Hortic, 121(3): 306-312.