MORPHODYNAMIC ANLYSIS OF WIND FACES USING SPATIAL SAND
ROSE MODEL IN ZABOL AND ZAHAK REGION, IRAN
M R Rajabi1, F Rohani2, M R Ekhtessassi3, N Ghazanfarpoor4
1. MSc graduated student, Faculty of Natural Resources, Isfahan University of Technology,
[email protected] ,2. Faculty of Natural Resources, Isfahan University of Technology,3. Faculty of Natural Resources, University of Yazd, 4.Watershed Management MSc student, Tarbiat Modares University
Abstract
The majority of Iran’s area is covered by arid and semiarid climates. In these areas, wind causes more erosion compared to water. Therefore, determination of wind characteristics especially its velocity is very important. One of the simplest methods that can supply researchers with the origin of wind erosion in the shortest time is synthesizing sand rose model and interpretation of aerial photographs or satellite images. The main purpose of this research was to find the relationship of soil drift potential. Sand rose is a diagram that shows not only the direction of wind transportation but also the wind erosion potential. Using a formula, soil ablation potentials were determined for drawing sand rose. A computer program was used to simplify and speed up the computations and increase the accuracy. Two stations in Sistan – Balochestan province, namely Zabaol and Zahak were selected. These two stations are located on flat lands and are naturally faced with higher wind erosions. The two stations are faced with the 120 days winds of Sistan and have very high drift potential.
The results of this study show a south- southeast direction of drift potential, which exactly matches the direction of 120 days Sistan winds. Interpretation of aerial photographs and satellite images confirmed the sand rose study results because most of sand dunes showed a south – southeast direction of wind. Considering the location of sand dunes result drift direction, and the distance that sand can be transported, the locations of sand ablation was identified to be waterways and pediments of Sistan and also agricultural lands around Zabaol and zahak.
Key words: Iran, Zabol, Zahak, Sand rose, wind erosion
Introduction
In the investigation on the origin of sand dunes, the study of sand dune movement, sand dune expansion direction and wind regime are very important. Moreover, the identification of stormy and erosive winds
In the study of erosion, there are usually two kinds of indices. The first index measures the erosive factor and the second measures the erodibility condition. The aim of this study was to present a methodology to identify erosive winds (erosive factor) from the direction point of view and to quantify erosive force (wind energy).
As the erosive factor, wind is a vector having direction, magnitude and disturbance properties. Wind velocity and disturbance have key roles in sediment ablation and the wind ablation ability has a direct relationship with the wind velocity. Since the best time for (wind and water) erosion is the time of detachment, it is very important to identify the ablation regions in order to prevent erosion.
There are different methods for the identification of these areas. The study of sand dune geomorphology using aerial photographs, satellite images and wind regime studies will help us to identify ablation regions. The study of sand dune morphology and plotting sand roses are the easiest, fast and most accurate methods for the identification of wind ablation (Jeffrey et al., 2002).
Lancaster (1999) and Jeffery and Zobeck (2002) noted that wind regime is a useful method for the identification of wind ablation regions, as there is a strong correlation between wind regimes and sand dune forms. They studied the dynamic properties of sand dunes and found that dune morphology is a response to wind regime and sediment accumulation, particle size and
vegetation (Lancaster, 1999, Lancaster, 1995). For the study of the relationship between sand dune forms and wind regimes, Fryberger and Dean (1979) used TM satellite images. They could study the Ergs globally and compare them with each other (Goudie et al., 1999).
Sand rose diagrams are circle shape plot which show wind velocity and frequency and direction changes in the meteorological station. The aim of sand rose diagram is to find the weighted sum of peak-over threshold wind speeds in a particular direction. Different studies have indicated the proper complement between sand drift potential angles and the erosive wind direction (Goudie et al.,). Ekhtesasi (1995) found that wind rose is not able to show sand dune direction because all prevalent winds are not necessarily destructive (Alijani et al., 1992). Ashtari (2001) demonstrated this disability and suggested the use of sand rose to find right way of sand transition (Ekhtessassi, 2004).
Material and Methods
Study Area
The annual wind velocity of Zabol and Zahak station in Sistan-Balochestan province were used for this study (Table 1).
Wind Rose Plotting
observed wind data are scaled to 100%, the frequency of calm weather periods (wind
velocity of less than 1 knot, 0.5 m/s)and the frequency of periods in which wind has a
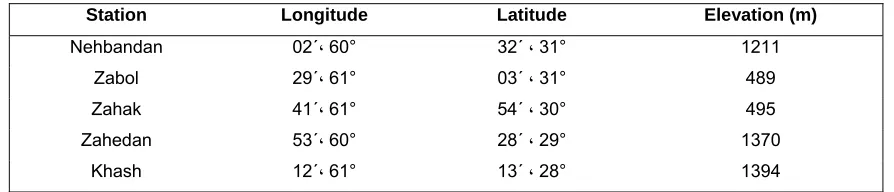
Table 1: The location of the selected stations
Elevation (m) Latitude
Longitude Station
1211 32´
02´، 60° ، 31°
Nehbandan
489 03´
29´، 61° ، 31°
Zabol
495 54´
41´، 61° ، 30°
Zahak
1370 28´
53´، 60° ، 29°
Zahedan
1394 13´
12´
Khash ، 61° ، 28°
certain direction were computed. The frequency of different wind speeds were drawn in an arm shape figure based on its velocity for each wind direction. The frequency of calm weather is usually written in the central circle of wind rose (Ahmadi, 1998). WRPLOT software with 8 and 16 wind directions were drawn for monthly, seasonal and annual peak over threshold wind speed.
Sand rose diagram plotting
The winds which are effective on sand dune formation are quantified based on the sand drift potential. Sand rose diagrams are a circle shape diagram which shows sand drift potential (DP) in 8 or 16 direction. The length of each arm is scaled based on DP and the resultant wind is showed with an arrow coming out from the center of diagram to the net trend direction.
The main difference between sand rose and wind rose is that wind rose shows the direction and velocity but the rose diagram shows the direction of sand transition and is related to wind speed and gives the wind energy and erodibility.
Computation of sand drift potential,
weighted factor and related sand rose
diagram parameters
The DP is calculated to estimate sand ablation and the comparison of wind energy. The equation is as follows:
DP =V2(V-V
t) × t (1)
DP: Drift Potential
V: wind speed in 10-meter height
Vt: threshold wind speed at 10-meter height
t= the frequency of wind in each direction V 2(v-vt): the weighted percentage
In order to find weighted factor, we need the threshold velocity which is measured as 6 m/s in 10-meter height (Ekhtessassi et al., 1994).
We first calculated the square of wind speed which is multiplied by the difference between wind threshold and observed data.
Then, the frequency of wind speed of any given direction is divided by the total observation. This is multiplied with the weighted factor to calculate DP.
of each arm drawn from the center of diagram. This will give us the resultant drift potential (RDP) as an indicator of the capability of sand drift. The angle between RDP and the north is called resultant drift direction (RDD). If the length of RDP is more than 50 mm, the length is scaled by a reduction factor called reduction factor (RF). Reduction factor can be used for the comparison of drift potential of different directions.
Fryberger (1979) suggested a scale for the comparison of wind erodibility and energy based on the DP as follows:
1) 0<DO<79 vector unit: Weak energy 2) 80<DP<99 vector unit: Low energy
3) 200<DP<399 vector unit: Moderate energy 4) DP>400 vector unit: High energy
Results and Discussion
Table 1 shows that for Nehbandan, zahedan and Khash station which are located in mountainous area with rock surface, the wind erosion is low while for Zabol and Zahak located in plains with high frequent wind, it is high. Sistan –Balochestan region is a closed playa and is similar of a dust blown. It is clear from table 2 and Fig. 1 that wind rose of Zabol has an annual prevalent north west wind and the second prevalent wind direction as the north winds. Peak over threshold wind speed wind rose indicates the north winds as erosive winds which match wind rose diagrams (Fig. 2). Over Drift wind rose shows the ability of 1376.8 DP unit which is a high value. Summer has the highest as 3580.1 DP. June and July have 4215.7 and 4148.3 DP, respectively.
Table2: The erodibility power, direction and wind speed of Zabol station
Figure1: Annual Windrose of Zabol station
Figure2: Annual sandrose of Zabol station
Zahak station has the same geographical location. As indicated in table 3 and Fig.3, north west and north are the first and the second prevalent wind directions, respectively. Peak over threshold wind speed wind rose indicates the north west winds as
erosive winds which match with wind rose diagrams showing the south east direction of sand transition (Fig. 4). Drift potential is also very high of about 1174.5 DP. Here, again, summer has the highest DP of 2935 DP and June has the highest DP of 3797.1.
Figure4: Annual sandrose of
Table3: The erodibility power, direction and wind speed of Zabol station
Generally the two stations of Zabol and Zahak have the same wind features and are influenced by “120-day Sistan Winds” which has local origin and occurs in summer. The direction of “120-day is north and north west. The results of sand rose diagrams and peak over threshold wind rose also prove the above conclusion. The results of this study also contest with the results of Kaviani and Alijani (Ekhtessassi et al., 1994). However, they did not mention the erdibility energy of these winds. These winds have 10 time erodibility energy more than central Iran, especially in summer (Ekhtessassi et al., 1994). The geographic location of the region, as mentioned above, is similar to a big sand bowl where the wind power increases due to the circulation of wind. The satellite images also show that that the origin of sand dunes
around Hamon Lake is the dry rivers of the piedmont of the mountainous area near Nehbandan-Khash. These piedmonts are about 20 to 60 Km from sand dunes. As the particle size of these sand dunes fall in moderate size and these particles are transited in moderate distance, we can assume these dry rivers as the origin of sand dunes. Based on wind regime and geomorphology of sand dunes, it can be said that the origin of sand dunes located in east Zabol and north Zahak is arable lands around the plain.
Conclusion
Current wind roses can not identify the erosive wind correctly (see Ekhtesasi (1994) and Ashatri (2001)). The rose diagrams were used in this study which show higher ability
for the identification of erosive wind direction, power, and time of occurrence and dust winds. The results also showed its ability to identify the origin region of sand dusts.
References
1. Ahmadi. H. (1998). Geomorphology of Application. PP. 300-350. University of Tehran.
2. Alijani. B. and Kavyani. M. R. (1992). Climatology. Samt Publication.
3. Ashtari. A. (2001). Origin of Sand Dune in Ardestan Region. Thesis. Isfahan University Of Technology- Faculty of Natural Resource. 4. Ekhtessassi. M. R. (2004). Study of morphometery and morphdynamic of Faces of wind erosion in Flat Yazd and Ardakan- Thesis of PHD. University of Tehran.
5. Ekhtessassi. M. R. and Ahmadi. H. (1994). Method of Origin determination of Sand dune in Iran. Journal of Natural Resource. No 47. 6. Fryberger, S. G. and Dean, G., (1979). Dune Form Sand Wind regime. United States Geological Survey. In: Professional Paper,
PP. 137 – 140.
7. Goudie, A.S., Livingston, L. and Stokes, S., (1999). The history of desert dune studies over the last 100 years. In: Aeolian Environment, sediment and landforms, (eds Goudie, A. S., Livingston, L and Stockes, S.). PP. 1-75. Willey, J and Sons.
8. Jeffrey, L. and zobek, T. M.( 2002). Climatic factors affecting mobility and stability of sand dunes. Proceeding of ICARS/GCTE- SEN conference, International center for arid and semiarid lands studies, Texas Tech
University, Lubbock, Texas, USA Publication 2002. PP.423-425.
9. Lancaster, N. (1999). Geomorphology of desert sand dune. In: Aeolian environment In: Sediments and landforms (eds Goudie, A. S., Livingston, L. and Stockes, S.). PP. 49- 71. Willey, J and sons.
10. Lancaster, N. (1995). Origin of Grandeserto sand sea. In: Desert Aeolian processes. (eds Tchakerian, W. P.). PP. 11- 32 Chapman and hall.