Journal of Industrial Engineering and Management Studies Vol. 4, No. 1, 2017, pp. 13-33
DOI: 10.22116/JIEMS.2017.51961 www.jiems.icms.ac.ir
Analyzing and prioritization of HSE performance evaluation
measures utilizing Fuzzy ANP (Case studies: Iran Khodro and
Tabriz Petrochemical)
Hamed Soleimani1,*, Tahere Fattahi Ferdos1
Abstract
Today, HSE (health, safety, and environment) systems play a vital role in green and sustainable aspects of the companies. However, performance evaluation of HSE systems is a crucial issue in industry and academia. This paper tries to identify and prioritize the effective factors in HSE performance in Iran Khodro (the largest automotive company in Iran) and Tabriz Petrochemical (one of the biggest Iranian petrochemical company). The factors are achieved through the literature and recent publications and then they are customized by the expert's opinions. Finally, a hybrid Fuzzy DEMATEL ANP approach is developed for prioritization of the factors. Indeed, Fuzzy DEMATEL is used in order to determine the relations among factors and sub factors and to help in providing ANP super matrix. Afterward, the Fuzzy ANP is proposed to find the final weights of the factors and sub factors. The weights are used in order to prioritize the factors for two selected companies.
Keywords:HSE; Performance evaluation; Factors and Sub factors; Fuzzy DEMATEL; Fuzzy ANP.
Received: July 2017-28 Revised: September 2017-08 Accepted: September 2017-21
1. Introduction
Safety is an absolutely relative but normative for any organization. This phrase is generally defined as "the condition of being safe from undergoing or causing hurt, injury, or loss". Today, rarely we can find a work environment where the HSE system is not implemented (Robson and Bigelow, 2010). The HSE system included various aspects related to health and safety management (Bacchetta, 2009). Regarding current popular measures in order to evaluate occupational health and safety management, AFR (Accident Frequency Rate) and ASR (Accident Severity Rate) are the most important ones (OSHA, 2007). The mentioned
* Corresponding Author; [email protected]
1 Department of Industrial Engineering, Faculty of Industrial and Mechanical Engineering, Islamic Azad
measures are quantitative, specific, and cannot be biasedly judged. Similar to other measures, they need a comprehensive recording system. Besides, the roots of the accidents are not known and we just have some statistics about the happenings. We cannot understand if an accident is happened based on the lack of training system and competencies or the weaknesses of the risk management system.
The other proposed approach of evaluating HSE system is implementation an effective auditing process. The audits would be performed based on the standards and regulations (Manuele, 2007). The auditing processes compare the situation of the HSE system with the acceptable point (the minimum level of the requirements). The system is checked with the requirements and the nonconformities are reported in order to set corrective actions (Su et al., 2005). Some auditing tools are for general work environments and some are completely special (Bigelow and Robson, 2005). Occupational Health and Safety Management System (OHSMS), and Occupational Health & Safety (OHSAS) Audit tool are two of the best (Redinger and Levine, 1999).
Recently, the growing interest of performance evaluation of HSE (health, safety, and environment) systems can be seen in industries. The reports of International Labor Organization (ILO) emphasize that around 4% of countries GDP are spent in occupational and health accidents (Sarmad nahri 2008). Therefore, one of the most important things of the industries is continuous improvement of HSE systems. However, in any improvement, identifying the measures and factors in order to evaluate the performance of HSE systems is absolutely significant. Each day, thousands of occupational accidents are happened around the world because of the labors' faults, defected machines, inappropriate warehousing, and other potential risks. When the accidents happen, the fact-finding teams start to analyze the accident, find the cause(s), and perform correcting actions in order to prevent other similar happenings. Then the related statistics are created based on the data analyses. The mentioned process is really expensive with irreparable results such as death and deep injuries.
On the other hand, preventive actions are identified as the best ways of decreasing the human and financial costs of the occupational accidents. Consequently, improving the capabilities of an HSE system would lead to dramatically falling down the side effects of the injuries including economic, human, and social damages. Finally, the issue of evaluation of an HSE system is the basic step of any improvement and preventive action. Indeed, the backbone of the control and improvement in any system such as HSE system is planning an appropriate performance evaluation structure (Beriha et al., 2011).
The next step in evaluating the performance of HSE system is to provide several adequate qualitative and quantitative measures. This is an absolutely crucial step in planning an effective evaluation system. American National Standards Institute (ANSI) suggests the frequencies of death and Injury-related disability as strong measures (NOROZI et al., 2015). Each year, various research institutes and governmental organizations study on the occupational injuries. International Labor Organization (ILO) reports 120 millions of work accidents in which 120 thousands of them are significant and tragedy (Sarmad nahri 2008). In spite of these facts, still we can monitor thousands of the easy-to-prevent accidents in industries their disastrous side effects. Besides, the development of industries and the vast usage of machines and tolls preserve the issue of improvement of HSE system completely vital.
automotive and the other in petrochemical industry). The reasons of selecting the mentioned two manufacturers are twofold: the number of workers and the importance and statistics of the accidents. More than 60 thousand employees are working in Iran Khodro Company (IKCO) and from this aspect it is the largest company in Iran. On the other hand, petrochemical companies have the highest reports of the work accidents in Iran with 12 accidents a day for 2016. Thus, Tabriz Petrochemical Company (TPC) is also selected as the representor of these types of industries. Exploiting the experts of the mentioned selected companies, the prioritization of the HSE evaluation system is undertaken in this research.
The rest of this paper is organized as follows: In Section 2, an appropriate literature review is discussed to find the current gaps. The backbone techniques of the study are presented in Section 3. Section 4 explains the methodology of the research. Results and discussions for Fuzzy DEMATEL and Fuzzy ANP are presented in Sections 5 and 6 respectively. Finally, conclusion, and suggestions for future research are presented in Section 7.
2. Literature review
Arabzadeh (2012) utilized a Job Safety Analysis (JSA) method in order to identified, evaluate (qualitatively), and controlling the risks of a leather company in Iran (Arabzadeh 2012). The same method is used in a tunnel construction of a water plant regarding OSHA 3071 by Barkhordari (2012). Both of the mentioned researches utilized MIL-STD-882E in order to assign the acceptable level of risk. Razavi 2015, tried to evaluate the HSE level in in Pars petrochemical complex utilizing JSA through several site visits and interviews. Murè and Demichela (2009) developed a Fuzzy-based procedure to quantify the risk of occupational accidents in a steel industry.
There are recent publications which are employed Multi-Attribute Decision Making (MADM) tools. Ng et al. (2010) investigated the epidemiology of patients of 196 severed-type of accidents between January 2006 and December 2007 in a single institution in Singapore. They could find that the most common cause of injury is fall from height with 66.3%. Chinese and Indian workers are on the top list of the most injured. They proposed the lack of training and mismanagement as the main factors which cause accidents. Arezes and Miguel (2003) compared the traditional indicators of health and safety performance with the potential role of safety culture in industries. Beriha et al. (2011) portrayed a benchmark occupational health and safety performance in industries employed Data envelopment analysis (DEA) as a robust mathematical evaluation tool regarding 30 Indian organizations. Similar to the mentioned paper, Shirooyezadeh (2011) exploits AHP/DEA approach in evaluating the safety level of a gas refinery in Assalouyeh oil and gas zone as the most important region of plants and refineries in Iran (Shirooyezadeh, 2011).
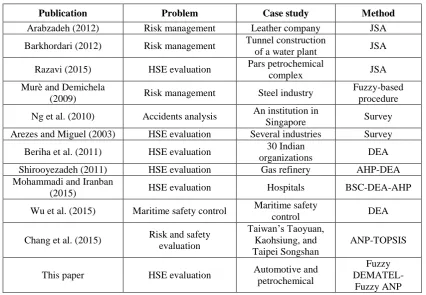
The summarization of the literature is illustrated in Table 1 in order to have a structured view of the earlier studies and the role of this paper in the literature:
Table 1. The summarization of the earlier studies
Publication Problem Case study Method
Arabzadeh (2012) Risk management Leather company JSA Barkhordari (2012) Risk management Tunnel construction
of a water plant JSA Razavi (2015) HSE evaluation Pars petrochemical
complex JSA
Murè and Demichela
(2009) Risk management Steel industry
Fuzzy-based procedure Ng et al. (2010) Accidents analysis An institution in
Singapore Survey
Arezes and Miguel (2003) HSE evaluation Several industries Survey Beriha et al. (2011) HSE evaluation 30 Indian
organizations DEA Shirooyezadeh (2011) HSE evaluation Gas refinery AHP-DEA Mohammadi and Iranban
(2015) HSE evaluation Hospitals BSC-DEA-AHP
Wu et al. (2015) Maritime safety control Maritime safety
control DEA
Chang et al. (2015) Risk and safety evaluation
Taiwan’s Taoyuan, Kaohsiung, and Taipei Songshan
ANP-TOPSIS
This paper HSE evaluation Automotive and petrochemical
Fuzzy DEMATEL-
Fuzzy ANP
According to the content of Table 1, it is clear that HSE evaluation problem is a matter of concern in various industries but the necessity of new approaches such as Fuzzy DEMATEL and Fuzzy ANP can be clearly seen. Therefore, two popular companies from two different industries (one in automotive and one in petrochemical) are selected for evaluating a new Fuzzy DEMATEL ANP approach for HSE evaluation.
Analyzing the abovementioned literature clarifies the following crucial points:
The HSE evaluation system is really significant in various types of industries and in this paper two of the most critical industries are selected to be investigated.
Developing new and effective approaches in evaluating the HSE systems is absolutely necessary specially the approaches which can regard expert opinions such as MADM approaches. Therefore, in this paper, a new Fuzzy DEMATEL-ANP approach is developed in order to find the relations and assign the weights.
3. The backbone techniques of the study
3.1. Fuzzy DEMATEL
DEMATEL is an effective paired comparison MADM method which was introduced in 1972 by Gabus and Fonetla (Gabus and Fontela, 1972). The technique is based on the experts' opinions and graph theory. In a directed graph, we can distinguish cause and effect types of nodes based on analyzing the bidirectional graph. At last, a structure of impacts between factors would be achieved from the analyses of DEMATEL. This technique is used in this paper based on the following reasons:
The identified criteria and sub criteria of the study are not independent to each other so that some methods such as AHP cannot be utilized. Consequently, an effective method is needed to analyze the impact and based on the historical performance; DEMATEL is selected as a preliminary step of ANP.
Analyzing the cause and effects by the experts could spot more lights on the subject of paired comparison. Furthermore, the precisions and quality of the judgments in ANP would be significantly elevated. This claim can be proved through investigating the inconsistencies of ANP.
The classical DEMATEL do not consider the uncertainties of the real world in judgments. In fact, the crisp types of paired comparisons are not advised in real-world environments. Finally, a Fuzzy DEMATEL is developed in this paper.
3.2. Fuzzy ANP
The analytic network process is a general version of the analytic hierarchy process. While AHP structures the alternatives, criteria, and sub criteria into a hierarchical form, ANP structures the problem as a network. Both ANP and AHP obey the pairwise comparisons rules in order to achieve the weights and ranks (Saati, 2001 and Saati, 2005). The networks of an ANP consist of several interconnected clusters with outer and inner dependencies and each cluster contains some criteria and sub criteria. The network is similar to a directed graph in which the directions come from a preliminary step in ANP or other professional methods such as DEMATEL (as is in this study). Since, regarding uncertainties in risk-type of issues such as accidents is vital, again Fuzzy ANP is developed for this paper to cover the lack of crisp judgments.
3.3. Statistical population
In this study, two companies from two different sectors (one in automotive and the other in petrochemical) are selected. As the largest automotive producers in Middle-East, IKCO does have much of a role to play in the areas associated with HSE. Besides, TPC is one of the largest petrochemical companies in Iran where many special health, safety, and environmental aspects should be critically implemented and monitored. On the other hand, in terms of number of labors, IKCO is the most significant producer in Iran and from the potential hazards; TPC is one of the most influential manufacturers in Iran.
4. The methodology of the research
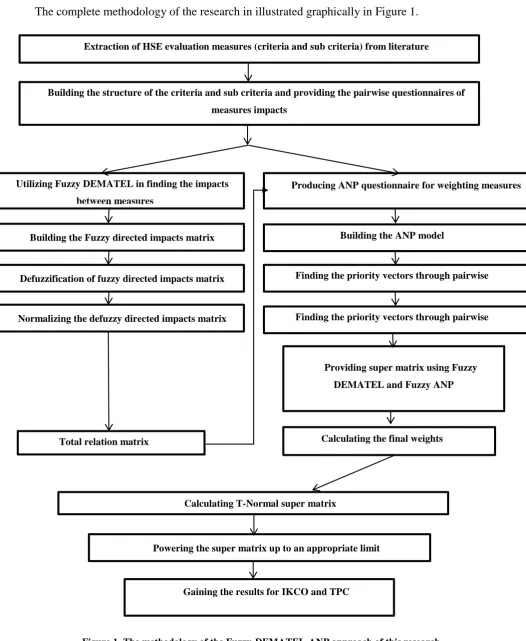
The complete methodology of the research in illustrated graphically in Figure 1.
Figure 1. The methodology of the Fuzzy-DEMATEL-ANP approach of this research
Figure 1. The methodology of the Fuzzy-DEMATEL-ANP approach of this research Extraction of HSE evaluation measures (criteria and sub criteria) from literature
Building the structure of the criteria and sub criteria and providing the pairwise questionnaires of measures impacts
Utilizing Fuzzy DEMATEL in finding the impacts between measures
Producing ANP questionnaire for weighting measures
Providing super matrix using Fuzzy DEMATEL and Fuzzy ANP
Building the ANP model
Calculating the final weights
Powering the super matrix up to an appropriate limit Building the Fuzzy directed impacts matrix
Total relation matrix
Gaining the results for IKCO and TPC Calculating T-Normal super matrix
Finding the priority vectors through pairwise comparisons
Defuzzification of fuzzy directed impacts matrix
Finding the priority vectors through pairwise comparisons
Based on Figure 1, the proposed approach of evaluating HSE measures consists of two main steps. Firstly, Fuzzy DEMATEL is analyzed for the criteria and sub criteria through appropriate pairwise comparisons and the cause and effect relations are achieved. Secondly, the results of DEMATEL are used in order to provide ANP super matrix and then Fuzzy ANP is progressed by the experts to find the weights of all measures. These weights are utilized in the process of HSE evaluations in two case studies: Iran Khodro Company (the sight of Tehran) and Tabriz Petrochemical Company.
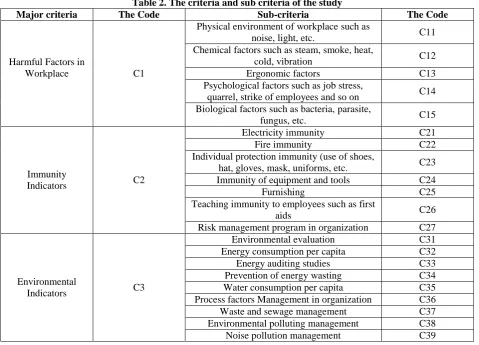
On the other hand, the selected criteria and sub criteria of the research are illustrated in Table 2.
Table 2. The criteria and sub criteria of the study
Major criteria The Code Sub-criteria The Code
Harmful Factors in
Workplace C1
Physical environment of workplace such as
noise, light, etc. C11
Chemical factors such as steam, smoke, heat,
cold, vibration C12
Ergonomic factors C13
Psychological factors such as job stress,
quarrel, strike of employees and so on C14 Biological factors such as bacteria, parasite,
fungus, etc. C15
Immunity
Indicators C2
Electricity immunity C21
Fire immunity C22
Individual protection immunity (use of shoes,
hat, gloves, mask, uniforms, etc. C23 Immunity of equipment and tools C24
Furnishing C25
Teaching immunity to employees such as first
aids C26
Risk management program in organization C27
Environmental
Indicators C3
Environmental evaluation C31 Energy consumption per capita C32
Energy auditing studies C33
Prevention of energy wasting C34 Water consumption per capita C35 Process factors Management in organization C36 Waste and sewage management C37 Environmental polluting management C38 Noise pollution management C39
The presented criteria and sub criteria of Table 2 are derived from literature customizing by the experts.
5. Results and discussions: fuzzy DEMATEL
Fuzzy DEMATEL of this study is similar to its deterministic format but the opinions of the experts are received qualitatively and convert to Fuzzy numbers. Thus, the calculations are undertaken using Fuzzy rules (Chen et al. 2008). The first step of the evaluation process is Fuzzy DEMATEL which is undertaken as follows:
5.1. Preparing fuzzy directed impacts matrix
j (in column) in five levels of judgment: very high, high, low, very low, and no effect. Then, the qualitative measures are fuzzified similar to illustrated in Table 3 (Chen-Yi et al. 2007).
Table 3. The linguistic variables and the corresponding Fuzzy numbers Triangular Fuzzy numbers The variables
(0.75,1.0,1.0) Very High impact (VH)
(0.5,0.75,1) High impact (H)
(0.25,0.5,0.75) Low impact (L)
(0,0.25,0.5) Very Low impact (VL)
(0,0,0.25) No impact (NO)
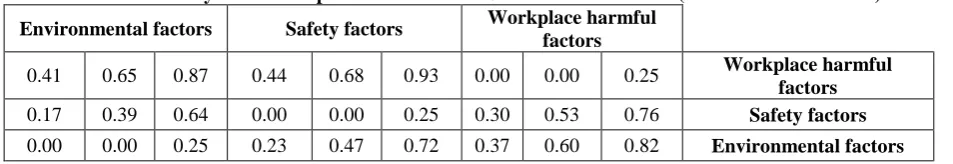
The opinions of the experts about the cause and effect interactions between criteria and sub criteria are received and integrated using arithmetic mean such as Chen et al. 2008. The output of this step is finding the Fuzzy directed impacts (𝑍̃). A total of 30 experts in TPC are filled out the DEMATEL questionnaires. Table 4 presents the Fuzzy directed impacts matrix for TPC for the main factors (criteria versus criteria).
Table 4. The Fuzzy directed impacts matrix for TPC for the main factors (criteria versus criteria) Environmental factors Safety factors Workplace harmful
factors
0.41 0.65 0.87 0.44 0.68 0.93 0.00 0.00 0.25 Workplace harmful
factors
0.17 0.39 0.64 0.00 0.00 0.25 0.30 0.53 0.76 Safety factors
0.00 0.00 0.25 0.23 0.47 0.72 0.37 0.60 0.82 Environmental factors
5.2. Defuzzification of directed impacts matrix
Roughly, up to now, the opinions get qualitatively from the experts, then they are fuzzified based on the earlier discussions. Afterward they are integrated to a matrix and finally in this stage they are defuzzified. The method is based on the Opricovic and Tzeng (2003). Therefore, in order to continue the calculations, the impact matrix is needed to be defuzzified and convert to its deterministic counterpart. In this paper the defuzzification process of is utilized in which the authors suggest a five-phase approach in order to deffuzify a triangular fuzzy matrix to a crisp one.
At the first step the initial directed matrix ( Z̃) is provided. Assume zij = (lij , mij, rij) is a triangular Fuzzy member in row i and the column j of Z̃ which means the level of impacts of criteria i on criteria j. Then, in the second step, the normalization process should be undertaken. In fact, the Z̃ matrix is normalized based on the following process and the X̃ matrix will be achieved. lij, mij, and rij are the worst case, the most likely case, and the best case respectively. Consequently, the normalization process is performed through the following equations:
( 1 )
xlij = (lij− minlij)/∆minmax,
( 2 )
xmij = (mij− minlij)/∆minmax
( 3 )
xrij = (rij− minlij)/∆minmax,
In Equations 1, 2, and 3 minlij is the lowest value of lij assigned through the experts and
max rij is the highest one. Table 5 illustrates the normalized matrix of TPC.
Table 5. The normalized matrix
Environmental factors Safety factors Workplace harmful factors
0.44 0.70 0.94 0.47 0.73 1.00 0.00 0.00 0.27 Workplace harmful
factors
0.18 0.42 0.69 0.00 0.00 0.27 0.32 0.57 0.82 Safety factors
0.00 0.00 0.27 0.25 0.51 0.77 0.40 0.65 0.88 Environmental factors
The Third step is to calculate the left normal values (ls) and the right ones (rs) through the following equations:
( 4 )
xlsij = xmij/(1 + xmij− xlij)
( 5 )
xrsij = xrij/(1 + xrij− xmij)
The results are presented in Table 6.
Table 6. The results of factors
Environmental factors Safety factors Workplace harmful factors
xlsij xrsij xlsij xrsij xlsij xrsij
0.56 0.76 0.58 0.79 0.00 0.21 Workplace harmful
factors
0.34 0.54 0.00 0.21 0.46 0.66 Safety factors
0.00 0.21 0.40 0.61 0.52 0.71 Environmental factors
At the fourth step, the final normalized deterministic values are calculated using Equation 6 as follows:
( 6 )
xij = [xlsij(1 − xlsij) + xrsijxrsij]/[1 − xlsij+ xrsij].
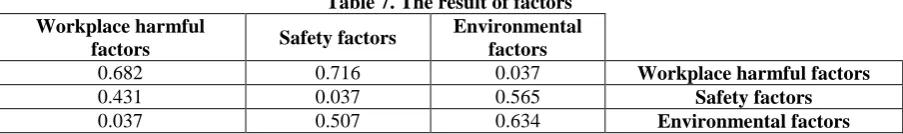
The results are presented in Table 7.
Table 7. The result of factors Environmental
factors Safety factors
Workplace harmful factors
Workplace harmful factors
0.037 0.716
0.682
Safety factors
0.565 0.037
0.431
Environmental factors
0.634 0.507
0.037
Finally, the defuzzified values are calculated utilizing Equation 7 and the results can be seen in Table 8.
( 7 )
Table 8. The final directed impacts matrix Environmental
factors Safety factors
Workplace harmful factors
Workplace harmful factors
0.034 0.666
0.634
Safety factors
0.526 0.034
0.401
Environmental factors
0.590 0.471
0.034
Problem the values of Table 8 are the results of Fuzzy DEMATEL analysis which lead us to impacts matrix. As it is expected, the workplace harmful factors and the safety factors have a strong impact to each other.
Utilizing Equations 8, 9, and 10, the impacts values are used to provide the estimations of relations between criteria in ANP network and super matrix. The normalized T-matrix which is presented in the following tables which are calculated through dividing each member to sum of its associated column. The values of Table 8 are the Z matrix in the calculations.
(8)
𝑋 = 𝑠. 𝑍
(9)
(10)
𝑠 = min {1 𝑚𝑎𝑥1≤𝑖≤𝑛 ∑ 𝑧𝑖𝑗 𝑛
𝑗=1
⁄ , 1 𝑚𝑎𝑥1≤𝑗≤𝑛 ∑ 𝑧𝑖𝑗 𝑛
𝑖=1
⁄ } , 𝑖, 𝑗 = 1,2, … , 𝑛
𝑇 = 𝑋(𝐼 − 𝑋)−1
The total of the values in rows and columns of T-matrix are called D and R vectors respectively which are calculated through Equations 11 to 13 as follows:
(11)
𝑇 = [𝑡𝑖𝑗]𝑛×𝑛, 𝑖, 𝑗 = 1,2, … , 𝑛
(12)
𝐷 = [∑ 𝑡𝑖𝑗]𝑛×1 = [𝑡𝑖.]𝑛×1 𝑛
𝑗=1
(13)
𝑅 = [∑ 𝑡𝑖𝑗]1×𝑛 = [𝑡.𝑗]𝑛×1 𝑛
𝑖=1
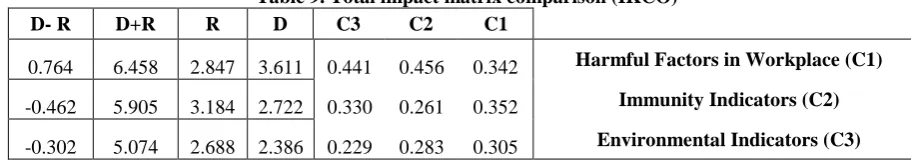
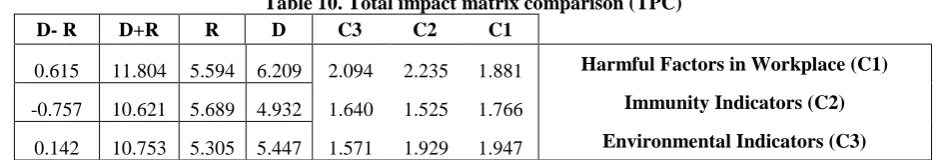
Then, the horizontal axis (importance axis) and vertical axis (relation axis) are calculated by the addition of the row and column (D + R) and the difference of row and column (D-R) respectively. The results for IKCO and TPC are shown in Table 9 and 10 respectively.
Table 9. Total impact matrix comparison (IKCO) C1
C2 C3
D R
D+R D- R
Harmful Factors in Workplace (C1)
0.342 0.456
0.441 3.611
2.847 6.458
0.764
Immunity Indicators (C2)
0.352 0.261
0.330 2.722
3.184 5.905
-0.462
Environmental Indicators (C3)
0.305 0.283
0.229 2.386
2.688 5.074
Table 10. Total impact matrix comparison (TPC) C1 C2 C3 D R D+R D- R
Harmful Factors in Workplace (C1)
1.881 2.235 2.094 6.209 5.594 11.804 0.615
Immunity Indicators (C2)
1.766 1.525 1.640 4.932 5.689 10.621 -0.757
Environmental Indicators (C3)
1.947 1.929 1.571 5.447 5.305 10.753 0.142
5.3. Finding the impacts matrix of sub criteria
Similar process of calculations in Section 5.2 are undertaken in order achieve the impacts among sub criteria. In fact, in order to provide the appropriate network for the ANP, all the relations between criteria and sub criteria should be analyzed. The results for IKCO are illustrated in Tables 11 to 13.
Table 11. Total impact matrix comparison for sub criteria of workplace harmful factors (IKCO) C11 C12 C13 C14 C15 D R D+R D- R C11 0.189 0.275 0.290 0.276 0.261 2.124 1.653 3.778 0.471 C12 0.222 0.152 0.215 0.222 0.261 1.735 1.466 3.201 0.269 C13 0.245 0.219 0.162 0.249 0.200 1.800 1.667 3.467 0.132 C14 0.222 0.199 0.211 0.133 0.174 1.499 2.543 4.042 -1.044 C15 0.122 0.155 0.121 0.120 0.104 1.024 0.852 1.876 0.171
Table 12. Total impact matrix comparison for sub criteria of safety factors (IKCO) C21 C22 C23 C24 C25 C26 C27 D R D+R D- R C21 0.101 0.159 0.154 0.150 0.131 0.144 0.149 1.749 1.763 3.513 -0.014 C22 0.158 0.103 0.142 0.151 0.157 0.149 0.151 1.786 1.760 3.546 0.026 C23 0.130 0.111 0.089 0.117 0.120 0.135 0.136 1.499 1.517 3.016 -0.018 C24 0.134 0.135 0.131 0.093 0.124 0.133 0.141 1.590 1.620 3.210 -0.030 C25 0.107 0.122 0.101 0.106 0.083 0.110 0.129 1.367 1.402 2.768 -0.035 C26 0.147 0.147 0.146 0.152 0.140 0.100 0.149 1.739 1.668 3.407 0.071 C27 0.224 0.224 0.237 0.231 0.245 0.228 0.145 2.627 2.627 5.254 0.000
Furthermore, the results for TPC are illustrated in Tables 14 to 16 as follows:
Table 14. Total impact matrix comparison for sub criteria of workplace harmful factors (TPC) C11 C12 C13 C14 C15 D R D+R D- R C11 0.189 0.235 0.236 0.235 0.227 4.203 3.944 8.147 0.259 C12 0.221 0.181 0.213 0.224 0.233 4.020 3.605 7.625 0.415 C13 0.196 0.185 0.156 0.192 0.182 3.435 3.630 7.065 -0.196 C14 0.227 0.227 0.230 0.180 0.218 4.019 4.607 8.626 -0.588 C15 0.167 0.172 0.165 0.169 0.140 3.068 2.958 6.026 0.110
Table 15. Total impact matrix comparison for sub criteria of safety factors (TPC)
C21 C22 C23 C24 C25 C26 C27 D R D+R D- R C21 0.098 0.149 0.139 0.143 0.127 0.135 0.144 1.891 2.022 3.913 -0.131 C22 0.146 0.100 0.138 0.140 0.143 0.145 0.146 1.935 1.987 3.923 -0.052 C23 0.133 0.129 0.094 0.127 0.124 0.137 0.139 1.793 1.885 3.677 -0.092 C24 0.134 0.131 0.134 0.095 0.130 0.135 0.140 1.823 1.862 3.684 -0.039 C25 0.118 0.121 0.116 0.121 0.090 0.121 0.133 1.679 1.592 3.270 0.087 C26 0.157 0.155 0.160 0.154 0.154 0.109 0.154 2.110 1.882 3.992 0.227 C27 0.214 0.215 0.219 0.220 0.233 0.219 0.145 2.877 2.877 5.754 0.000
Table 16. Total impact matrix comparison for sub criteria of Environmental factors (TPC)
C31 C32 C33 C34 C35 C36 C37 C38 C39 D R D+R D- R C31 0.112 0.119 0.120 0.120 0.120 0.121 0.123 0.124 0.125 12.09 12.10 24.20 -0.01 C32 0.111 0.105 0.116 0.116 0.115 0.114 0.112 0.111 0.113 11.34 11.83 23.17 -0.49 C33 0.117 0.120 0.110 0.121 0.120 0.118 0.118 0.117 0.118 11.84 11.28 23.12 0.56 C34 0.113 0.118 0.117 0.106 0.117 0.114 0.114 0.113 0.113 11.45 11.86 23.31 -0.41 C35 0.114 0.116 0.116 0.116 0.107 0.115 0.116 0.113 0.113 11.48 10.94 22.42 0.54 C36 0.121 0.121 0.122 0.121 0.120 0.112 0.122 0.122 0.122 12.12 11.58 23.70 0.54 C37 0.119 0.115 0.116 0.115 0.117 0.117 0.108 0.119 0.114 11.65 11.45 23.10 0.21 C38 0.117 0.111 0.112 0.112 0.112 0.114 0.115 0.105 0.114 11.29 11.64 22.93 -0.34 C39 0.076 0.073 0.073 0.073 0.072 0.075 0.073 0.076 0.069 7.39 8.01 15.40 -0.61
The results of Table 11 to 16 can appropriately present the cause and effects relations between sub criteria of the main factors with each other. It should be mentioned that the calculations of DEMATEL are undertaken using MATLAB software and ANP is obtained through "super decision" software.
6. Results and discussions: fuzzy ANP
The results of DEMATEL in finding total impacts comparisons for criteria
The results of DEMATEL in finding total impacts comparisons for sub criteria
The weights of each criteria and sub criteria achieved by pairwise comparison questionnaires and analyses in ANP.
The first two abovementioned steps are the outputs of the Fuzzy DEMATEL and the third step should be provided through ANP analysis.
6.1. Calculating the weights of criteria and sub criteria
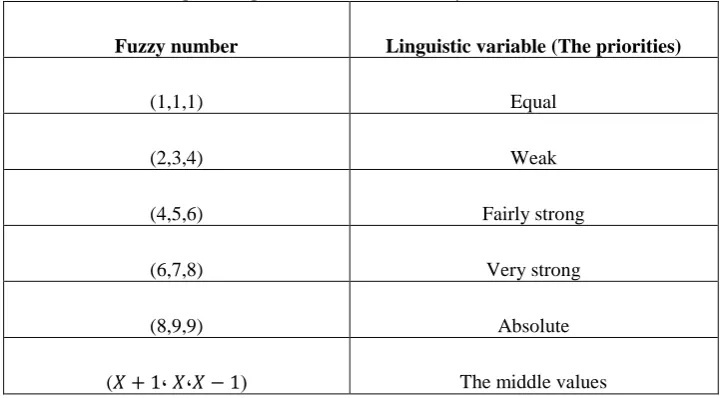
In order to find the related weights for each of the criteria and sub criteria, the experts are asked to compare the criteria and sub criteria using qualitative variables. Then the variables are converted to Fuzzy numbers utilizing Table 17 from 25 Wei and Yu 2007.
Table 17. Converting the linguistic variables to Fuzzy numbers (Wei and Yu 2007)
Linguistic variable (The priorities) Fuzzy number
Equal (1,1,1)
Weak (2,3,4)
Fairly strong (4,5,6)
Very strong (6,7,8)
Absolute (8,9,9)
The middle values (𝑋 + 1،𝑋،𝑋 − 1(
Integrating the opinions of the experts is undertaken though geometrical mean of fuzzy numbers (see Equation 14).
(14)
Z̃ij = ( √𝑙𝑘 1× 𝑙2× … × 𝑙𝑘
, √𝑚𝑘 1× 𝑚2× … × 𝑚𝑘, √𝑟𝑘 1× 𝑟2× … × 𝑟𝑘)
The final results for IKCO and TPC are presented in Tables 18 and 19 respectively.
Table 18. The integrated Fuzzy pairwise comparisons of 30 experts for criteria (IKCO)
C1 C2 C3
C1 1 1 1 0.348 0.413 0.505 2.944 3.598 4.270
C2 1.979 2.419 2.870 1 1 1 3.695 4.440 5.008
C3 0.234 0.278 0.340 0.200 0.225 0.271 1 1 1
Table 19. The integrated Fuzzy pairwise comparisons of 30 experts for criteria (TPC)
C1 C2 C3
C1 1 1 1 0.525 0.572 0.634 1.428 1.733 2.032
C2 1.578 1.748 1.906 1 1 1 3.109 3.722 4.282
C3 0.492 0.577 0.700 0.234 0.269 0.322 1 1 1
comparison are reported at the end of the tables. The local weights are also calculated using Equation 14 in the last columns of Tables 20 and 21.
Table 20. The defuzzified comparison matrix and the local weights for criteria (IKCO) C1 C2 C3 Local weight
C1 1.000 0.416 3.575 0.306
C2 2.424 1.000 4.368 0.588
C3 0.279 0.226 1.000 0.107
CR=0.033≤0.1
Table 21. The defuzzified comparison matrix and the local weights for criteria (TPC) C1 C2 C3 Local weight
C1 1.000 0.574 1.736 0.294
C2 1.747 1.000 3.673 0.547
C3 0.583 0.269 1.000 0.159
CR=0.014≤0.1
The consistency ratios of the pairwise analysis in Table 20 and 21 are in acceptable range of being below 0.1. The results in IKCO and TPC are almost similar in terms of the final weights. Safety factors get the highest local weights for IKCO and TPC and environmental factors get the lowest.
6.2. Calculating the weights of sub criteria
The same analyses are performed in order to find the local weights of sub criteria for IKCO and TPC. The IKCO results are shown in Tables 21 to 23.
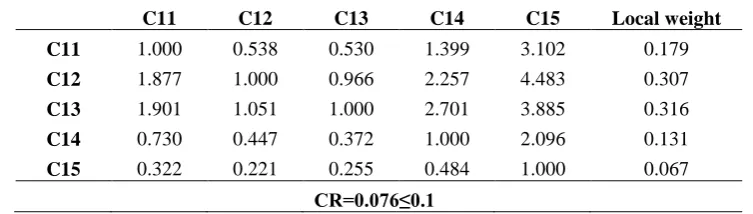
Table 22. The defuzzified comparison matrix and the local weights for sub criteria (IKCO) C11 C12 C13 C14 C15 Local weight
C11 1.000 0.538 0.530 1.399 3.102 0.179
C12 1.877 1.000 0.966 2.257 4.483 0.307
C13 1.901 1.051 1.000 2.701 3.885 0.316
C14 0.730 0.447 0.372 1.000 2.096 0.131
C15 0.322 0.221 0.255 0.484 1.000 0.067
CR=0.076≤0.1
Table 23. The defuzzified comparison matrix and the local weights for sub criteria (IKCO) C21 C22 C23 C24 C25 C26 C27 Local weight
C21 1.000 0.974 2.875 0.739 3.887 1.793 0.660 0.173
C22 1.038 1.000 3.539 0.942 3.969 2.348 0.715 0.196
C23 0.349 0.281 1.000 0.300 1.657 0.925 0.434 0.072
C24 1.355 1.078 3.317 1.000 2.800 2.459 0.816 0.201
C25 0.254 0.249 0.615 0.360 1.000 0.509 0.333 0.053
C26 0.568 0.429 1.098 0.412 1.984 1.000 0.422 0.089
C27 1.530 1.410 2.304 1.254 2.996 2.377 1.000 0.216
Table 24. The defuzzified comparison matrix and the local weights for sub criteria (IKCO) C31 C32 C33 C34 C35 C36 C37 C38 C39 Local weight C31 1.000 0.904 1.212 0.623 0.590 0.547 0.427 0.335 0.835 0.071
C32 1.120 1.000 1.667 0.270 1.021 0.925 0.659 0.616 2.088 0.096
C33 0.840 0.606 1.000 0.281 0.605 0.806 0.456 0.401 0.977 0.065
C34 1.638 3.661 3.534 1.000 1.393 1.417 0.666 1.035 0.892 0.153
C35 1.717 0.991 1.679 0.724 1.000 0.632 0.668 0.618 0.439 0.091
C36 1.867 1.113 1.246 0.724 1.595 1.000 0.918 1.681 1.004 0.126
C37 2.355 1.531 2.204 1.516 1.507 1.099 1.000 0.467 0.525 0.127
C38 2.970 1.647 2.501 0.989 1.643 0.598 1.901 1.000 0.561 0.141
C39 1.224 0.487 1.044 1.146 2.292 1.013 1.921 1.799 1.000 0.129
CR=0.081≤0.1
Besides, the results of integrated defuzzified pairwise comparisons of 30 experts for TPC are illustrated in Table 24 to 26.
Table 25. The defuzzified comparison matrix and the local weights for sub criteria (TPC) C11 C12 C13 C14 C15 Local weight
C11 1.000 0.222 1.333 0.326 0.771 0.097
C12 4.445 1.000 4.648 1.392 2.761 0.393
C13 0.763 0.212 1.000 0.272 1.104 0.089
C14 3.069 0.725 3.665 1.000 2.824 0.307
C15 1.317 0.363 0.916 0.354 1.000 0.113
CR=0.095≤0.1
Table 26. The defuzzified comparison matrix and the local weights for sub criteria (TPC) C21 C22 C23 C24 C25 C26 C27 Local weight
C21 1.000 0.582 1.279 1.449 5.402 1.904 0.612 0.169
C22 1.724 1.000 2.427 1.939 4.517 2.169 0.719 0.229
C23 0.794 0.416 1.000 1.012 2.377 1.580 0.770 0.128
C24 0.695 0.520 1.004 1.000 3.128 1.067 0.754 0.127
C25 0.182 0.219 0.422 0.320 1.000 0.354 0.378 0.046
C26 0.531 0.465 0.637 0.948 2.846 1.000 0.566 0.105
C27 1.649 1.411 1.314 1.335 2.647 1.786 1.000 0.196
CR=0.037≤0.1
Table 27. The defuzzified comparison matrix and the local weights for sub criteria (TPC) C31 C32 C33 C34 C35 C36 C37 C38 C39 Local weight
C31 1.000 2.453 2.165 1.145 2.216 0.688 0.709 0.555 1.319 0.121 C32 0.408 1.000 0.834 0.379 0.801 0.485 0.386 0.255 0.901 0.056 C33 0.464 1.217 1.000 0.782 1.104 0.712 0.488 0.301 0.868 0.072 C34 0.880 2.640 1.291 1.000 1.042 0.735 0.764 0.529 1.282 0.104 C35 0.455 1.259 0.920 0.967 1.000 0.690 0.645 0.463 1.225 0.081 C36 1.473 2.087 1.427 1.381 1.464 1.000 1.189 1.037 1.866 0.142 C37 1.429 2.593 2.065 1.336 1.571 0.851 1.000 0.274 2.495 0.131 C38 1.807 3.870 3.309 1.908 2.186 0.971 3.691 1.000 2.950 0.220 C39 0.773 1.139 1.179 0.791 0.828 0.546 0.402 0.340 1.000 0.073
The final point which should be mentioned is the acceptable CR for all of the calculations in the abovementioned tables which can guarantee the validity of the experts' opinions. The final step in order to achieve the ultimate weights is providing the super matrix.
6.3. Calculating the weights of sub criteria
The T-normal matrix, the impacts between all criteria and sub criteria, and the local weights are used in order to provide the super matrix. The matrixes for IKCO and TPC are illustrated in Tables 27 and 28 respectively. Matlab software is used to find the appropriate power of 2k+1 of the super matrixes. Here, the final weights are achieved in the power of 33. The results of the final weights are illustrated in Table 29 and 30 for IKCO and TPC respectively.
Table 28. The final weights of the criteria and sub criteria (IKCO)
Major criteria Weights of major
criteria (priority) Sub-criteria
Weights of Sub-criteria
Harmful Factors in Workplace
(C1) 0.1196 (2)
Physical environment of workplace such as
noise, light, etc. 0.0262
Chemical factors such as steam, smoke, heat,
cold, vibration 0.0307
Ergonomic factors 0.0316
Psychological factors such as job stress,
quarrel, strike of employees and so on 0.0194 Biological factors such as bacteria, parasite,
fungus, etc. 0.0116
Immunity Indicators
(C2) 0.1492 (1)
Electricity immunity 0.0235
Fire immunity 0.0253
Individual protection immunity (use of shoes,
hat, gloves, mask, uniforms, etc. 0.0145 Immunity of equipment and tools 0.0246
Furnishing 0.0122
Teaching immunity to employees such as first
aids 0.0173
Risk management program in organization 0.0319
Environmental Indicators
(C3)
0.0644(3)
Table 29. The final weights of the criteria and sub criteria (TPC)
Major criteria Weights of major
criteria (priority) Sub-criteria
Weights of Sub-criteria
Harmful Factors in Workplace
(C1) 0.111 (2)
Physical environment of workplace such as
noise, light, etc. 0.018
Chemical factors such as steam, smoke, heat,
cold, vibration 0.034
Ergonomic factors 0.015
Psychological factors such as job stress,
quarrel, strike of employees and so on 0.029 Biological factors such as bacteria, parasite,
fungus, etc. 0.015
Immunity Indicators
(C2) 0.140 (1)
Electricity immunity 0.021
Fire immunity 0.026
Individual protection immunity (use of shoes,
hat, gloves, mask, uniforms, etc. 0.018 Immunity of equipment and tools 0.018
Furnishing 0.012
Teaching immunity to employees such as first
aids 0.018
Risk management program in organization 0.028
Environmental Indicators
(C3)
0.082 (3)
Environmental evaluation 0.010 Energy consumption per capita 0.007 Energy auditing studies 0.008 Prevention of energy wasting 0.009 Water consumption per capita 0.008 Process factors Management in organization 0.011 Waste and sewage management 0.010 Environmental polluting management 0.014 Noise pollution management 0.006
Figure 2. The final weights for three main factors
The analysis of the final results is completely interesting. In despite of the fact that the pairwise comparisons are absolutely independent in terms of companies and experts, the both ultimate weights and rankings are clearly similar. The safety factors are in the top priority list of evaluating HSE system for IKCO and TPC with the weights of 0.149 and 0.140 respectively. At the second place, we can see workplace harmful factors for IKCO and TPC with the weights of 0.120 and 0.111 respectively. Environmental factors get the lowest priorities but it is the only factor that TPC presents the higher value (0.082) in comparison with IKCO (0.064) which means that in petrochemical companies environmental factors are more considerable compared to automotive counterparts.
7. Conclusion and future research
This paper develops a new Fuzzy-DEMATEL-ANP method in order to find the main criteria and sub criteria of evaluating HSE systems and analyzing the relations between them. Besides, through the pairwise comparisons, the criteria and sub criteria are prioritized for two of the largest companies in Iran, one in automotive and the other in petrochemical industry. Fuzzy approach is exploited in order to have near-to-reality experts' information.
The final results are somehow appealing when we find the ranking of the main factors exactly the same. Safety factors are the most significant criteria for both companies. Workplace harmful factors and environmental factors are the second and the third in the achieved ranking. For IKCO, safety factors, workplace harmful factors and environmental factors get the weights of 0.149, 0.120, and 0.064 respectively. Furthermore, for IKCO, safety factors, workplace harmful factors and environmental factors get the weights of 0.140, 0.111, and 0.082 respectively.
The presented model can be extended in other automotive and petrochemical companies in order to evaluate HSE systems. However, the similar results in two companies can lead us to the conclusion that we would expect similar ranking in other industries in Iran based on the similarities in administration approaches.
There are some similar researches based on this study. The evaluations of HSE systems can be undertaken in IKCO and TPC in order to find the practical results of the model. However,
0.120
0.149
0.064 0.111
0.140
0.082
0.000 0.030 0.060 0.090 0.120 0.150 0.180
IKCO TPC
envelopment analysis can be added as an evaluator at the evaluation stage of the model. Finally, a decision support system can be developed based on the achievements of this study.
References
Amiri, M., Zandieh, M., Soltani, R., Vahdani, B. (2009). “A hybrid multi-criteria decision-making model for firms competence evaluation”, Expert Systems with Applications, Vol. 36, pp 12314–12322.
Arabzadeh, S., (2012). Risk Determination and Evaluation by Job Immunity Analysis Technique in Leather Industry, Second National Hygiene Conference, Immunity and Environment, Tehran, Iran.
Arezes, P. M., & Sérgio Miguel, A. (2003). “The role of safety culture in safety performance measurement”, Measuring Business Excellence, Vol. 7, No. 4, pp 20-28.
Asgharpour, M., J., (2000). Multi-Criteria Decision Making, third publish, Tehran: Tehran University Publication.
Bacchetta, A. P. (2009). “B-BS and occupational health and safety management systems”, Giornale italiano di medicina del lavoro ed ergonomia, Vol. 32, pp 55-8.
Bao Q., Ruan D., Shen Y., Hermans E., Janssens D. (2012). “Improved hierarchical fuzzy TOPSIS for road safety performance evaluation”, Knowledge-Based Systems, Vol. 32, No. 1, pp 84-90.
Barkhordari, A., Shirazi, J., Halwani, G, (2011). “Risk Determination and Risk Evaluation of Tunnel Making by Job Immunity Analysis Technique”, Tole Behdasht Yazd, Vol. 11, No. 3, pp 103-112.
Bigelow, P. L., Robson, L. S. (2005). “Occupational Health and Safety Management audit instruments: A literature review”, Institute for Work & Health.
Beriha, G. S., Patnaik, B., Mahapatra, S. S. (2011). “Safety performance evaluation of Indian organizations using data envelopment analysis”, Benchmarking: An International Journal, Vol. 18, No. 2, pp 197-220.
Chang, Y. H., Shao, P. C., & Chen, H. J. (2015). “Performance evaluation of airport safety management systems in Taiwan”, Safety Science, Vol. 75, pp 72-86.
Chang, B., Chang, C. W., & Wu, C. H. (2011). “Fuzzy DEMATEL method for developing supplier selection criteria”, Expert systems with Applications, Vol. 38, No. 3, pp 1850-1858.
Chen, C. C., Tseng, M. L., Lin, Y. H. (2008). “Using fuzzy DEMATEL to develop a causal and effect model of hot spring service quality expectation”, In Industrial Engineering and Engineering Management, IEEE International Conference on, pp. 1004-1008.
Chen-Yi, H., Ke-Ting, C., Gwo-Hshiung, T. (2007). “FMCDM with Fuzzy DEMATEL Approach for Customers' Choice Behavior Model”, International Journal of Fuzzy Systems, Vol. 9, No. 4.
Wu, C. R., Lin, C. T., Lin, Y. F. (2009). “Selecting the preferable bancassurance alliance strategic by using expert group decision technique”, Expert Systems with Applications, Vol. 36, No. 2, pp 3623-3629.
Norozi, M., Jahangiri, M., Choobineh, A., Narimanejad, A. (2015). “Feasibility Study of Implementing Process Safety Management (PSM) Requirements in an Iranian Petrochemical Company”, International Journal of Occupational Hygiene, Vol. 5, No. 2, pp 71-75.
Lin, C. L., Hsieh, M. S., Tzeng, G. H. (2010). “Evaluating vehicle telematics system by using a novel MCDM techniques with dependence and feedback”, Expert Systems with Applications, Vol. 37, No. 10, pp 6723-6736.
Luo, Z. M., Zhou, J. Z., Zheng, L. P., Mo, L., & He, Y. Y. (2010). “A TFN–ANP based approach to evaluate Virtual Research Center comprehensive performance”, Expert Systems with Applications, Vol. 37, No. 12, pp 8379-8386.
Manuele, F. A. (2008). Advanced safety management focusing on Z10 and serious injury prevention, John Wiley & Sons.
Mohammadi, M. G., Iranban, S. J. (2015). “The role of setting the integrated management system on efficiency of hospitals using BSC and DEA/AHP”, Asian Journal of Research in Business Economics and Management, Vol. 5, No. 2, pp 281-297.
Murè, S., Demichela, M. (2009). “Fuzzy Application Procedure (FAP) for the risk assessment of occupational accidents”, Journal of loss prevention in the process industries, Vol. 22, No. 5, pp 593-599.
Nahri, S., Kardan, M, (2008). Working Immunity and Protection during Execution, First publish, Iran: Azar Publication.
Ng, Z. X., Teo, L. T., Go, K. T., Yeo, Y. T., Chiu, M. T. (2010). “Major workplace related accidents in Singapore: A major trauma centre's experience”, Annals Academy of Medicine Singapore, Vol. 39, No. 12.
Opricovic, S., Tzeng, G. H. (2003). “Defuzzification within a multicriteria decision model”, International Journal of Uncertainty, Fuzziness and Knowledge-Based Systems, Vol. 11, No. 5, pp 635-652.
Redinger, C. F. (1999). Occupational health and safety management system performance measurement: a universal assessment instrument, AIHA.
Robson, L. S., Bigelow, P. L. (2010). “Measurement properties of occupational health and safety management audits: a systematic literature search and traditional literature synthesis”, Canadian Journal of Public Health/Revue Canadienne de Sante'e Publique, pp 34-40.
Saaty, T. L. (1996). Decision making with dependence and feedback: The analytic network process, Pittsburgh: RWS publications. Chicago
Saaty, T. L. (2005). Theory and applications of the analytic network process: decision making with benefits, opportunities, costs, and risks. RWS publications.
Shhiroyeh Zadeh, H., (2011). “Evaluation of the Performance of the Refinery Immunity Processes, Gas Methods by DEA/ AHP”, Third Conference of Evaluation of Data Covering, Islamic Azad University, Firoozkooh Branch.
Tüysüz, F., Kahraman, C. (2006). “Project risk evaluation using a fuzzy analytic hierarchy process: an application to information technology projects”, International Journal of Intelligent Systems, Vol. 21, No. 6, pp 559-584.
Wu, W. W., Lee, Y. T. (2007). “Developing global managers’ competencies using the fuzzy DEMATEL method”, Expert systems with applications, Vol. 32, No. 2, pp 499-507.