© Strojniški vestnik 470200138,519-526 © Journal of Mechanical Engineering 47C2C301 DB,5 1 0-526
ISSN 0 0 3 9 -2 4 8 0 ISSN 0 0 3 9 -2 4 6 0
DDK 5 3 6 .2 UDC 5 3 6 .2
Izvirni znanstveni članek (1 .O l 3 Original scientific paper C1.013
A PERFORMANCE COMPARISON BETWEEN AN AIR-SOURCE
AND A GROUND-SOURCE REVERSIBLE HEAT PUMP
C.A. de S w a rd t1 1 an d J.P . M ey er2
D epartm ent o f M echanical and M anufacturing Engineering, Laboratory for Energy Rand Afrikaans University
P.O. Box 524 Auckland Park, 2006
South Africa
ABSTRACT
In this study the performance of a reversible ground-source heat pump, coupled to a municipality water reticulation system, is compared experimentally and with simulations to a conventional air-source heat pump for space cooling and heating. A typical municipality water reticulation system comprises hundreds of kilometres o f pipes designed in loops that will ensure adequate circulation of the water. This result's in a substantial heat exchanger with great potential. Indirect heat transfer occurs between the refrigerant and ground via the municipality water reticulation system that acts as the water-to- ground heat exchanger. The experimental and simulated comparisons of the ground-source system to the air-source system are conducted in both the cooling and heating cycles. Climatalogical statistics are used to calculate the capacities and coefficients of performance of the ground-source and air-source heat pumps. Results obtained from measurements and simulations indicate that the utilisation of municipality water reticulation systems as a heat source/sink is a viable method of optimising energy usage in the air-conditioning industry, especially when used in the heating mode.
1. INTRODUCTION
Ground-source heat pump systems are being specified in more and more commercial and residential buildings. These units consist of a reversible vapour-compression cycle linked to a closed loop heat exchanger buried in the soil. The most conventional ground-source heat pump is the water-to-air heat pump which circulates water through a liquid-to-refrigerant heat exchanger in the ground, with an air-cooled condenser (heat pump) or air-heated evaporator (air-conditioner) in the space to be conditioned. The liquid-to-refrigerant heat exchanger
consists of a buried thermoplastic piping network which is the ground-source heat exchanger.
Closed-loop ground-source heat pumps have demonstrated the potential to increase capacity and reduce total power consumption by providing a reduced condensation temperature in the summer and a higher evaporation temperature in the winter. Air temperatures which have large daily and monthly cyclic changes are damped or moderated by the earth mass. According to Bose (1985), at low ambient air temperatures, the closed-loop ground-coupled heat pump will have significant capacity and efficiency improvements over air-source heat pumps.
The capital costs of a ground-source heat pump can be reduced by connecting the water-to-reffigerant heat exchanger directly to a municipality water supply, making the ground water coil obsolete. The water circulates through the water-to- refrigerant heat exchanger back to the municipality water reticulation system. The municipality water reticulation system is then used as the water-to-ground heat exchanger. The implication is that when the heat pump is in a cooling cycle, excess heat is rejected to the municipality water system and in a heating cycle, heat is extracted from the municipality water system (Cane and Clemes, 1995). Using municipality water as a ground-source is rated as an excellent source by ASHRAE (1996), the only limitation in many cases being regulations that enforce double wall heat exchangers to prevent possible refrigerant contamination to water and ground sources.
2. OBJECTIVES OF RESEARCH
No performance data is available on ground-source reversible heat pumps using municipality water as heat source/sink. Therefore, the purpose of this study is to compare the
1 Master's degree student, Mechanical and Manufacturing Engineering Department.
2 Correspondence to: J.P. Meyer, Professor and Head of Research Group For Cooling and Heating Technology.
performance o f such a ground-source heat pump with the performance of an air-source heat pump. This comparison is achieved using simulation models that are experimentally validated. The comparison is conducted in both cooling and heating cycles. From this comparison performance data on ground-source heat pumps is compiled. Furthermore the feasibility of using a municipality water reticulation system as a heat source/sink is determined.
3. S IM U LA T IO N M O D E L
The performance data on ground-source heat pumps was generated using FIPSIM (1994). HPSIM is a computer simulation model that predicts the behaviour of vapour- compression heat pumps given the following inputs: Performance characteristics of the compressor, fan(s) and water pump; the geometry of the evaporator and condenser; the length, diameter and loss coefficient of the connecting tubes; and mass flow rates and inlet conditions of the fluid streams (air or water) that flow through the heat exchangers. The simulation program uses these inputs to calculate the characteristics of the heat pump at the points on the thermodynamic cycle, as indicated in Fig. 1. The output o f the simulation program is properties of the refrigerant, air and water where applicable.
Fig. 1: Cycle layout and thermodynamic cycle diagram
The above-mentioned information that the program needs to predict the behaviour o f the heat pump is divided into the following sections: Compressor performance characteristics, main input data file and fan(s)/pump data. The performance characteristics of the compressor consist of mechanical power and refrigerant mass flow rate as a function of evaporation temperature and condensation temperature. These characteristics are provided to HPSIM in a separate lookup file in matrix format. The geometry o f the heat pump is used in the main input data file. The fan(s)/pump data comprises the air and water volume flow rates and the power absorbed by the fan(s)/pump.
4. E X P E R IM E N TA L SET-UP AND DATA REDUCTION
The air-source set-up is categorised as a floor-mounted split unit with one air-source heat exchanger inside the building to be conditioned and the other air-source heat exchanger, together with the compressor and capillary tubes, located outside the building. The set-up consists of a factory made reversible heat pump, using R22 in a vapour compression cycle. The compressor is a hermetically sealed, reciprocating type with a nominal heating capacity of 13.7 kW at ARI conditions (7.2°C evaporation temperature and 54.4°C condensation temperature). The experimental set-up has been operational for five years in Pretoria, South Africa, at an altitude of 1400 m above sea level. The external dimensions of the inside heat exchanger are a width of 0.90 m, a height of 0.28 m and a thickness of 0.09 m. The external dimensions of the outside heat exchanger are a width of 0.96 m, a height of 0.61 m and a thickness of 0.07 m.
Both air-source heat exchangers have 4 circuits of staggered fins and tubes, used in a cross-flow configuration. The air velocities were measured with a hot wire anemometer having a maximum error of 3%. A matrix of air velocity measurements was recorded for both air-source heat exchangers using the log- Tchebycheff rule (ASHRAE, 1997) to determine the individual measuring points o f the sample with a straight line average. The air flow rate for both air-source heat exchangers was determined by multiplying the average air velocity with the area of the air stream. The dry-bulb and wet-bulb temperatures of the air stream before and after the air-source heat exchangers were recorded. The air enthalpy values for an air-source heat exchanger was calculated from the air inlet and outlet conditions o f the heat exchanger by using psychometric chart software (PS Data, 1989).
The water-source set-up is the same as for the air-source set up, except that the outside air-source heat exchanger was substituted with a fluted tube water-source heat exchanger. The fluted tube heat exchanger represents a compact tube-in-tube heat exchanger with a twisted insert. It has a nominal cooling capacity of 10.6 kW at ARI conditions. The external dimensions of the fluted tube heat exchanger are a width of 0.39 m, a thickness of 0.37 m and a height of 0.15 m. It has a length of approximately 5.5 m. A fluted tube heat exchanger was used since it enhances heat transfer (MacBain et al., 1997). The heat transfer enhancement occurred mainly in the annulus through which the refrigerant was circulated. A sight-glass was installed after the heat exchanger (when used as condenser) to monitor the sub-cooling while recharging the system.
The water from the municipality reticulation system circulated through the inner tube of the heat exchanger in a counterflow configuration. A water loop connected the fluted tube heat exchanger to the municipality water reticulation system with a 25 mm flexible plastic pipe 40 m long. The flow rate of the water through the water loop was measured using a turbine flowmeter with an error of 0.25% to 2.0%. The water flow rate was controlled by a hand-controlled valve. The water flow rate was determined by recording the turbine flowmeter reading at the beginning and end of a certain time period. The water inlet and outlet temperatures of the water-source heat exchanger were also recorded. This enabled the calculation of heat transfer from the air or water to the refrigerant and vice versa at the heat exchangers.
--- I C . A . d e S w a r d t - J . P . M e y e r : A p e r f o r m a n c e c o m p a r i s o n b e t w e e n a n a i r - s o u r c e |
Thirteen thermocouples were secured onto the refrigerant loop indicated in Fig. 1 and two thermocouples were secured onto the water loop of the experimental set-up. More thermocouples were installed on the condenser and evaporator to determine the average condensing and evaporating temperatures. The experimental systems were left to operate for approximately 20 minutes until a steady state was reached for selected ambient temperatures. The appropriate measurements were then taken on the experimental set-up. The wet-bulb air temperatures were measured using a sling thermometer with an error of 0.2°C. The power absorbed by the compressor and fans were measured with a power harmonics analyser with an error of +1 W. The refrigerant enthalpy values for a heat exchanger were determined from the refrigerant inlet and outlet temperatures of the heat exchanger using a refrigerant database (NIST, 1993). The temperature readings (isotherm) of the two-phase regions were used to determine the evaporation and condensation temperatures. Care was taken to ensure an energy balance of less than ± 10% between the air or water and the refrigerant used. Experiments were conducted on the experimental set-up for cooling and heating cycles respectively.
5. COMPARISON OF SIMULATIONS AND
EXPERIMENTAL WORK
The experimental results obtained were used to calculate capacities and COPs (coefficients of performance) of the heat pump operating in the respective cooling or heating cycle. The refrigerant mass flow rate as simulated was used in calculating the experimental results. The mass flow rate was not measured in the experimental set-up due to inaccessibility to a refrigerant mass flowmeter. The interior and exterior ambient conditions as obtained through the experiments were used as input data for the simulation models. The experimental results are compared with the simulated results in Tables 1 and 2. Table 1 is for the air-source system and Table 2 is for the ground-source system.
Table 1: Most important simulated and measured properties of the air system
C O O L I N G C Y C L E
P ro p e rty S im u l a te d E x p e r im e n ta l D iffe re n c e
E v a p o r a tio n te m p - 0 4 6 3 .2 2 3 .6 ° C
C o n d e n s a tio n te m p 3 8 .3 4 3 9 6 9 1 .3 °C
P o w e r u s e d 2 .5 7 4 2 .3 1 2 1 0 .2 %
C o o li n g c a p a c ity 7 .1 1 1 7 .4 3 0 4 .5 %
C O P 2 .7 4 3 2 5 0 4 8 .7 %
H E A T I N G C Y C L E
E v a p o r a tio n te m p . 1 .7 6 6 .0 3 4 .2 ° C
C o n d e n s a tio n te m p 4 9 .9 4 5 2 .6 1 2 6 ° C
P o w e r u s e d 2 .8 2 0 2 .7 5 1 2 .4 %
H e a tin g c a p a c ity 1 0 .2 7 9 9 6 5 0 6 .1 %
C O P 3 .3 1 5 2 9 9 8 9 .5 %
It can be concluded from Table 1 that a good correlation exists in the cooling cycle between simulated and experimental results, except for the evaporation temperatures which were not well predicted with differences between 3.6°C (cooling cycle) and 4.2°C (heating cycle). The difference in the compressor power consumption of the cooling cycle which is 10.2% is
relatively large, however, in the heating cycle it is a good 2.4%. This is due to the larger difference between the evaporation and condensation temperatures of the simulated results compared to the experimental results, which use more compressor input power. The two most important parameters, however, are the capacities and COPs with differences both less than 9% for the cooling cycle. For the heating cycle the same type of discrepancies exist as for the cooling cycle, however, the differences in the heating capacity and COPs are both less than 10% .
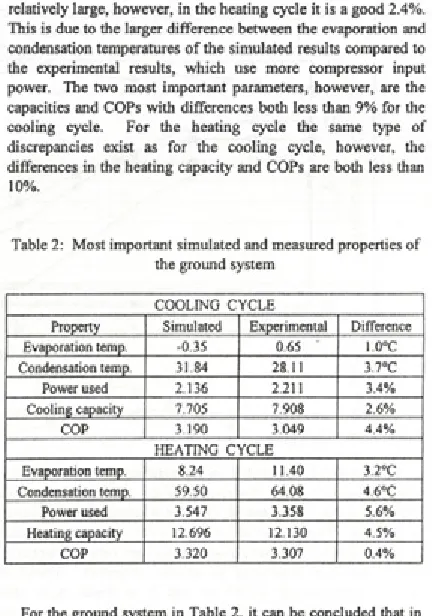
Table 2: Most important simulated and measured properties of the ground system
C O O L I N G C Y C L E
P r o p e r ty S im u l a te d E x p e r im e n ta l D iffe re n c e
E v a p o r a tio n te m p . - 0 .3 5 0 .6 5 1 .0 °C
C o n d e n s a tio n te m p . 3 1 ,8 4 2 8 .1 1 3 .7 - C
P o w e r u s e d 2 .1 3 6 2 211 3 .4 %
C o o lin g c a p a c ity 7 .7 0 5 7 .9 0 8 2 .6 %
C O P 3 .1 9 0 3 .0 4 9 4 .4 %
H E A T I N G C Y C L E
E v a p o r a tio n te m p . 8 .2 4 1 1 .4 0 3 .2 ° C
C o n d e n s a tio n te m p . 5 9 .5 0 6 4 0 8 4 .6 ° C
P o w e r u s e d 3 .5 4 7 3 .3 5 8 5 .6 %
H e a tin g c a p a c ity 1 2 .6 9 6 1 2 .1 3 0 4 .5 %
C O P 3 .3 2 0 3 .3 0 7 0 .4 %
For the ground system in Table 2, it can be concluded that in general a good correlation exists between simulated and experimental values with all errors between 0.4% and 5.6%. It is only the condensation temperatures with a difference of 3.7°C for the cooling cycle and a difference of 4.6°C for the heating cycle which were not well predicted. From Tables 1 and 2 it follows that the air simulation model and the ground simulation model have been experimentally validated and can be utilised with confidence to predict heat pump trends.
6. ANNUAL PERFORMANCE
Annual air and ground temperatures were needed as boundary conditions for determining the year round performance of an air-source and ground-source heat pump. These temperatures, given in Fig. 2, were obtained from a climatological database (Weather Bureau, 1968 and 1986) for Pretoria, South Africa. The "Air" temperature line represents the average air temperatures between the average monthly minimum and maximum temperatures. The air-source heat pump was also simulated with the average monthly minimum and maximum air temperatures to determine the heat pump characteristics under extreme conditions (De Swardt, 2000). In the summer months (October to March) cooling is required and in the winter months (April to September) heating is required and the "Air" temperatures in Fig. 2 are used as external ambient conditions to simulate the air-source heat pump. The heat pump was simulated whilst keeping the interior air conditions at a constant 22°C dry bulb and 60 relative humidity for both the cooling and heating cycles. From these air-source simulations it was found that the capacities and COPs were mainly influenced by the wet-bulb air temperature.
Fig. 2: Monthly ambient air and ground properties
The 0.9 m, 1.5 m and 3 m temperature lines indicate the ground temperatures at the respective depths. It follows from Fig. 2 that the cyclic nature of ground temperatures decrease with depth. The average ground cover over municipality water pipes is usually 1.5 m but ground covers vary between depths of 0.9 m and 3 m depending on ground properties. Therefore ground temperatures at 0.9 m and 3 m depth were also investigated. This investigation was used to determine the trend in heat pump behaviour for different depths. It is assumed that the water inlet temperatures to the ground system will approximate the ground temperatures at the respective depths due to the large lengths (and therefore surface area) of water reticulation pipes that form part o f the ground heat exchanger.
Different water flow rates between 0.2 (Is and 1 (Is were also investigated at the respective ground depths o f 0.9 m, 1.5 m and 3 m (De Swardt, 2000). It was found that a water flow rate of
0.5 (Is achieved the best average COPs for the cooling and heating cycles at all three depths. Flow rates less than this flow rate resulted in a lowering of COPs, cooling and heating capacities. Water flow rates higher than 0.5 (Is resulted in higher cooling and heating capacities and lower COPs which are caused by high pump power. It was further found that the capacities converge at a water flow rate of approximately 1.0 ds. An increase in water flow rate above 1.0 f/s has a negligible effect on the capacities but the water pump power increases dramatically.
A water flow rate of 0.5 (Is was therefore used in all simulations for the ground system, since the best COPs were achieved at this water flow rate. The simulated results comparing the ground-source system to the air-source system are graphically summarised in Figs. 3 to 6.
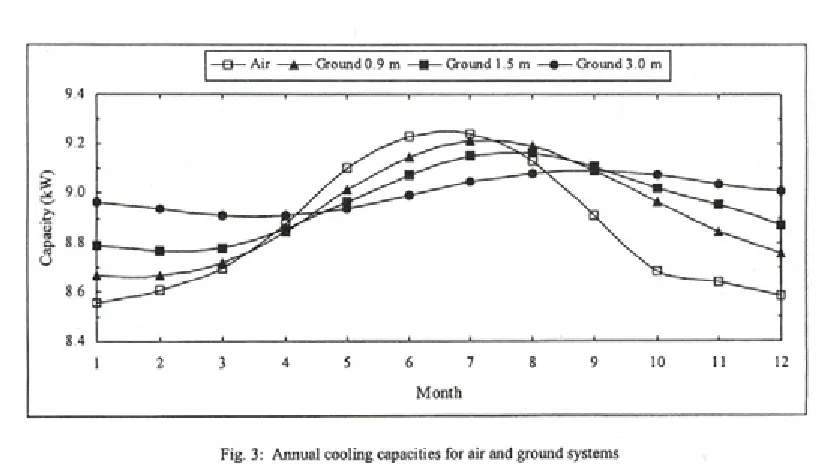
A i r —A— G r o u n d 0 . 9 m —■ — G r o u n d 1 .5 m — • — G r o u n d 3 . 0 m
The cooling capacity increases as the heat sink's temperature (air/water temperature) decreases, thus lowering the condensation temperature. The cooling capacity (Fig. 3) of the air-source system approximates the cooling capacity o f the ground-source system since the air and ground temperatures are similar. The cooling capacity of the ground-source system increases with an increase in depth. This increase in cooling capacity was less than 300 W for a temperature increase of 4°C over a depth increase of 2.1 m. The seasonal improvements of the ground-source system over the air-source system are tabulated in Table 3. Only improvements of up to 5% in cooling capacity were obtained due to the small temperature
difference between the air and ground during the summer months.
Table 3: Comparison of cooling capacities between air and ground systems
Depth Air
0.9 m 1.6%
1.5 m 2.7 %
3.0 m 4.2 %
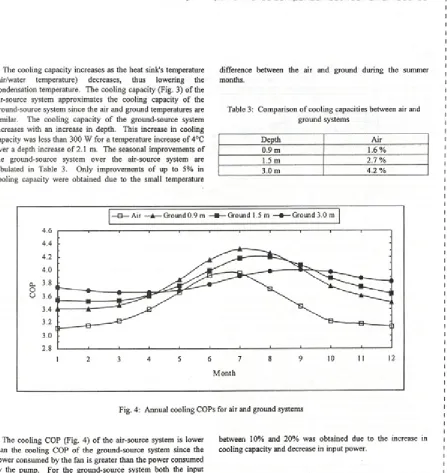
A ir — A — G r o u n d 0 .9 m —» — G r o u n d 1 .5 m — • — G r o u n d 3 . 0 m
Month
Fig. 4: Annual cooling COPs for air and ground systems
The cooling COP (Fig. 4) of the air-source system is lower than the cooling COP of the ground-source system since the power consumed by the fan is greater than the power consumed by the pump. For the ground-source system both the input power and cooling capacity increases with depth. The gain in cooling capacity was greater and therefore the cooling COP also increased with depth. The difference in cooling COP of the water-source system between using water at 3.0 m and water at 0.9 m was less than 0.4. The seasonal improvements of the ground-source system over the air-source system are tabulated in Table 4. A substantial improvement in cooling COP of
between 10% and 20% was obtained due to the increase in cooling capacity and decrease in input power.
Table 4: Comparison of cooling COPs between air and ground systems
Depth Air
0.9 m 9.9 %
1.5 m 15.1 %
3.0 m 19.8 %
A i r — A — G r o u n d 0 . 9 m ■ ■■ G r o u n d 1 .5 m — • — G r o u n d 3 0 m
Fig. 5: Annual heating capacities for air and ground systems
The heating capacity (Fig. 5) increases as the heat source's temperature increases, thus increasing the evaporation temperature. The heating capacity of the air-source system is lower than the heating capacity of the ground-source system due to the larger temperature difference between the air and ground. The heating capacity of the ground-source system increased with an increase in depth. This increase in heating capacity was about 1.5 kW for a temperature increase of 4°C. The increase in heating capacity for both systems was greater than the increase in cooling capacity for similar temperature differences. The seasonal improvements of the ground-source system over the air-source system are tabulated in Table 5. A substantial improvement in heating capacity was obtained due to the larger temperature difference between the air and ground during the winter months. More than double the heating capacity
(improvement from 50% to 60%) was obtained by the ground- source system than by the air-source system when simulating the average daily minimum air temperatures (De Swardt, 2000).
Table 5: Comparison o f heating capacities between air and ground systems
Depth Air
0.9 m 22.4 %
1.5 m 24.6 %
3.0 m 27.8 %
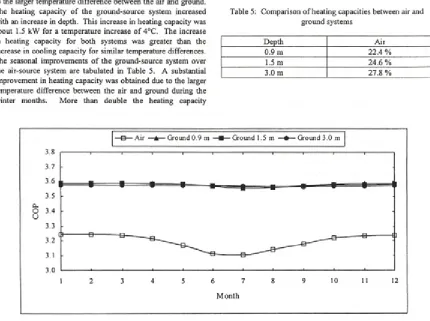
A i r — A — G r o u n d 0 9 m —■ — G r o u n d 1 .5 m —• — G r o u n d 3 .0 m
Fig. 6: Annual heating COPs for air and ground systems
The heating COP (Fig. 6) of the air-source system is lower than the heating COP of the ground-source system since the air- source system has less heating capacity and consumes more power than the ground-source system. For the ground-source system the input power and heating capacity increased with depth. The increase in power matched the increase in capacity and therefore the heating COPs remained almost constant with an increase in depth. The compressor input power increased significantly due to an increase in refrigerant mass flow rate with an increase in depth due to the increase in temperature. The refrigerant mass flow rate increases as the evaporation temperature increases while the condensation temperature stays constant. The seasonal improvements of the ground-source system over the air-source system are tabulated in Table 6. A substantial improvement in heating COP of 13% was obtained due to the increase in heating capacity.
Table 6: Comparison of heating COPs between air and ground systems
Depth Air
0.9 m 13.2%
1.5 m 13.3 %
3.0 m 13.2%
7. ECONOMIC ANALYSIS
A study of the reduced operating costs of the ground-source system due to an increase in efficiency was required to determine whether the additional purchasing expense of such a system is justified. One of the most significant parameters in determining the feasibility of a ground-source heat pump is the payback period (Liebenberg and Meyer, 1997) that is defined as
the increase in capital cost divided by the energy cost saving per annum.
The capital cost required to install a municipality connected ground-source heat pump rather than an air-source heat pump is mainly the difference in heat exchanger cost and the cost of the water line. The costs for installing the refrigerant line of the ground-source and air-source heat pumps were very similar and were therefore not included in the calculations. The cost of the fluted tube water-source heat exchanger was $420.00. The additional cost of connecting the water-source heat exchanger to a municipality water pipe was $125.00. The cost of the pump required to circulate the water through the water-loop was estimated to be $80.00. The air-source heat exchanger and fan that were substituted by the fluted tube heat exchanger was valued at $500.00. The difference in capital cost was therefore $125.00.
The energy cost saving during the year is a function of the power used and the unit cost of power. In order to compare the ground-source system with the air-source system the annual capacity needs to be the same. From simulations it was found that the air-source system has 13% less annual capacity than the ground-source system. This implies that the ground-source system needs to operate 13% less o f the time to deliver the same annual capacity as the air-source system.
In Fig. 7 the payback period of the ground-source system is given. The running time per day of eight to twelve hours was used to generate different graphs as a function of the electricity tariff. A running time of ten hours was used as running time for the ground-source system. According to average consumptions for South Africa the effective electricity tariff is 0.0413 $/kWh (Meyer, 1996) and for this effective electricity tariff the payback period for the experimental set-up will be less than 3 years. An electricity tariff of 0.058 $/kWh will result in a payback period of less than 2 years. This payback period decreases for an increase in electricity tariff and an increase in running time per day.
A 8 Hours ■ 10 Hours 12 Hours
Electricity tarif ($/kWh)
8. CONCLUSIONS
Ground-source heat pumps have demonstrated the potential to reduce peak demands and total electricity consumption. The use of a municipality water reticulation system as a heat source/sink resulted in an annual improvement of 13% in capacities and an annual improvement of 14% in COPs. Especially at low ambient air temperatures ground-source heat pumps have significant heating capacity (24%) and efficiency improvements (20%) over air-source heat pumps.
The improvements in capacities and COPs may be ascribed to three main factors. Firstly there is the decrease in difference between the evaporation and condensation temperatures for the ground system. Secondly, the specific heat of water is more than four times greater than that o f air, which resulted in reduced power consumption of the water system over the air system. Thirdly, the enhanced heat transfer which was promoted by the fluted tube heat exchanger.
A performance comparison between a ground-source heat pump and an air-source heat pump was obtained. This comparison revealed that the deeper the municipality ground- source water, the greater the improvement in capacities and COPs.
The ground-source heat pump will have an acceptable payback period of less than 2 years, with an electricity tariff of 0.058 $/kWh. The additional purchasing expense of the ground-source system is thus justified. It is also apparent that the cost-effectiveness increases with an increase in electricity tariff.
It is concluded that the utilisation of municipality water reticulation systems as a heat source/sink is a viable method of optimising energy usage in the air-conditioning industry.
9. REFERENCES
ASHRAE, 1996, ASHRAE HVAC Systems and Applications, American Society of Heating , Refrigerating and Air Conditioning Engineers, Atlanta, Georgia, U.S.A.
ASHRAE, 1997, Fundamentals Handbook (SI), Measurement and Instruments, American Society of Heating , Refrigerating and Air Conditioning Engineers, Atlanta, Georgia, U.S.A., Chapter 14.
Bose, J.E., 1985, Design methods for closed-loop ground- coupled heat pump systems, Proc. 12'h Energy Technology Conf. (10 pages).
Cane, R.L.D. and Clemes, S.B., 1995, A comparison of measured and predicted performance of a ground-source heat pump system in a large building, ASHRAE Transactions, SD- 95-13-1, pp. 1081-1087.
De Swardt, C.A., 2000, A Performance Comparison Between an Air-source and a Ground-source Reversible Heat Pump, M.Eng. thesis, Rand Afrikaans University, South Africa.
HPSIM, 1994, Enerflow Technologies CC, South Africa, Version 1.1.
Liebenberg, L. and Meyer, J.P., 1998, The viability of capacity control of high temperature heat pump water heaters operating non-azeotropic mixtures, Proc. American Society of Mechanical Engineers and ASIA '97 Congress, Singapore, paper no. 97-AA-28.
MacBain, S.M., Bergles, A.E. and Raina, S., 1997, Heat transfer and pressure drop characteristics o f flow boiling in a horizontal deep spirally fluted tube, HVAC&R Research, Voi.3, no.l, p 65-80.
Meyer, J.P., Tshimankinda, M., Visagie, J., 1996, Potential for hot-water heating with heat pump reticulation in the domestic sector-techno-economic study, Energy Performance Services.
NIST, 1993, Thermodynamic Properties of Refrigerant and Refrigerant Mixtures Database, Version 4.0.
PS DATA, 1989, Dr A. Johannser.
Weather Bureau, 1968, Climate of South Africa, Part 1, Climate Statistics, Government Printer, Pretoria, South Africa.
Weather Bureau, 1986, Climate of South Africa, Climate Statistics up to 1984, Government Printer, Pretoria, South Africa.