© Strojniški vestnik 4 7C200138,424-434 ISSN 0 0 3 9 -2 4 8 0
UDK 5 3 6 .2
Izvirni znanstveni članek C1.013
© Journal of Mechanical Engineering 47(2001 DS,424-434 ISSN 0 0 3 S -2 4 B 0
UDC 5 3 6 .2 Original scientific paper (1 ,01 D
FIRE SUPPRESSION USING WATER MISTS
- A NUMERICAL MODEL
G eorge V . H adjisophocleous' 1 F ire R isk M anagem ent Institute fo r R esearch in C onstruction - N RC O ttaw a, O N C anada K 1A 0R6
V itor A .F. C osta3
3 D epartm ent o f M echanical Engineering
U niversity o f A veiro 3810.193 A veiro Portugal
M ingw ang A n 2
2 A tlantic N uclear Services Ltd. Fredericton, N.B.
C anada E3B 5C8
A ntonio C .M . Sousa3,4 4 D epartm ent o f M echanical E ngineering
U niversity o f N ew B runsw ick Fredericton, N.B.
C anada E3B 5A3
ABSTRACT
The modeling o f fire suppression using fine watersprays is described within the context o f an engineering computer model. A Lagrangian formulation was selected for the liquid droplet phase, while the gas phase uses an Eulerian formulation based on the RANS equations with a two-equation turbulence model. The fire is assumed to be a turbulent diffusion flame with its behavior dependent upon the supply o f hydrocarbon fuel and the air accessing the fire. A feedback mechanism is also implemented, which dictates the rate o f fuel evaporation. The flammability limits o f the fuel vapor are taken into account, and the concentrations o f fuel vapor, air, combustion products and steam evaporated from the droplets in the gas mixture are calculated by solving the equations for the mixture mass fractions. The droplets/gas phase interaction is described through source terms in the gas-phase equations.
The time-dependent equations governing the gas phase are solved in primitive variable form by using a segregated technique. The ordinary differential equations for droplet motion, heating and evaporation are solved by an explicit forward time integration, which starts at the injection point. The droplet time step is determined by considering the turbulence dispersion o f the droplets. The predictions produced by the model for the three different cases examined are physically realistic, notwithstanding the uncertainties associated with the experimental data and the input parameters.
INTRODUCTION
Ozone layer depletion concerns related to Halon 1301, a widely used fire suppressant, have led to the phasing-out o f its production under the terms o f the Montreal Protocol. This action has led an extensive R & D effort to find an agent or agents suitable for its replacement Active fire protection alternatives are either new chemical agents or traditional inerting agents, such as C 0 2, however there are a number of
difficulties concerning the use o f such alternatives. For instance a particular difficulty with the use o f C 0 2, and not uncommon to other agents, is that the concentration required (~ 30%) to suppress a fire is lethal to humans. Moreover, no matter how safe the new gaseous chemical agents may appear to be, in the future, they may be subjected to government regulations similar to those now in effect for the Halons, one aspect that has serious economic implications not only to users but also to producers. One possible alternative is the use o f fine watersprays. The use of water is attractive in terms o f cost/effectiveness. Its high heat capacity and high latent heat, combined with the rapid dilution of the gaseous phase concentrations o f fuel and oxygen by the steam produced, contribute favorably to fire extinction. Also, the use o f fine sprays increases the water total surface area exposed to the flames, which yields improved effectiveness of the water supply on fire suppression.
This paper examines the numerical modeling of fine watersprays or mists for fire suppression, where the term “fine” refers to sprays or mists with diameters ranging from 20 to 120 pm (Jones and Nolan, 1995). It should be mentioned that the technology has gained considerable maturity over the past decade, and commercial applications - such as the BP twin fluid nozzle, and the Marioff Highfog system (Jones and Nolan, 1995), have been in place for some time. Early attempts to characterize the mists within the context of fire protection are reported in (Mawhinney, 1993), however, by no means, it can be implied that the technology is well-known, and its applications are “routine”. In fact, a considerable R & D effort is still going on, and the literature, although not yet extensive, is growing at high pace, particularly in the experimental area (Ndubizu et al., 1998; Yao et al., 1999). Also, the recent regulation by the International Maritime Organization (IMO), which requires the replacement in commercial ships o f the current sprinkler system with low impact systems, such as water mists, gave renewed impetus upon the already existing R & D. In what concerns modelling, progress has kept a slower pace. It
I I
is recognized by many workers in the field o f fire science, that CFD (Computational Fluid Dynamics) has not reached yet the state o f being a design tool (Nam, 1996). Particular difficulties and limitations are still encountered when modeling turbulence and combustion, even so, the cases reported in this review paper present encouraging results. The predictions, although they are not capable o f fully evaluating the intervening physical phenomena, yield field solutions o f good engineering value.
In this review, it will be described a numerical methodology developed to analyze the mechanisms o f fine watersprays involved in fire suppression. The modeling o f the two phase interactive transient process is based on the Eulerian- Lagrangian formulation for the gas and liquid (droplets) phase, and a Gaussian approach for the turbulence dispersion of droplets. A one-step, fast reaction combustion model combined with the flammability limits for the fuel vapor in the gas mixture is used to simulate the turbulent diffusion flame resulting from the evaporation o f pooled liquid fuel. Successful applications of this particular methodology and similar methodologies conducted by the present authors are also described.
NUMERICAL METHODOLOGY
The process o f suppressing a liquid pool fire in a compartment with waterspray is rather involved since it is time-dependent and involves several multi-phase interactions, namely between water droplets and combustion gases, walls and fuel pool, and between flame and fuel surface. Even the droplets can affect each other if their concentration density is high. In the development of the model, the gas-spray flow is assumed to be a dilute flow in which the droplet motion is controlled by local aerodynamic forces, rather than by droplet-droplet collision (An
et al., 1994; Hadjisophocleous and Knill, 1994;
Hadjisophocleous et ah, 1995; Crowe, 1982). This assumption is particularly well-suited to the region 'far-away' from the atomizer head, therefore, a Lagrangian formulation was selected for the liquid droplet phase. In fact, this procedure seems to be the only viable approach for polydispersed distributions, and it may provide a better description o f the droplet phase, primarily in what concerns trajectories and residence times. The main features o f the Eulerian-Lagrangian method developed in the present work are further discussed.
Fire Model
The fire is assumed to be a turbulent diffusion flame with a behavior dependent upon the supply o f hydrocarbon fuel and the extent o f air accessing the fire. The fire can also be affected over time by the response o f the compartment. There is a feedback mechanism, which dictates the rate o f fuel evaporation. Equilibrium flash evaporation is assumed to occur, whereby all the liquid in a hot layer a few millimeters thick at the fuel surface boils to form a vapor o f a similar composition to the fuel. The liquid must be raised to its boiling temperature and vaporized in order to bum in the gas phase. The fuel supply rate to the flame can be determined using the approach proposed by Crowley and Johnson, 1991 and Crowley, 1991.
r n -q l\ò H vap+C{Tb —T(
)j d )where AHvxp is the enthalpy o f vaporization at the boiling temperature Tb under ambient pressure, T, and C denote the
initial temperature and specific heat o f the fuel, respectively, and q is the net heat flux to the fuel surface, which is approximated by the well-established heat flux (six flux) radiation model, similar to that proposed in Hoffmann and Markatos, 1988. In regions where flow obstructions are present, a porous medium approach is used, and as a first approximation, the coefficients o f absorption (a ) and scattering (as) are averaged as follows, e.g. in the x-direction:
ccA = a gPx + a P ( l - P x)
(2)
o s = a sgPx + { l - a PX l - P x) (3)
where Px is the surface porosity in the x-direction and ctg and oq, are the surface absorption coefficient for the gas and for the porous material, respectively; a sg is the scattering coefficient for the gas. For y and z directions similar formulations can be employed, and if Px *Py * Pz, the anisotropy o f the porous medium can be easily realized.
The release o f fuel vapor from the volumetric mass source is followed by turbulent mixing and combustion, described by a one step chemical reaction.
The rate o f fuel combustion during the fire development is determined with the eddy dissipation model for turbulent diffusion flame (Magnussen and Hjertager, 1976). During fire suppression, however, this model was modified to account for the effect upon the chemical reaction of the decrease o f the gas temperature due to the droplets. The concentrations of fuel vapor, air, combustion products and steam evaporated from droplets in the gas mixture are determined by solving the equations for fuel concentration and for three mass fractions dealing with fuel supply (ff), steam production from the droplets (f,) and air supply (f„), similar to the procedure used in Smith et al., 1980, since the sub-concentrations within air (e.g. N2, 0 2) and fuel vapor (e.g. C7H,6) are specified as input data, from the stoichiometric balance equations, with the Lewis numbers for all species assumed to be equal. The mass fractions satisfy the relation:
/ / + / i + / o =1 (4)
The concentration o f each species in the gas mixture is used to determine the transient heat release rate within the computational domain.
Gas phase governing equations
The transient gas-phase governing equations are written in 3- D, Cartesian coordinates with the assumption that the effect of displacement o f the gas by the droplets is negligible. These partial differential equations have the general form:
dp<t>
dt
d
+ -—
( p u d )
d X i d X i Teff
d<f>
d X i + S + S d (5)
where U* stands for the velocity component in the direction Xr Sd represents the particular source terms due to the presence of the droplets, and S is the gas phase source term in which the fuel mass source and the pressure drop associated with a porous medium are also included in appropriate computational cells. The term <f> in Eq. (5) can represent ten dependent variables, namely: 1 (continuity), U; (i=l ,2,3), K (time-mean kinetic
i i i I
I I i I I I I I
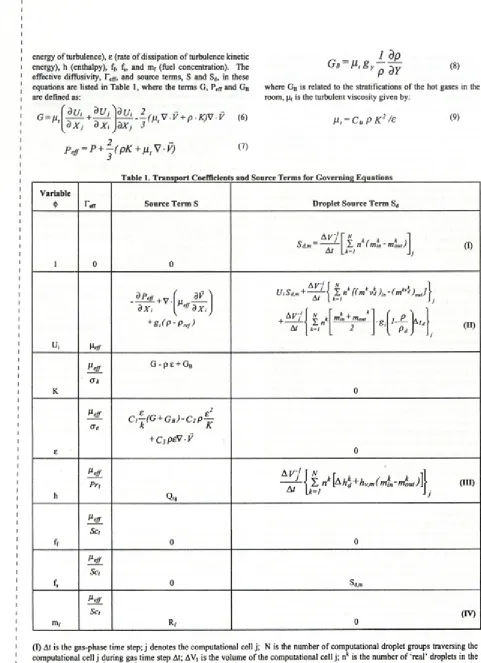
energy of turbulence), e (rate o f dissipation o f turbulence kinetic energy), h (enthalpy), ff, f„ and mr (fuel concentration). The effective diffusivity, r efT, and source terms, S and Sd, in these equations are listed in Table 1, where the terms G, Pefrand GB are defined as:
G = fi, d U i J U j d X j d X i
^ - - ( u , V V + p K ) V V (6)
d X j 3 '
P ejr = P + ^ ( p K + ß l V - V ) CD
„ _ 1 d p
Gb Pi S y (8)
where GB is related to the stratifications o f the hot gases in the room, ft, is the turbulent viscosity given by:
A
l , = C u P K 2 / E(9)
Table 1. Transport Coefficients and Source Terms for Governing Equations
Variable
♦ frfr Source Term S Droplet Source Term Sd
I 0 0
Sd.m =
-~ j-
n ( m i n - m L i) j (I)u, l%
d X i [ , f f d X ; j + S , ( P - P r ' f )
UiSd.m + "A~~~ j ’i . n k [ ( t n v j ) in- ( m h'‘l ) ou,]\^
K.
/ V a t
G - p e + Gb
0
e
a e
Ci- ( G + Gb) - C 2 P
k K
+ C j p e V F
0
h
Pr,
Qrg
j z , n k[ah kd + h v,m ( m i , - m kou
j] J
(HDff
Set
0 0
f.
S c t
0 Sdjn
mr
Sc ,
Rr
(IV) 0
1 (1) At is the gas-phase time step; j denotes the computational cell j; N is the number o f computational droplet groups traversing the computational cell j during gas time step At; AV| is the volume of the computational cell j; nk is the number o f ‘real’ droplets in the kth droplet group; mkin and mkou, are the mass of the ‘real droplet in the kth droplet group entering and leaving, respectively, the
i computational cell j. (II) i denotes the direction o f the coordinate (i = 1, 2, 3 for x, y or z, respectively); V is the velocity vector of the gas phase; g is the acceleration o f gravity in the appropriate direction; Atj is the residence time o f the droplet in the
\ computational cell j. (Ill) Qrg is the volumetric gas radiation heat source; Ahi is the heat loss o f gas phase to droplet heating and I evaporation; hv.m is the specific enthalpy o f the water vapour upon its production. (IV) Rf is the rate o f combustion o f fuel vapour.
I I I
I
The effective viscosity, tt.fr, is the summation o f the laminar viscosity, |l|, and turbulent viscosity, tt. The constants in the model take the following values: CM = 0.09, C| = 1.44, C2 =
1.92, C3 = 1.0, o k = 1.0, o E— 1.3, Pr, = 0.9 and Sc, = 0.9. The mixture enthalpy, h, is defined as:
f T >
h = ' L m j \ h j 0 + S C p . j ( T ) d T
(to)
J
\
T°
where m, is the concentration o f species j in the mixture, and hj0 is the reference enthalpy at temperature T0. Equation (10) is used to calculate the temperature T o f the gas.
In the porous medium region the following modifications of the overall energy equation are made: 1. the thermal capacity o f the porous medium is introduced through a volume- averaged material property in the transient term; 2. hydraulic permeabilities are used for the advective terms, and 3. the thermal diffusivities are mass-averaged to take into account the different values for porous material and gas.
Waterspray phase
A Langrangian formulation is used to describe the droplet phase since past experience (An et al., 1994) indicates that it is well-suited to predict the trajectories o f the droplets making up the mist, and the droplet distribution within the computational domain. The droplet motion is governed by the vectorial equation:
d (Ud ),
dt “ 7
4 Pjd
~~~7k C D ( u - U j ) i / U ~ U d l ~ £Pd
(11)
where ü and U j k are the gas and droplet group i.c. the droplet group k instantaneous velocity vectors, respectively, while u, and u kdi are the spatial x, y, z components. The instantaneous velocity u, is split as:
Ui = U i + U i’ (12)
with the variable U, representing each o f the components of the averaged gas velocity vector, and is determined from the governing equations for the gas phase, while u,’ is the fluctuating component, and is calculated with a statistical approach (Gosman and lonnides, 1981) using the concept of a required time period for the droplets to go through a given eddy. The droplet heating and evaporation mechanisms are formulated based on a Tumped capacitance’ model (Gosman and lonnides, 1981 ; Lefebvre, 1989), where the required assumptions related to a uniform temperature for the droplet at each instant o f time are appropriate since the droplet diameters tend to be smaller than 120 pm; heat transfer coefficients are evaluated from experimentally-derived correlations (Ranz and Marshall, 1952).
I i i i
NUMERICAL ALG ORITH M \
The ordinary differential equations for droplet motion, , heating and evaporation are solved by an explicit forward i time integration starting at the injection point (An et al. 1
1994). The droplet time step is determined by considering the turbulent dispersion of droplets as already mentioned. , The integration o f the relevant properties over the path o f a i droplet within a control volume leads to droplet contributions 1 to the source term Sd.
The algorithm, within each time step o f the gas phase, has , the capability o f introducing in the flow field different droplet i groups, each with a defined set o f properties such as the i droplet initial diameter and velocity. Each droplet release is 1 characterized by a water flow rate, a prespecified number o f , “groups” for each nozzle, and the Gaussian distributions o f i droplet diameter and velocity, magnitude and direction. < During a time step for the gas phase, droplets may be 1 removed from the droplet calculations due to evaporation, , outflow, or retention by the walls; the droplets remaining at i the end o f the gas phase time step will continue to be tracked I in the next time step.
The interaction between the gas phase and liquid (droplet) f
phase evolves with time, and the developed algorithm , performs on a step-by-step basis for a given gas time step, as i follows: 1. the gas phase equations are solved for specified 1 fire conditions; 2. the droplets are “injected” into the , computational domain, and their trajectories, temperatures, | and mass changes as well as their contributions to the gas i phase field are computed; 3. the gas phase equations with the 1 new droplet-related sources are solved again using the fire t
conditions o f step 1.; 4. Steps 1., 2„ and 3. are repeated until | convergence is achieved. At this point new fire conditions i are calculated, and then if a predetermined time is reached or 1 the fire suppression requirements are met, the computation is terminated, otherwise it proceeds as described above. |
i
APPLICATIONS 1
In this section, predictions are presented for three different applications of fine watersprays namely : 1. porous medium , effect on fire suppression, 2. suppression o f liquid pool fires, i and 3. suppression of aircraft cabin fires. Any particular 1 deviations from the numerical model just described are noted,
and discussed. i
i Application I
Description. The numerical simulations were performed using the solver o f the TURCOM code (Lai, 1988) , and the configuration for which they were conducted is i depicted in Fig. 1. The actual geometry is a fire test room 1 and a 'mock-up' o f a shipboard forward auxiliary machinery room at the National Fire Laboratory, NRC, Canada , (NFL/NRC). Its dimensions are 3.66 m in height and 6.1 m i by 6.1 m in plan. Through the 'inlet' forced ventilation air, 1 which rises vertically from the 0.9 m by 0.45 m duct riser on the rear wall, discharges at an elevation of 3.0 m. The , 'internal object1 represents the diesel engine, and the 'porous i medium' serves to describe suspended piping, cable trays and 1 duct work at deck level. The mist nozzles are located 0.2 m 1 below ceiling level, and they are placed in a 1 m by 1 m grid. , The 'mass source' describes the region o f fuel vapour release i
of Naval distillate from the fuel pan. '
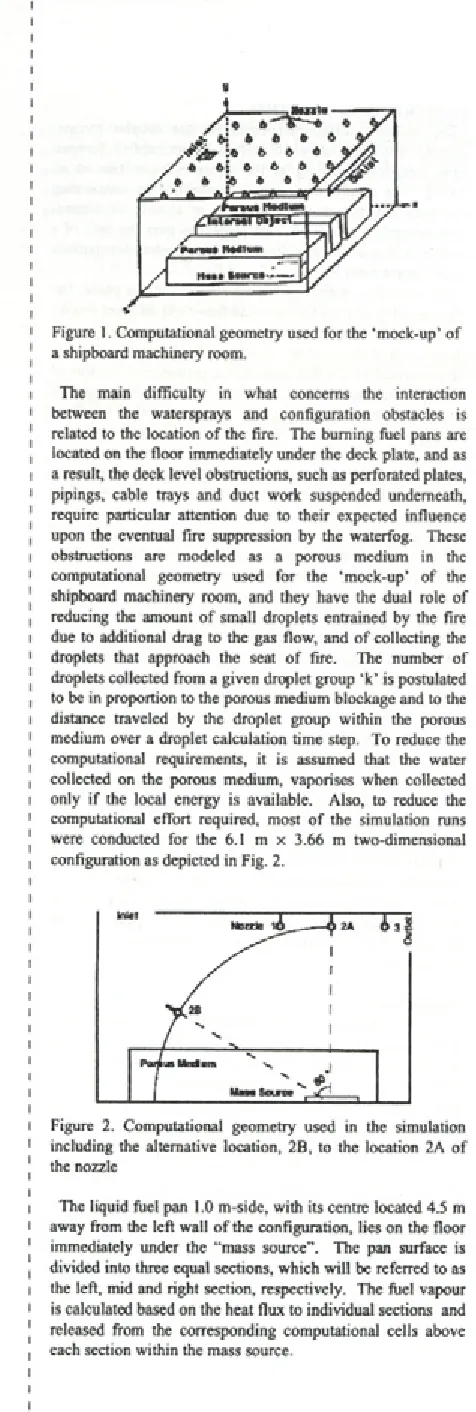
Figure 1. Computational geometry used for the ‘mock-up’ of a shipboard machinery room.
The main difficulty in what concerns the interaction between the watersprays and configuration obstacles is related to the location o f the fire. The burning fuel pans are located on the floor immediately under the deck plate, and as a result, the deck level obstructions, such as perforated plates, pipings, cable trays and duct work suspended underneath, require particular attention due to their expected influence upon the eventual fire suppression by the waterfog. These obstructions are modeled as a porous medium in the computational geometry used for the ‘mock-up’ of the shipboard machinery room, and they have the dual role of reducing the amount o f small droplets entrained by the fire due to additional drag to the gas flow, and o f collecting the droplets that approach the seat o f fire. The number of droplets collected from a given droplet group ‘k’ is postulated to be in proportion to the porous medium blockage and to the distance traveled by the droplet group within the porous medium over a droplet calculation time step. To reduce the computational requirements, it is assumed that the water collected on the porous medium, vaporises when collected only if the local energy is available. Also, to reduce the computational effort required, most o f the simulation runs were conducted for the 6.1 m x 3.66 m two-dimensional configuration as depicted in Fig. 2.
Figure 2. Computational geometty used in the simulation including the alternative location, 2B, to the location 2A of the nozzle
The liquid fuel pan 1.0 m-side, with its centre located 4.5 m away from the left wall o f the configuration, lies on the floor immediately under the “mass source”. The pan surface is divided into three equal sections, which will be referred to as the left, mid and right section, respectively. The fuel vapour is calculated based on the heat flux to individual sections and released from the corresponding computational cells above each section within the mass source.
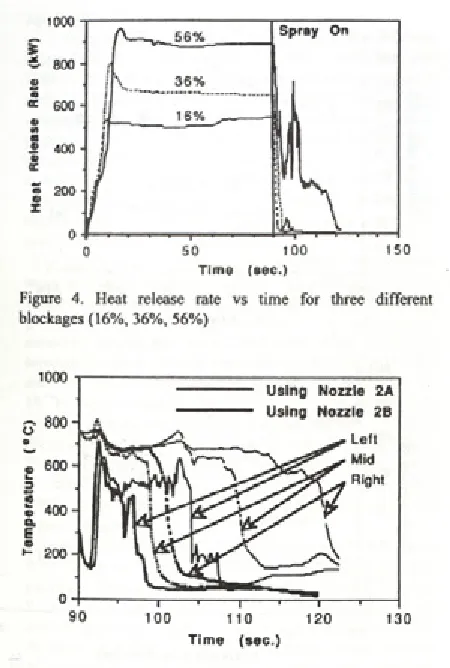
Results and Discussion. The fuel was ignited with an initial heat flux to the left section o f the pan, then the fire spreads over the pan surface, and the fire was allowed to develop for a period o f 90 seconds. The porous medium influence on fire development was analysed first since the fire suppression process is based on the fire scenario at the moment o f spray activation. Three different porous media with typical blockages 16%, 36% and 56% were compared. The fire spread and entrainment can shift the plume from the pan’s left to the mid and right sections based on the observed variation o f the temperature 15 cm-high above the pan sections, Fig. 3. Lower blockages yield higher rates for spread and shifting, and as a result, higher pan temperatures are obtained with higher blockages. As may be expected higher values o f blockage lead to higher percentages of radiative heat flux (28% o f 8.82 kW/m2 for 16% blockage, 58% o f 13.17 kW/m2 for 36% blockage and 78% o f 24.83 kW/m2 for 56% blockage). Figure 4 also corroborates that higher blockages yield higher heat release rates.
At the time o f 90 seconds from the start of the fire, three ceiling pressure nozzles (#1, #2A and #3 in Fig. 2), 3.46 m high and 1.0 m apart from each other, were activated. These nozzles discharge water at 0.308 kg/s each, and produce spray droplets with an average diameter o f 150 pm and a spray angle o f 150°. The fires with blockages 16% and 36%, respectively, were suppressed very quickly, while the fire with 56% blockage took more than 30 seconds to be extinguished. It is impossible to analyze the effect o f the porous medium upon the fire suppression without considering its effect upon the fire development. During the fire development it was observed that the fire for the two lower blockages, was low intensity and the plume was severely tilted, conditions which facilitate the fire suppression. This is further demonstrated when nozzle 2A is replaced by nozzle 2B (Fig. 2), which has an attacking angle o f 60° resulting in a higher tilting o f the plume. Under these circumstances the fire with 56% blockage can be suppressed in 12 seconds, a time much shorter than that with nozzle 2A (31.2 seconds) (Fig. 5). On the other hand, increasing spray velocity will not lead to increasing fire suppression rates, since the high spray momentum will spread the fire over the whole pan instead of making the fire to tilt, as shown in Fig. 5.
T im e (sec.)
Figure 3. Time development of temperature, before and after spray activation, 15cm-high above the right, mid and left pan sections, with 50% blockage.
T im e (sec.)
Figure 4. Heat release rate vs time for three different blockages (16%, 36%, 56%)
hood o f a calorimeter facility which was used to measure the heat release rate prior to and during suppression. A thermocouple tree, containing 6 thermocouples at 0.3 m vertical intervals, was placed above the center of the fuel pan, which was located on the floor o f the facility with the lowest thermocouple 1.5 m above the floor. Another set o f 5 thermocouples was placed horizontally near the hood at intervals o f 0.5 m. The fuel pan had a 0.9 m diameter, and a lip fuel height o f 100 mm.
The nozzle was placed near the ceiling, at the center o f the unit and 3 m above the floor. The nozzle used in the tests presented in this paper was a Model 3/4" 7G-5 water mist nozzle manufactured by Spraying Systems Company (SSC). The 7G-5 nozzle is a swirl type pressure nozzle with a spray angle of 150°. The drop-size distribution o f the watersprays from the 7G-5 nozzle was measured using a Drop Size Analyzer, and details o f the drop size measurements are given in (Mawhinney, 1994). The spray density from each nozzle configuration used for open fire tests was obtained by measuring the rate at which the waterspray fell on a collecting surface.
The computer code used for the simulation runs was developed by Advanced Scientific Computing Ltd. (TASCflow, 1994). For this particular case, the evaporated fuel was assumed to be heptane which reacted according to the empirical 4-step mechanism of Hautmann et al., 1981. The volumetric rate o f each reaction, Rf [kg/m3/s], is controlled by the lesser o f the kinetic reaction and of the turbulent mixing rate. The kinetic reaction rate is given by:
Rf Ac pT ^ PJP" exp (13)
Figure 5. Effect o f nozzle location (2B vs 2A) upon the temperature 15 cm-high above right, mid and left pan sections.
Concluding Remarks. Porous medium, as anticipated, has a significant adverse effect on the suppression o f a fire with waterfog in a ventilated room. Unlike inertial gas suppressants, the water droplets have to directly attack the seat o f fire in order that their evaporation can reduce the heat flux to the liquid fuel. Porous medium with high blockage over the fire not only blocks droplet “penetration”, but also contains the fuel vapour around the liquid fuel, this combined effect yields a fire structure with a strong vertical plume, which in the absence o f blockage would be tilted by the forced ventilation. From a design point of view, the suppression will be more effective if a forced flow does occur across the possible fire location. A deck level nozzle system producing a spray parallel to the flow may be required to maximize the action o f the ceiling spray system.
Application n
Description. The numerical model in this particular case was used to simulate the suppression o f an open fire, and ■fs predictions were compared against experimental data obtained in a mobile test unit used for open fire tests (Kim et al., 1994). The mobile unit was 3.5 m by 3.1 m and 3.3 m high, and its walls were constructed from perforated steel to break up the convective air currents without limiting the ventilation rate. The unit was placed under the collection
where Ac is the pre-exponential factor, p is the fluid density [kg/m3], Ec is the activation energy [K], T is the average fluid temperature, P is the concentration o f fuel and oxidant species in each reaction and b, n and m are constants. This model was tested and compared with data over an equivalence ratio range o f 0.12 to 2.0 and a temperature range o f 960 to 1540 K by Hautmann et al., 1981, but it does not take in account turbulent temperature or concentration fluctuations.
The kinetic model is primarily intended to limit the combustion rate at temperatures less than 1200 K. At higher temperatures, the reaction rate is assumed to be limited by the turbulent mixing of the reactants, which is proportional to eJK
according to, the eddy dissipation model of Magnussen and Hjertager, 1976, given by:
* / = A,p-^mm (14)
where, K is the turbulent kinetic energy [m2/s2], e is the turbulent dissipation rate [m2/s3], Yf and Y„ are the mass fractions of the fuel and oxidant, respectively, s{ is the mass stoichiometric coefficient o f the reaction and A, is a constant with a value of 32. For the present investigation, this combustion model was appropriate to account for the effects o f insufficient oxygen, slow fuel evaporation and slow reaction rate on the extinction process. In general, flame extinction would occur when the temperature or available oxygen in any given control volume became so low that the heat generating reaction steps were too slow to maintain the
I §rria(5))ji(j^Gg[ig|] s tra n -429
reaction. Extinction, in general, was observed when the temperature drops below 800 K.
Resalts and Discussion. Experimental tests were conducted first to determine the water flux density at different floor locations o f the compartment for the single nozzle under non-fire conditions. The results o f these tests, as well as the numerical predictions are shown in Fig. 6 and they indicate a maximum value o f the flux density in the region directly under the nozzle. The numerical predictions follow well the trends o f the experimental data, and they show the variations o f the water flux density in the transversal direction due to the randomness o f the injections and o f the waterspray transport process.
Y(»J
Figure 6. Comparison o f the experimental and predicted water flux densities at the floor for a single nozzle at a 3 m height location (Y : distance along the 3.5 m - dimension of the unit, and Y= 1.5 m is directly under the nozzle).
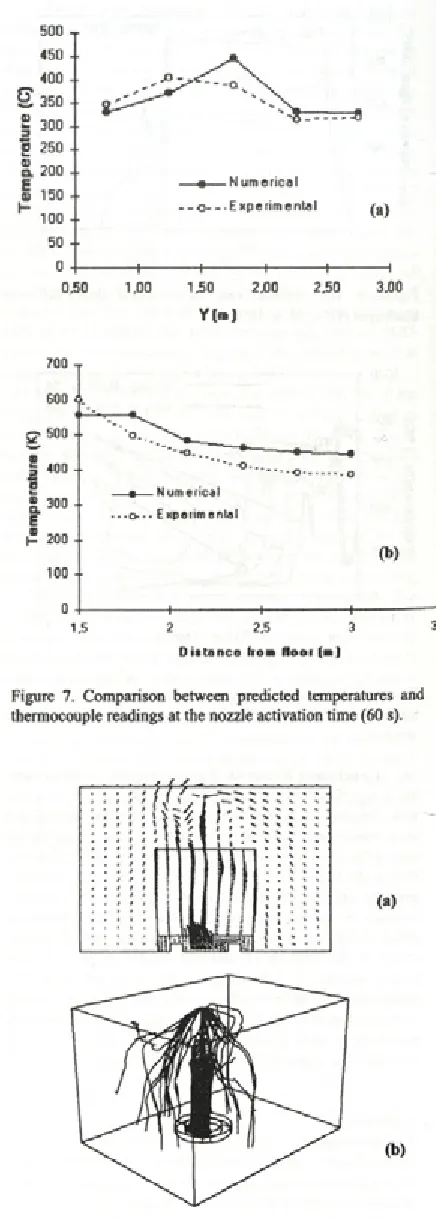
Figures 7 (a) and 7 (b) present at the nozzle activation time (60 s) the comparison between the temperatures measured by the set of 5 thermocouples located near the hood, and by the vertical string o f 6 thermocouples, and their respective numerical predictions. The agreement, when the relative uncertainties are taken into consideration, is very encouraging.
Figure 8 (a), which depicts the velocity vectors at 8 s after nozzle activation, indicates that the fire plume diverts the flow o f cold air and waterspray away from the plume and prevents its penetration up to the fuel surface, fresh air is still being drawn into the fire. Figure 8 (b) presents a 600°C constant temperature surface while, which was pushed down by the waterspray - before the nozzle activation it was extending into the hood. For this particular test it should be noted that the fire was not extinguished by the waterspray.
Concluding Remarks. The results o f the simulations are promising as they show that this complex process can be modeled, as their agreement with the experimental data is remarkably good. Also, the relative participation o f the various intervening parameters, such as type o f nozzle, amount o f water used, and fire heat release rates can be predicted.
Figure 7. Comparison between predicted temperatures and thermocouple readings at the nozzle activation time (60 s).
Application III
Description. This particular application deals with the suppression o f in-flight aircraft cabin fires - over the period 1964-1984, more than 1000 passengers perished as a result of such fires (Ramsden, 1987). In a study by Hill et al., 1993, a waterspray system was developed to protect aircraft cabins particularly from external fires. The system achieved a 7- minute extension o f survival conditions in the cabin using 3- minute discharge o f approximately 90 litters o f water.
The numerical model used in the analysis is altogether similar to that o f Application II, and the simulation runs were conducted with the TASCflow code.
The nozzle used to generate the waterspray was modeled using a number o f point sources. At each point source, droplets were randomly injected in different directions to generate a solid cone spray pattern. To represent the measured droplet size mass distribution o f the spray, five separate groups o f droplets were defined, the diameters in pm are: 190, 240, 340, and 390, and their percentages are 13, 17, 19, 35 and 16, respectively. The mass associated with each group o f droplets was related to the experimentally measured distribution o f the droplets from the nozzles (Mawhinney, 1994). It should be noted these droplets cannot be classified as “fine” in the restricted definition o f Jones and Nolan, 1995, even so, they are much smaller than those produced by typical nozzles.
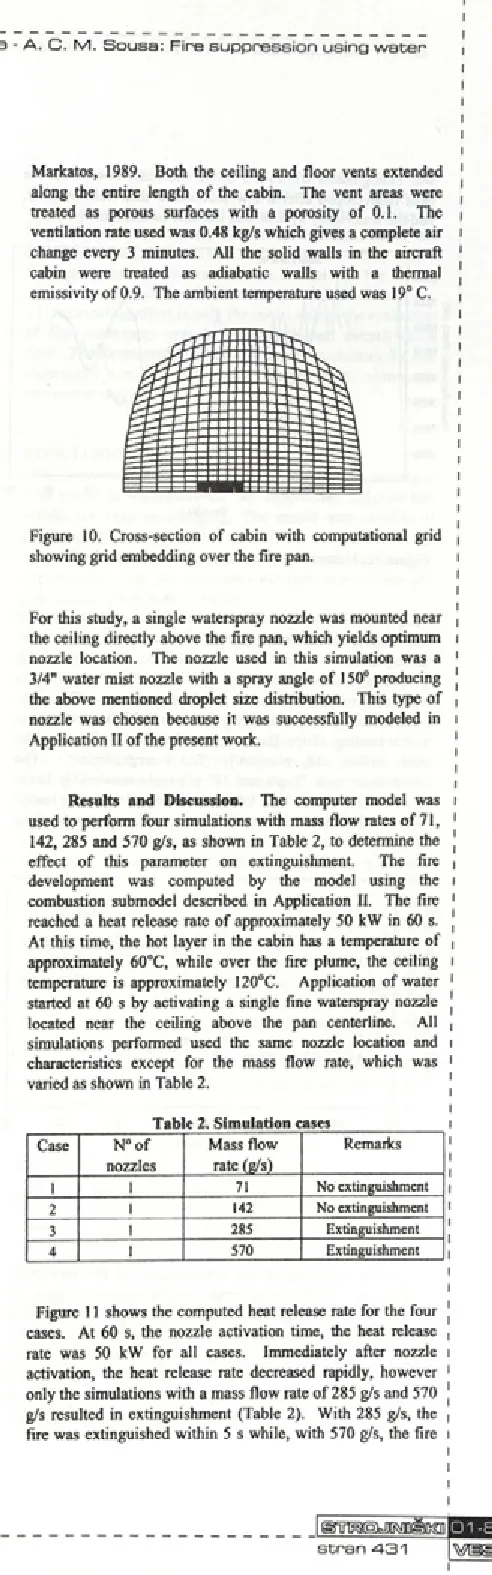
For this study, the cabin and fire characteristics were taken from Galea and Markatos, 1989, in which the interior o f a passenger Boeing 737 aircraft was used, as depicted in Figure 9. The cabin had a length o f 17.1 m, a floor width o f 3.3 m and a height o f 2.1 m. A 23 x 23 x 77 grid was generated for the cabin, as shown in Figure 10. The cabin fittings consisted o f passenger seats arranged in two- and three-seat configurations with a single aisle and overhead passenger storage bins.
Figure 9. Aircraft cabin geometry used in the model.
To simulate a 50 kW fire as stated by Galea and Markatos, • 989, it was used a pan containing heptane fuel with the size of 320 mm x 380 mm x 19.5 mm located in the aisle at half the cabin length. An embedded grid with 7 x 16 x 25 control volumes was placed in the computational domain around the pan location, as shown in Figure 10, to provide enough grid resolution around the fire pan to capture the recirculating flow around the pan lip. The total number o f grid points used for the simulations was 43,533.
The aircraft ventilation system was simulated by assuming a uniform venting at the ceiling and floor. The supply vents were located at the top o f the ceiling and the return vents were situated at the floor in the left and right comers, simulating a ventilation configuration proposed by Galea and
i I I i I I i i I i Markatos, 1989. Both the ceiling and floor vents extended 1 along the entire length o f the cabin. The vent areas were , treated as porous surfaces with a porosity o f 0.1. The i ventilation rate used was 0.48 kg/s which gives a complete air i change every 3 minutes. All the solid walls in the aircraft 1 cabin were treated as adiabatic walls with a thermal emissivity o f 0.9. The ambient temperature used was 19° C. |
Figure 10. Cross-section of cabin with computational grid showing grid embedding over the fire pan.
For this study, a single waterspray nozzle was mounted near the ceiling directly above the fire pan, which yields optimum nozzle location. The nozzle used in this simulation was a 3/4" water mist nozzle with a spray angle o f 150° producing the above mentioned droplet size distribution. This type of nozzle was chosen because it was successfully modeled in Application II o f the present work.
Results and Discussion. The computer model was used to perform four simulations with mass flow rates o f 71, 142, 285 and 570 g/s, as shown in Table 2, to determine the effect o f this parameter on extinguishment. The fire development was computed by the model using the combustion submodel described in Application II. The fire reached a heat release rate o f approximately 50 kW in 60 s. At this time, the hot layer in the cabin has a temperature of approximately 60°C, while over the fire plume, the ceiling temperature is approximately 120°C. Application of water started at 60 s by activating a single fine waterspray nozzle located near the ceiling above the pan centerline. All , simulations performed used the same nozzle location and i characteristics except for the mass flow rate, which was 1 varied as shown in Table 2.
Table 2. Simulation cases
Case N° of
nozzles
Mass flow rate (g/s)
Remarks
1 1 71 No extinguishment
2 1 142 No extinguishment
3 1 285 Extinguishment
4 1 570 Extinguishment
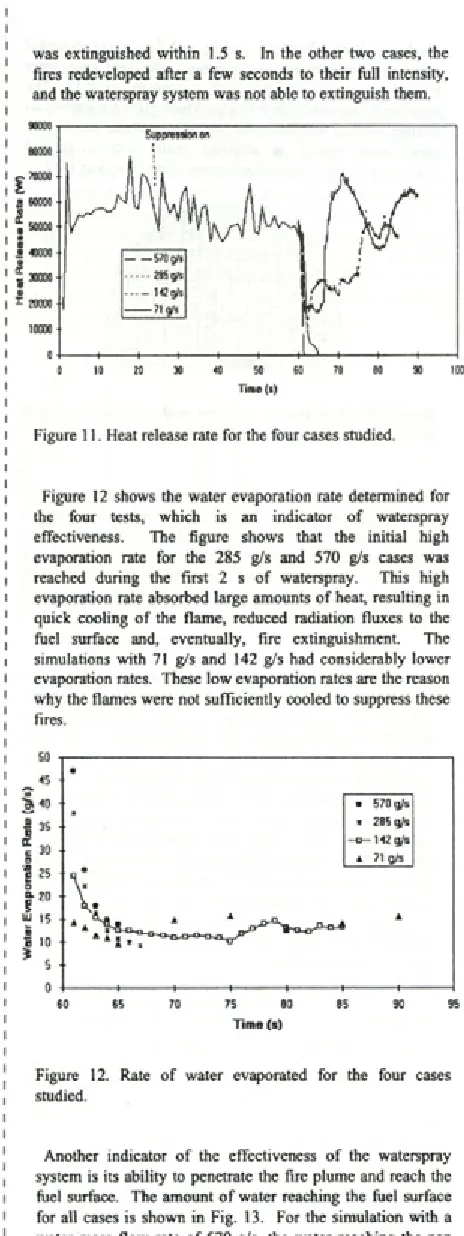
was extinguished within 1.5 s. In the other two cases, the fires redeveloped after a few seconds to their full intensity, and the waterspray system was not able to extinguish them.
Figure 11. Heat release rate for the four cases studied.
Figure 12 shows the water evaporation rate determined for the four tests, which is an indicator o f waterspray effectiveness. The figure shows that the initial high evaporation rate for the 285 g/s and 570 g/s cases was reached during the first 2 s o f waterspray. This high evaporation rate absorbed large amounts o f heat, resulting in quick cooling o f the flame, reduced radiation fluxes to the fuel surface and, eventually, fire extinguishment. The simulations with 71 g/s and 142 g/s had considerably lower evaporation rates. These low evaporation rates are the reason why the flames were not sufficiently cooled to suppress these fires.
Time (s)
Figure 12. Rate o f water evaporated for the four cases studied.
Another indicator o f the effectiveness o f the waterspray system is its ability to penetrate the fire plume and reach the fuel surface. The amount o f water reaching the fuel surface for all cases is shown in Fig. 13. For the simulation with a water mass flow rate of 570 g/s, the water reaching the pan peaks at approximately 23 g/s while, for the 285 g/s simulation, approximately 10 g/s o f water reaches the pan. In the case with 142 g/s, only approximately 4 g/s o f water
reaches the fuel surface while, in the case with 71 g/s, little or no water reached the pan.
Time (s)
Figure 13. Rate o f water accumulated in fire pan for the four cases studied.
The computed ceiling temperatures above the fire are depicted in Figure 14. At the time of nozzle activation, the ceiling temperature is approximately 120°C. With the activation o f the nozzle, the temperature decreases for all cases. In the case o f the 570 g/s and 285 g/s water flow rates, the decrease is very rapid reaching 40°C in approximately 5 s after nozzle activation. In the case o f 142 g/s, the temperature decreases to approximately 40° C within 10 s of waterspray and remains between 40 and 60°C for the duration o f the simulation. In the case of 71 g/s, after the initial drop to approximately 50°C, the temperature fluctuates between 60 and 85°
Figure 14. Temperatures above the fire pan one grid down from the ceiling o f the cabin for the four cases studied.
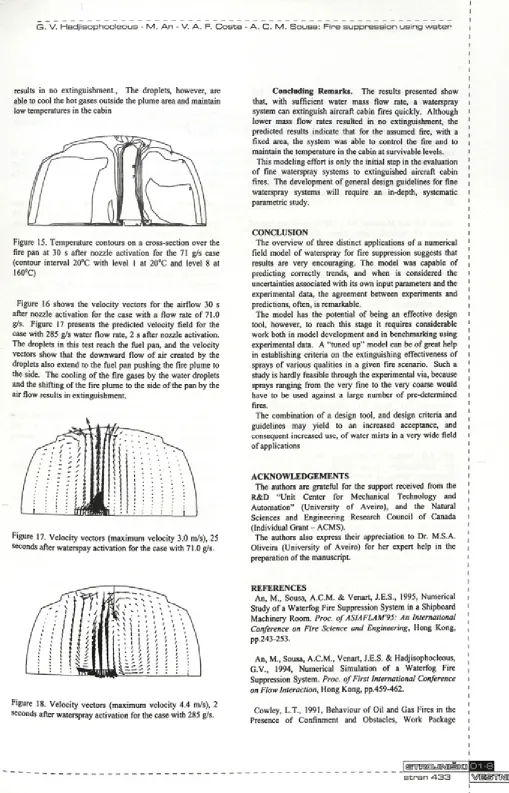
Figure 15 shows the temperature contours in the cabin at 30 s after nozzle activation for the case with the 71 g/s water flow rate. Most o f the cabin has a temperature below 40°C indicating that, in terms o f temperature, and for the assumed fire with fixed area, the waterspray system, even at this low flow rate, can maintain tenable conditions in the cabin for the passengers.
results in no extinguishment., The droplets, however, are able to cool the hot gases outside the plume area and maintain low temperatures in the cabin
Figure 15. Temperature contours on a cross-section over the fire pan at 30 s after nozzle activation for the 71 g/s case (contour interval 20°C with level 1 at 20°C and level 8 at 160°C)
Figure 16 shows the velocity vectors for the airflow 30 s after nozzle activation for the case with a flow rate o f 71.0 g/s. Figure 17 presents the predicted velocity field for the case with 285 g/s water flow rate, 2 s after nozzle activation. The droplets in this test reach the fuel pan, and the velocity vectors show that the downward flow o f air created by the droplets also extend to the fuel pan pushing the fire plume to the side. The cooling o f the fire gases by the water droplets and the shifting o f the fire plume to the side o f the pan by the air flow results in extinguishment.
Figure 17. Velocity vectors (maximum velocity 3.0 m/s), 25 seconds after waterspay activation for the case with 71.0 g/s.
Figure 18. Velocity vectors (maximum velocity 4.4 m/s), 2 seconds after waterspray activation for the case with 285 g/s.
Concluding Remarks. The results presented show that, with sufficient water mass flow rate, a waterspray system can extinguish aircraft cabin fires quickly. Although lower mass flow rates resulted in no extinguishment, the predicted results indicate that for the assumed fire, with a fixed area, the system was able to control the fire and to maintain the temperature in the cabin at survivable levels.
This modeling effort is only the initial step in the evaluation o f fine waterspray systems to extinguished aircraft cabin fires. The development o f general design guidelines for fine waterspray systems will require an in-depth, systematic parametric study.
CONCLUSION
The overview o f three distinct applications o f a numerical field model o f waterspray for fire suppression suggests that results are very encouraging. The model was capable of predicting correctly trends, and when is considered the uncertainties associated with its own input parameters and the experimental data, the agreement between experiments and predictions, often, is remarkable.
The model has the potential of being an effective design tool, however, to reach this stage it requires considerable work both in model development and in benchmarking using experimental data. A “tuned up” model can be o f great help in establishing criteria on the extinguishing effectiveness of sprays o f various qualities in a given fire scenario. Such a study is hardly feasible through the experimental via, because sprays ranging from the very fine to the very coarse would have to be used against a large number o f pre-determined fires.
The combination o f a design tool, and design criteria and guidelines may yield to an increased acceptance, and consequent increased use, o f water mists in a very wide field of applications
ACKNOWLEDGEMENTS
The authors are grateful for the support received from the R&D “Unit Center for Mechanical Technology and Automation” (University o f Aveiro), and the Natural Sciences and Engineering Research Council of Canada (Individual Grant - ACMS).
The authors also express their appreciation to Dr. M.S.A. Oliveira (University of Aveiro) for her expert help in the preparation of the manuscript.
REFERENCES
An, M., Sousa, A.C.M. & Venart, J.E.S., 1995, Numerical Study o f a Waterfog Fire Suppression System in a Shipboard Machinery Room. Proc. o f ASIAFLAM'95: An International Conference on Fire Science and Engineering, Hong Kong, pp.243-253.
An, M., Sousa, A.C.M., Venart, J.E.S. & Hadjisophocleous, G.V., 1994, Numerical Simulation o f a Waterfog Fire Suppression System. Proc. o f First International Conference
on Flow Interaction, Hong Kong, pp.459-462.
Cowley, L.T., 1991, Behaviour of Oil and Gas Fires in the Presence of Confinmcnt and Obstacles, Work Package
1 ____________
s tra n 4 3 3 1v@©tT1M10I1€ I
No.FL2 o f the Technical Report, Shell Research Ltd, Thornton Research Centre: Chester, U.K.
Cowley, L.T. & Johnson, A.D., 1991, Oil and Gas Fires: Characteristics and Impact, Work Package No.FLl o f the Technical Report, Blast and Fire Engineering Project for Topside Structures, Shell Research Ltd, Thornton Research Centre: Chester, U.K.
Crowe, C.T., 1981, Review-Numerical Models for Dilute Gas-Particle Flows. ASME J. Fluids Eng. Voi. 104, pp. 297- 303.
Galea, E.P. and Markatos, N.C., 1989, Forced and Natural Venting o f Aircraft Cabin Fires, AGARD Conference
Proceedings N°467, May 22-26, Sintra, Portugal.
Gosman, A.D., & Ionnides, E., 1981, Aspects o f Computer Simulations o f Liquid-fueled Combustors. Proc. o f AIAA 19th Aerospace Meeting, St. Louis, Missouri, pp. 12-15.
Hadjisophocleous, G.V., Kim, A.K. & Knill, K., 1995 Modelling o f a Fine Waterspray Nozzle and Liquid Pool Fire Suppresion. Proc. o f International Conference on Fire Research Engineering, Orlando, FL., pp. 1-6.
Hadjisophocleous, G.V. & Knill, K., 1994, CFD Modelling o f Liquid Pool Fire Suppression Using Fine Watersprays.
Proc. o f Annual Conference on Fire Research, Gaithersburg, MD.,pp. 71-72.
Hautmann, D.J., Dryer, F.L., Schug, K.P. & Glassman, I., 1981, A Multiple-Step Overall Kinetic Mechanism for the Oxidation o f Hydrocarbons, Comb. Sci. Tech., voi. 25, pp. 219-235.
Hill, R.G., Marker, T.R. & Sarkos, 1993, C.P., Evaluation and Optimization o f an On-Board WateTspray Fire Suppression System in Aircraft, Proc. O f Water Mist Fire
Suppression Workshop, NIST, Gaithersburg, M.D., pp. 93-
103.
Hoffmann, N., & Markatos, N.C., 1988, Thermal Radiation Effects on Fires in Enclosures. Appi. Math. Modelling, voi. 12, pp. 129-140.
Kim, A.K., Dlugogorski, B. Z. & Mawhinney, J.R., 1994, The effect o f foam addittives on the fire suppression efficiency o f water mist, Halon Options Technical Working
Conference, Albuquerque, NM., pp. 347-358.
Jones, A., & Nolan, P.F., 1995, Discussions on the use of fine watersprays or mists for fire suppression. J. Loss Prev. Process Ind.,voi. 8(1), pp. 17-22
Lai, K.Y.M., 1988, TURCOM: A Computer Code fo r the Calculation o f Transient, Multi-Dimensional, Turbulent, Multi-Component Chemically Reactive Fluid Flows, Part II:
Compressible and Combusting Flow, Technical Report.
Lefebvre, A.H., 1989, Atomization and Sprays, Hemisphere, New York.
Magnussen, B.F. & Hjertager, B.H., 1976, On Mathematical Modelling o f Turbulent Combustion with Special Emphasis on Soot Formation and Combustion. Proc. o f The 16th
Symposium (International) on Combustion. Cambridge, MA,
USA., pp. 719-729.
Mawhinney, J.R., 1993, Characteristics o f water mists of fire suppression in enclosures. Proc. o f Halon Alternatives
Technical Working Conference, Albuquerque, NM, U.S.A.,
pp. 291-302.
Mawhinney, J.R., 1994, Watermist Fire Suppression Systems for Marine Applications: A Case Study, IMAS 94: Fire Safety on Ships - Development into the 21st Century, Institute o f Marine Engineers, London, UK.
Nam, S., 1996, Development o f a Computational Model Simulating the Interaction Between a Fire Plume and a Sprinkler Spray, Fire Safety Journal, voi. 26, pp. 1-33,
Ndubizu, C.C., Ananth, R., Tatern, P.A., & Motealli, V., 1998, On water mist fire suppression mechanisms in a gaseous diffusion flame, Fire Safety Journal, voi. 31, pp. 253-276,
Ramsden, J.M., 1987, Burning Questions, Flight Int., June.
Ranz, W.E., & Marshall, W.R., Jr., 1952, Evaporation from Drops (Part II), Chemical Engineering Progress, voi. 84(4), pp. 173-180,
Smith, P.J., Fletcher, T.H., & Smoot, L.D., 1980, Model of Pulverized Coal-Fired Reactors. Proc. o f The 18th
Symposium (International) on Combustion, Waterloo,
Canada, pp. 1285-1293.
TASCflow User Documentation, Version 2.3, Advanced Scientific Computing Ltd. Waterloo, Ontario, Canada.
Yao, B., Weicheng, F., & Liao, G., 1999, Interaction of water mists with a diffusion flame in a confined space, Fire Safety Journal, voi. 33, pp. 129-139.