H
H
E
E
A
A
R
R
T
T
D
D
I
I
S
S
E
E
A
A
S
S
E
E
C
C
L
L
A
A
S
S
S
S
I
I
F
F
I
I
C
C
A
A
T
T
I
I
O
O
N
N
U
U
S
S
I
I
N
N
G
G
N
N
E
E
A
A
R
R
E
E
S
S
T
T
N
N
E
E
I
I
G
G
H
H
B
B
O
O
R
R
C
C
L
L
A
A
S
S
S
S
I
I
F
F
I
I
E
E
R
R
W
W
I
I
T
T
H
H
F
F
E
E
A
A
T
T
U
U
R
R
E
E
S
S
U
U
B
B
S
S
E
E
T
T
S
S
E
E
L
L
E
E
C
C
T
T
I
I
O
O
N
N
M
M
.
.
A
A
k
k
h
h
i
i
l
l
J
J
a
a
b
b
b
b
a
a
r
r
Aurora’s Engineering College, A.P, India
B
B
.
.
L
L
.
.
D
D
e
e
e
e
k
k
s
s
h
h
a
a
t
t
u
u
l
l
u
u
IDRBT, RBI (Govt of INDIA)
P
P
r
r
i
i
t
t
i
i
C
C
h
h
a
a
n
n
d
d
r
r
a
a
Advanced System Laboratory, DRDO
ABSTRACT:Heart disease is the leading cause of death
in India and worldwide. India is in the middle of a major economic and industrial transition. The life style changes have led to rise in hypertension, obesity, smoking, diabetes and in turn heart disease. Disease diagnosis often done based on doctors experience and personal opinion rather than the data hidden in the medical data base, which leads to wrong diagnosis and increases diagnosis costs which in turn affects the quality of services provided by hospitals to the patients. Medical data mining is to search knowledgeable data for effective medical diagnosis.K nearest neighbor is one of the widely used data mining technique in classification. It is a straight forward classifier where samples are classified based on the class of their nearest neighbor .Medical data bases are high volume in nature. If medical data contains redundant, irrelevant attributes classification will produce less accurate results. Feature subset selection is a dimensionality reduction technique used to remove redundant features and to increase accuracy. By applying feature subset selection on medical data we can determine the attributes which contributes more towards the disease which indirectly reduces no. of clinical tests to be taken by a patient .This paper investigates to apply K nearest neighbor with feature subset selection in the diagnosis of heart diasease. The experimental results show that applying feature subset selection to KNN will enhance the accuracy in the diagnosis of heart disease for Andhra Pradesh population
KEYWORDS: Andhra Pradesh, Data mining, feature
subset selection, heart disease, k-nearest neighbor, symmetrical uncertainty of attributes.
1. INTRODUCTION
Data mining is a crucial step in KDD [UGP97].In recent years data mining has been applied in various fields including health care. Medical data comprises of a no. of tests essential to diagnose a
particular disease. Health care industries get advantage if data mining will be employed as an intelligent diagnosis tool. Researchers have been applying various data mining techniques to diagnose various diseases like diabetes, heart disease etc.
Heart disease is the leading cause of death in the world and India will bear 60% of the world’s heart disease burden by the end of the year 2012.Cardio vascular disease cause about 30%of deaths in rural areas [Gup08].CVD is an increasingly important cause of death in Andhra Pradesh. Hence there is an urgent need to develop a model to predict the heart disease of a patient.
Clinical diagnosis is done mostly by doctor’s advice and opinion rather than patterns hidden in medical data base. Hence there is a chance of wrong diagnosis and treatement.Patients are advised to take number of tests for diagnosis of a disease. In most of the case, not all the tests contribute towards effective diagnosis of a disease. Medical data bases are high volume in nature. Classification may produce less accurate results if medical data consists of irrelevant and redundant features. Feature subset selection has been active and fruitful field of research in machine learning and data mining. Feature selection is a dimensionality reduction technique used to reduce irrelevant data and to increase accuracy [H+09]
reliable parametric estimates of probability densities are unknown.
In this paper we investigate by applying KNN with feature subset selection to predict heart disease of a patient for Andhra Pradesh population.
In the next section, we review the concepts like K nearest neighbor classifier, heart disease, and feature subset selection .Section 3 deals with proposed method and section 4 describes experimental results. We conclude our final remarks in section 5.
2. THEORETICAL BACK GROUND
In this section we will discuss concepts like KNN, Feature subset selection and heart disease.
2.1 K- nearest neighbor classifier
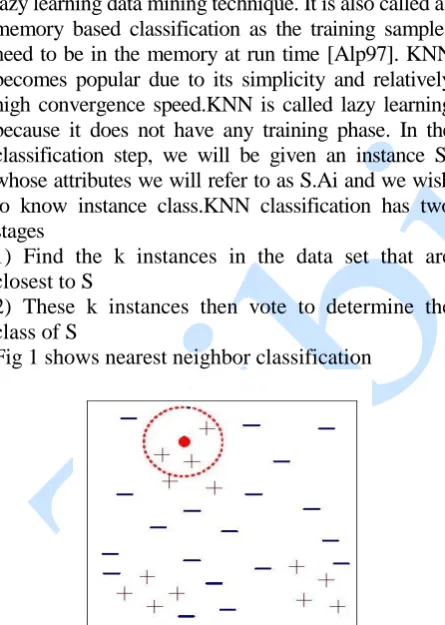
KNN is one of the most simple and straight forward lazy learning data mining technique. It is also called as memory based classification as the training samples need to be in the memory at run time [Alp97]. KNN becomes popular due to its simplicity and relatively high convergence speed.KNN is called lazy learning because it does not have any training phase. In the classification step, we will be given an instance S; whose attributes we will refer to as S.Ai and we wish to know instance class.KNN classification has two stages
1) Find the k instances in the data set that are closest to S
2) These k instances then vote to determine the class of S
Fig 1 shows nearest neighbor classification
Figure 1. K Nearest neighbor classification
Assume that we have a training data set T made up of (xi) [1,|T|] training examples. The samples are described by a set of features F and numeric features are normalized in the range [0,1].Each training sample is labeled with a class label CjC.We have to classify an unknown sample S.for
each Xi T we can calculate the distance between S and Xi as
F
f wf sf xif i
x s d
( , )
) , (
(1) Range of possibilities for continuous and discrete attributes would be
F discrete and Sf=Xif F discrete and Sf ≠ Xif F continuous
(2)
The nearest neighbors are selected based on above metric [P+07].When dealing with continuous attributes, Euclidean distance is used to calculate the distance between the attributes .Assume if the first instance is (a1, a2, ---an) and the second instance is (b1, b2---bn), the distance between first and second instance is calculated by
2 ) .(
... 2 ) 2 2 ( 2 ) 1 1 (
n b n a b
a b
a
(3) Continuous attributes are normalized to have the same influence on the distance measured between instances. Simple nearest neighbor algorithm [H+09] is shown in figure 2
There are variety of ways in which the K-nearest neighbors can be used to determine the class of S.One of the straightforward approach is to assign the majority class among the nearest neighbors to the sample S.
Figure 2 KNN Algorithm
There are variety of ways in which the K-nearest neighbors can be used to determine the class of S.One of the straightforward approach is to assign the majority class among the nearest neighbors to the sample S.
if x f s if
x f
s 1
0
) , (
Algorithm KNN
1) Let K be the no. of nearest neighbors and T be the set of training examples.
2) For each test sample z=(x1,y1) do
3) Compute d(x1, x), the distance between Z and
every sample, where (x,y) T
4) Select Tz subset symbol, the set of k closest
training examples to z
5) y1=argmax∑ (xi,yi) Tz I(V=Yi)
2.2 Feature subset selection
Feature subset selection is a preprocessing commonly used in machine learning, where subset of features available from the data is selected for application of a learning algorithm. The subset contains the least no. of attributes which contribute to accuracy. Remaining and unimportant attributes will be discarded. There are three approaches in subset selection.1) Forward selection 2) backward elimination3) combination of both. Feature subset selection is an important area in the field of pattern recognition and machine learning. The following points must be considered for feature subset selection.
1) Starting point:
In this step we must determine the starting point in the attribute space, which influence the direction of search. The search for attribute subsets can start with no attributes or full attributes.
2) Search strategy:
Exhaustive search needs to search for all of 2 n possible subsets of n features. Exhaustive search method is impractical for large no. of features. So we need to consider more realistic and practical approach.
3) Subset evaluation:
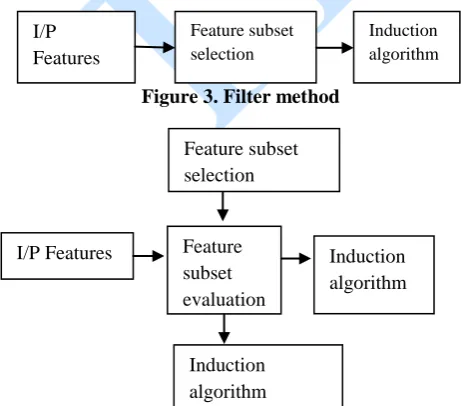
After generating subset of attributes, the attributes should be evaluated based on some evaluation criteria. The evaluation schemes are divided into two categories.1) Filter method 2) Wrapper method. Filter method does not involve any learning algorithm and relies on general characteristics of the training data to select some features. This model is generally choosen when no. of features becomes very large due to its computational efficiency. Wrapper method requires learning algorithm and uses its performance to evaluate and determine which features are selected. Figure 3 shows filter method and figure 4 describes wrapper method
Figure 3. Filter method
Figure 4. Wrapper method
4) Stopping criteria:
After executing above three steps we have to decide the criteria for handling features [C+O7].
2.2.1 Symmetrical uncertainty of attributes
Information gain is a measure of uncertainty of a random variable. It is based on the concept of entropy
)) ( ( log ) ( )
(
2
i
i
i
p xx p X
H
(4) and the entropy of x after observing values of another variable y.
jp(yj)i p(xi/yj)log2(p(xi/yj)) H(X/Y)
(5) where P (xi) is the prior probability for all values of X and P (xi/yi) is the posterior probability of X. And information gain is defined as
IG(X/Y) =H(X)-H(X/Y) (6) According to this measure, a feature Y is regarded more correlated to feature X than to feature Z if
IG(X/Y)>IG (Z/Y) (7) Symmetrical uncertainty is a measure which compensates information gain bias towards attributes with more values and normalizes IG values to the range [0, 1].value 0 indicates that X and Y are independent and value 1 indicates that value of one feature predicts the value of another feature.
SU(X, Y) =2[IG(X/Y)/H(X) H(Y)] (8) 2.3 Heart disease
Heart disease is the term that includes all types of diseases that affect various components of the heart. All heart diseases belongs to the category of CVD. Common cause of all heart diseases is the inadequate pumping of oxygen and blood from the heart to the rest of the body and vice versa. According to world health report 2010, primary risk factors of heart disease are
1) Use of tobacco 2) use of alcohol3) hypertension 4) physical inactivity5) cholesterol 6) obesity7) unhealthy diet8) raised blood glucose [PHA11] . Heart diseases are classified as
I/P Features
Feature subset selection
Induction algorithm
I/P Features Feature subset evaluation
Induction algorithm
1) Coronary heart disease :
Coronary heart disease also known as coronary artery disease. It is a condition in which some plaque deposits block the blood vessels leading to reduced supply of oxygen and blood to the heart.
2) Angina pectoris:
This occurs due to insufficient supply of blood to the heart.
3) Congestive heart failure :
This occurs when heart can’t pump enough blood to the rest of the body.
4) Cardio myopathy:
This is the weakening of the heart muscle due to inadequate heart pumping.
5) Congenital heart disease:
This is also known as congenital heart defect. This refers to the formation of an abnormal heart due to defect in the structure of the heart.
6) Arrhythmias:
This is associated with a disorder in the rhythmic movement of the heart beat.
7) Myocarditis :
Myocarditis is an inflammation of the heart muscle normally caused by fungal and bacterial infections and viral affecting the heart.
2.3.1 Heart disease in India:
India with a population of more than 1 billion accounted 60%world’s heart disease cases in 2010.According to the coronary artery disease among Indians research foundation, 62 million people will suffer from heart disease by 2015.In India almost 25%of victims of heart disease fall under the age of 40 years. Around 60,000 to 90,000 children have heart disease in India and only 15,000 to 20,000 are cured [HT12].
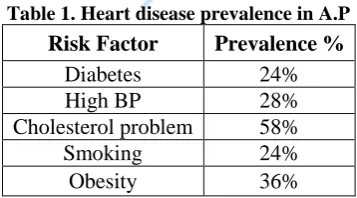
2.3.2 Heart disease in Andhra Pradesh
Various studies show that Andhra Pradesh is in risk of more deaths due to CVD. The prevalence of risk factors for heart disease was shown in table 1.
Table 1. Heart disease prevalence in A.P
Risk Factor Prevalence %
Diabetes 24%
High BP 28%
Cholesterol problem 58%
Smoking 24%
Obesity 36%
Studies to determine the precise cause of deaths have revealed that CVD was a leading cause of death accounting 32%of deaths, as high as Canada
and U.S.A.Hence there is a need to build a system to predict the heart disease of a patient so that they can take precautionary steps.
3. PROPOSED TECHNIQUE
In this section we propose a method for heart disease classification using K-nearest neighbor classifier with optimal feature selection. We used symmetrical uncertainty as a goodness measure to rank the attributes and based on the ranking we prune least ranking attributes. These evaluated attributes are given to KNN algorithm which helps in classification of heart disease. Symmetrical uncertainty of attribute is a measure which compensates information gain.
SU(X, Y) =2[IG(X/Y)/H(X) H(Y)] (9) Similarity among the features is calculated by:
n
i i
y i x f y
x
1
) , ( )
, (
(10) where n is no. of attributes .Our approach consists of 2 parts. First part deals with selecting predominate features and second part deals with classifying data sets and measuring the accuracy of the data set.
Various steps in our proposed algorithm Step1: choose the corresponding data set. Step 2: Apply SU Measure on the data set.
Step 3: identify all the predominate features to the class concept and remove rest of features. (Rank the attributes based on SU .prune the least rank attributes from the data set.)
Step 4: Now apply KNN on the dataset.
Step 5: find the accuracy of the classifier. Accuracy measures the ability of the classifier to correctly predict the class label.
Figure 5. Algorithm for selecting feature subsets
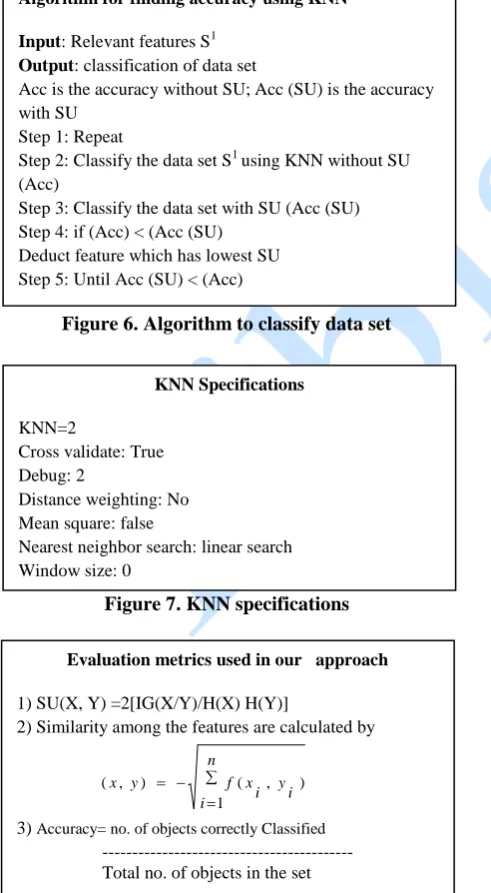
Figure 7 shows the Specifications used in KNN and metrics used in our approached are shown in figure 8.
Figure 6. Algorithm to classify data set
Figure 7. KNN specifications
Figure 8. Evaluation metrics used in our approach
We trained the KNN to classify the heart disease data set as either healthy or sick.
4. RESULTS AND DISCUSSION
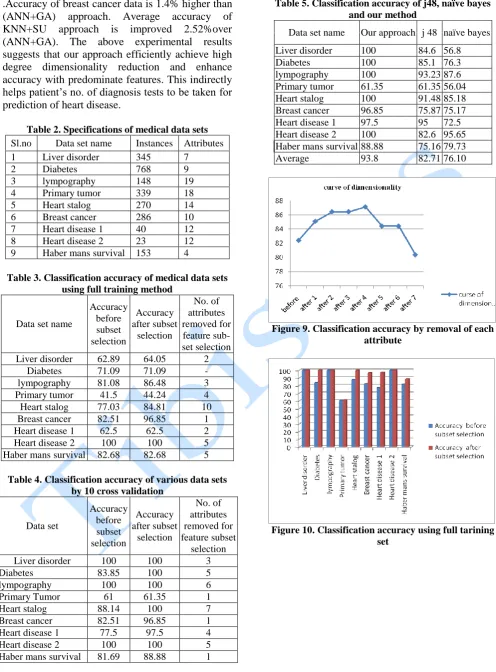
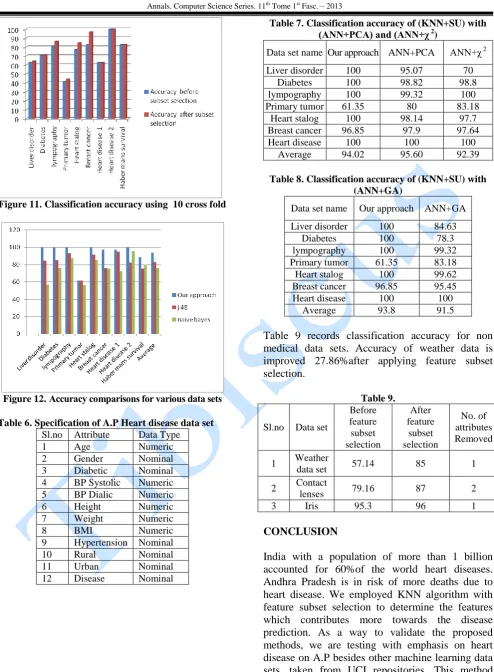
To evaluate the performance stability of our proposed algorithm, our approach is applied on various data sets extracted from UCI machine learning repository [BKC98]. Heart disease data set 1 and 2 are real life data sets collected from various corporate hospitals in Andhra Pradesh and features are chosen based on the opinion from expert doctors. The main package used in our experiments is WEKA 6.4.specifications of medical data sets is presented in table 2.for each data set, we run full training and 10 cross fold validation. Table 3 and Table 4 records the accuracy of various data sets using full training and 10 cross fold validation. Table 5 shows the learning accuracy of algorithms like j48, naïve bayes and our approach on different data sets. Table 6 shows A.P heart disease data set. From the averaged accuracy over all data sets, we observed that our approach improves the accuracy. From the individual accuracy values, we also observe that our approach maintain or even increases the accuracy for most of the data sets. Our proposed algorithm reached11.09% improvement over j48 and 17.7% improvement over naive bayes. Our approach reached improved accuracy compared with other traditional classification algorithms. So our approach performs better than traditional classification techniques. Fig 9 shows curse of dimensionality for lymph data set .fig 10 and fig 11 shows accuracy of various data sets using full training and 10 cross fold validation.Upto a certain point the increase in dimensionality reduction leads to improvement in the classification accuracy, but there after is a reduction in the classification accuracy. When comparing our proposed method in the diagnosis of heart disease for Andhra Pradesh population with other data mining techniques, our approach achieved higher accuracy of 2.5% over j48 and 25% over naïve bayes classification algorithms. Table 7 shows accuracy comparison of our proposed approach with two popular dimensionality reduction techniques, PCA+ANN and ANN+χ 2
.Accuracy of primary tumor is less in i.e. 61.35%,this is the fact that attributes in primary tumor data set are highly redundant. Average accuracy of our approach is 1.63% higher than the average accuracy with χ 2 approach and average accuracy of our approach is slightly less than PCA method. Table 8 records the accuracy comparison of our approach with evolutionary algorithms. Out of 7 data sets 5 data sets achieved 100%accuracy
Algorithm for selecting optimal feature subset Input: S (s1,s2,s3---sn, C)where C is a class And a threshold
Output: Relevant features s1in descending order Step 1: Begin
Step 2: for i=1 to N do
Step 3: calculate symmetrical uncertainty of attributes SU for Si
Step 4: if (SU i,c ≥
) Step 5: append Si to S1Step 6: order S1 in descending value Step 7: End
Algorithm for finding accuracy using KNN Input: Relevant features S1
Output: classification of data set
Acc is the accuracy without SU; Acc (SU) is the accuracy with SU
Step 1: Repeat
Step 2: Classify the data set S1using KNN without SU (Acc)
Step 3: Classify the data set with SU (Acc (SU) Step 4: if (Acc) < (Acc (SU)
Deduct feature which has lowest SU Step 5: Until Acc (SU) < (Acc)
KNN Specifications
KNN=2
Cross validate: True Debug: 2
Distance weighting: No Mean square: false
Nearest neighbor search: linear search Window size: 0
Evaluation metrics used in our approach
1) SU(X, Y) =2[IG(X/Y)/H(X) H(Y)]
2) Similarity among the features are calculated by
n
i i
y i x f y
x
1
) , ( )
, (
.Accuracy of breast cancer data is 1.4% higher than (ANN+GA) approach. Average accuracy of KNN+SU approach is improved 2.52%over (ANN+GA). The above experimental results suggests that our approach efficiently achieve high degree dimensionality reduction and enhance accuracy with predominate features. This indirectly helps patient’s no. of diagnosis tests to be taken for prediction of heart disease.
Table 2. Specifications of medical data sets
Sl.no Data set name Instances Attributes 1 Liver disorder 345 7
2 Diabetes 768 9
3 lympography 148 19
4 Primary tumor 339 18
5 Heart stalog 270 14
6 Breast cancer 286 10 7 Heart disease 1 40 12 8 Heart disease 2 23 12 9 Haber mans survival 153 4
Table 3. Classification accuracy of medical data sets using full training method
Data set name
Accuracy before subset selection
Accuracy after subset selection
No. of attributes removed for feature sub- set selection Liver disorder 62.89 64.05 2
Diabetes 71.09 71.09 - lympography 81.08 86.48 3 Primary tumor 41.5 44.24 4 Heart stalog 77.03 84.81 10 Breast cancer 82.51 96.85 1 Heart disease 1 62.5 62.5 2 Heart disease 2 100 100 5 Haber mans survival 82.68 82.68 5
Table 4. Classification accuracy of various data sets by 10 cross validation
Data set
Accuracy before subset selection
Accuracy after subset
selection
No. of attributes removed for feature subset
selection Liver disorder 100 100 3
Diabetes 83.85 100 5
lympography 100 100 6
Primary Tumor 61 61.35 1
Heart stalog 88.14 100 7
Breast cancer 82.51 96.85 1 Heart disease 1 77.5 97.5 4
Heart disease 2 100 100 5
Haber mans survival 81.69 88.88 1
Table 5. Classification accuracy of j48, naïve bayes and our method
Data set name Our approach j 48 naïve bayes
Liver disorder 100 84.6 56.8 Diabetes 100 85.1 76.3 lympography 100 93.23 87.6 Primary tumor 61.35 61.35 56.04 Heart stalog 100 91.48 85.18 Breast cancer 96.85 75.87 75.17 Heart disease 1 97.5 95 72.5 Heart disease 2 100 82.6 95.65 Haber mans survival 88.88 75.16 79.73 Average 93.8 82.71 76.10
Figure 9. Classification accuracy by removal of each attribute
Figure 11. Classification accuracy using 10 cross fold
Figure 12. Accuracy comparisons for various data sets
Table 6. Specification of A.P Heart disease data set
Sl.no Attribute Data Type
1 Age Numeric
2 Gender Nominal 3 Diabetic Nominal 4 BP Systolic Numeric 5 BP Dialic Numeric 6 Height Numeric 7 Weight Numeric
8 BMI Numeric
9 Hypertension Nominal 10 Rural Nominal 11 Urban Nominal 12 Disease Nominal
Table 7. Classification accuracy of (KNN+SU) with
(ANN+PCA) and (ANN+χ 2)
Data set name Our approach ANN+PCA ANN+χ 2 Liver disorder 100 95.07 70
Diabetes 100 98.82 98.8
lympography 100 99.32 100
Primary tumor 61.35 80 83.18 Heart stalog 100 98.14 97.7 Breast cancer 96.85 97.9 97.64
Heart disease 100 100 100
Average 94.02 95.60 92.39
Table 8. Classification accuracy of (KNN+SU) with (ANN+GA)
Data set name Our approach ANN+GA
Liver disorder 100 84.63
Diabetes 100 78.3
lympography 100 99.32 Primary tumor 61.35 83.18 Heart stalog 100 99.62 Breast cancer 96.85 95.45 Heart disease 100 100
Average 93.8 91.5
Table 9 records classification accuracy for non medical data sets. Accuracy of weather data is improved 27.86%after applying feature subset selection.
Table 9.
Sl.no Data set
Before feature subset selection
After feature
subset selection
No. of attributes Removed
1 Weather
data set 57.14 85 1
2 Contact
lenses 79.16 87 2
3 Iris 95.3 96 1
CONCLUSION
fewer attributes to diagnose the heart disease. The need to combat the affect of heart disease and to minimize its toll on Andhra Pradesh is obvious and urgent. More research is to be encouraged in this area and Dietary advice to younger people should be addressed and combining campaigns to improve diet with Efforts to increase physical activity may be needed to reduce coronary heart disease.
REFERENCES
[Alp97] E. Alpaydin - Voting over multiple condensed nearest neighbors, Artificial intelligence review, pp 115-132,1997
[BKC98] C. Blake, E. Keogh, C.J. Merz - UCI Repository of machine learning data Bases
[http://www.ics.uci.edu/~mlearn/ML epository.html], 1998
[C+09] Y. Chulmin et al - An experimental study on feature subset selection methods. Proceedings of the IEEE international conference on computer and information technology, pp 77-82, 2007
[Gup08] Rajeev Gupta - Recent trends in coronary Heart disease epidemiology in INDIA, Indian heart journal B:B4-B18, 2008
[H+09] J. Han et.al - Data mining concepts and Techniques, 2nd Edition, Elsevier, 2009
[HT12] Hindustan Times (2012), 29/09/2012,
www.hindustantimes.com
[M+03] Moreno F-seco et al - Modification of the LASEA algorithm for approximated K-NN classification, pattern recognition letters pp 47-53,2003
[P+07] Padraig Cunningham et al. - K nearest neighbor classifier, Technical report UCD-CSI-2007-4, March 27, 2007
[P+09] Pang ning tan et al - Introduction to data mining, Pearson education, fourth impression, 2009
[PHA11] PHAC (Public Health Agency of Canada) - www.phac-aspc.gc.ca/cd-mc/risk factor, 2011