What
users
actually
do:
a
study of service-seeking
behaviour in
an
academic
library
Kathryn
Roy,
Michael
Heine
and
lan
Winhuorth
TheAuthors
The authors all work at the University of Northumbria at Newcastle
E-mail : kathryn.ray @ unn.ac.uk
Kathryn Ray is Research Assistant, School
of
Information StudiesMichael Heine is Principal Lecturer, School
of
Information StudiesIan Winkworth is Director of Information Services
The
Context
This research concept was first publicised at the
Third Northumbria International Conf'erence on
Performance Measurement in August 1999.
It
was discussed at an informal workshop at Northumbria University in December 1999-
where thedesirability of more sub-caregories was highlighted. This article is presented here (i) for its intrinsic interest and
(ii)
because the authors wish to encourage researchers to take this methodology further in research projects elsewhere. (EDITOR)Abstract
This article describes what is believed to be an
innovative methodology for capturing the patterns and sequence of users' information service-seeking behaviour in one academic institution. The article outlines the thinking behind and development of this methodology; its application in terms of collecting
data: and highlights the general results that emerged.
lntroduction
This project was undertaken by the School
of
Information Studies and the Department
of
Information Services at the Universityof
Northumbria at Newcastle (UNN) between September 1998 and June 1999.
It
was motivated by a previous study of the physical movementsof
users within a public library described by MacGregor Smith and Rouse
(Igig).
It
was alsoinfluenced by survey work undertaken in the 1970s
by the Cambridge Library Management Research
Unit (Seymour
&
Schofield, 1973) of userbehaviour at card catalogues in several
UK
academic libraries, where intended actions which would be taken following perceived or actual failure in that service were surveyed.
Libraries already collect statistics in respect of the
volume of use, success rates or user satisfaction
of
individual services for users. To determine how
users group their use of services in responding to a
particular need this present research focuses on
users' behaviour as characterized by sequences
of
service use. This is in contrast to the two previously mentioned studies. which focused respectively on
physical movement within a public library and the
use of one panicular service.
Project aim
andobjectives
The aim of the project was to investigate the
applicability and usefulness of a methodology for improving understanding of student service-seeking behaviour in academic libraries. with a view to
developing that methodology so as to assist its applicability to any group of infbrmation services.
The objectives were:
.
To devise and pilot a methodology.
To develop a methodology that is portable, soit
can be used in any academic library and possibly other kinds of library.
To clarify in a conceptual way the sequentialpatterns of use of a library. so that both print and
electronic services are covered.
What uscrs actually do
Kuthnn Rav et al.
This research project was interested in developing a
methodology that would capture:
.
the number of different types of distinct serviceuse, evident during a users' visit to the library. For example what percentages of users ask the
advice of staff before choosing to identify documents.
.
the proportion of usage of a single type of service, for example the use of a CD-ROM to identify documents matching some criteria.
the overall pattern of usage, for example, OPACuse and shelf-access use are each separately of interest, but the order in which these two types
of
usage are exercised was primarily of interest
.
the eff-ect of "user status" on service use. for example subject studied.Methodology
Fundamental to this project was the development of
a set of service categones labeled as S1, 52, 53 etc.
A sequence of accesses to services in these
categories can be defined by following a trail within
these services. Individual episodes of use were then
characterised as follows :
Librry & Inlbmadon Research News (I-IRN) Volume 24 - Number 76 - SPring 2000
User
l:52,54,
S,l, 51User 2: 57
The first user accessed service S2 then accessed
service 54, then 53 and
finally
S1, while the second user only accessed S7.A schedule of categories was used to determine the
users' service-seeking behaviour. This was devised in the first instance by the project team influenced to some extent by existing categories used in UK work on library performance (including Brophy and
Wynne, 1997 and Winkworth, 1999). These
initial
categories were revised following both consultation with prof'essional staff in Information Services at
UNN and two pilot studies. The pilot studies each
took place with 20 students.
The schedule of categories has two levels of service. This recognizes five levels of general service that
are further broken down into
l0
more specific service categories (see Figure 1).Code Service Catesorr Code Service sub-categorv I The provision of information about
documents
l.l
The provision of means permitting theidentification of documents that match some search specification
t.2 The provision of means for identifying local holdings of known documents, and/or their
issue states
t.3 The provision of means for identitying non-local holdings of known documents and/or their issue states
2 The provision of direct access to specific (known) documents prior to fuller use
2.1 The provision of one or more collections permitting the retrieval of specific documents prior to use
2.2 Services supporting defened use of known documents bv the user
2.3 Services suonortins return of lent documents .1 Suooon lor immediate document study 3.1 The orovision of studv facilities
4 Advice sivins and user education 4.1 Factual advice sivins 4.2 Professional advice givine
5
Utility
Services 5.1 The library provides fbr meetings,Data collection
Interviews were undertaken with students between January and March
1999.
The survey took place in two libraries in one university both to capture dataper se and to provide an
initial
test of portability in the methodology. Both libraries offer similar services but support different teaching departments.157 interviews were undertaken in one site library while 152 were undertaken in the other site library, constituting a sample population of 309.
Interviewees were chosen on a "next-in-line', basis and were conducted at various times of the day as
students left the library in order to capture data on the complete sequence of service uses during that
Subject
Library & Infomarion Resea.ch News (LIRN) Volume 24 - Number 76 _ Spring 20{){)
visit.
Incentives were not used to encourage studentparticipation, however the refusal rate was relatively
low.
Of those asked to participat e. 23Va declined,the main reason provided being lack of time.
Interviews with students were based upon the earlier mentioned schedule of categories. To tacilitate
greater understanding, the schedule was adapted
into a pro forma as shown in Figure
2.
Studentsservice-seeking patterns were recorded directly onto
these forms by means of directed lines.
What users actually d0
Kathryn Ru, et
al-Date
Time
Coach Lane City Campus
Figure 2
particular service category took place.
library
EXIT
LIBRARY
ify
documents when know subject/author/class. (opAC,cD-RoM.
on-line, web. printed. ing by class)Identify local holdings of known documents. (OPAC. CD_ROM. nt, catalogue) and issue states.
Identify non-local holdings of known documents (BUBL, Web, ROM) and issue states
Get/look at known book
Look at electronic
information
prior to decision to use laterDefemed use (lending, renewal, photocopying. ,eseruation.
ILL-
nting. downloading web pages)Return material
Provision of study facilities (chairs, carrels.
,.b
.tG.ts,
O..to
information sourcesFactual advice
Professional advice
Utility
Services(Word process; meet others: coffee etc)
What users actually do
Kdthnn RLlr et aL.
Figure 2 records library usage as tollows:
1.1
The student identiftes documents when the sub.ject, class or author is known. This could bebrowsing the shelves of the library or by using electronic resources. For this action to be
understood the interviewer identified in detail what particular service the student actually used however.
lbr
the purpose of this project it was suflicient toindicate only the category.
1.1
The student identiftes documents when the sub.ject, class or cruthor is known. This action mayhave been identical to the previous action. or a
document may have been identified by a different method
1.1
The student identifies docttments *'hen tl'Le sub.ject, class or author is knon-n. As above2.1
The student either retrieye.\ or Looks at a known book or uses electronic information resources toidentifi' muteriul
prilr
t0 use3
The student then uses 179 5711(h:.fLtc'ilitiesavailable to study locally held or non-local information sources
2.2
The student then decides to clefer his/her useof
the material so either borrows, renews. reserves.
photocopies, prints or down loads the material.
5
Uilin
senices. The student has decided to usethe word processor, meet up with friends, or go for refreshments (still within the library building)
100 The student leaves the library.
This condensed pro forma of Figure 1 was an
essential tool in the project as categorising student's
responses was particularly
difficult
at the time of theinterview.
Each interviewee was asked their subject of study.
The categorisation scheme used by the Higher Education Funding Council fbr England (HEFCE.
1997) was used to classify courses. This has 34
subject categories such as Geography, Nursing and
paramedical studies, Humanities and Education (HEFCE, t997).
Librmy & Infomalion Research News (l-lRN)
Volume 2ul - Numbcr 76 Spring 200{)
ln order to minimise bias, where possible, the researcher followed a previously determined script when interviewrng students. This did not prove possible in all cases. In order to achieve a true rellection of service pattern
it
was necessary toprobe deeper and respond to each individual.
This individual probing was essential because of a
number of factors:
.
It became evident that students encountereddifficulty
recalling in sutllcient detail thesearching tactics they employed while searching electronic resources. For example they were able
to recall the topic they were searching for. but found difficuity remembering the process they had
undertaken to find the intbrmation that was
required for this research.
.
A number of students were unable to recall in detail their actual route through using the OPAC.For example. their immediate response was to
say, "searched.fur u book checking the OPAC" .
More detail was required but they were often unable to recall whether they had undertaken a
subject, author or title search and at what point they were either successful of accepted def-eatl
.
Students founddifficulty
remembering their exactpattern of use within the library. A number would
state that they had looked at the OPAC and then moved to the issue desk to bonow their books without referring to physically retneving these
books from the open access shelves.
.
Students appear to think physically rather thanconceptually. which was the higher level
of
service use we wanted to capture. They would
present a physical tour around the library rather than what they did at each service. They would
state that they
had
"usecl the clatubase to look up some cLtrrent publicatiorzs" and then gone "/o Floor 6 to .find some appropriate articles".
For the purposes of this researchit
was essential todetermine what they actually did while using the database to prevent only a physical tour of the
library emerging.
What users actually do
Kathnn Ray et ol.
DataAnalysis
The codes for the service categories used by each
respondent were entered onto a data
file
containing a row for each respondent. A C++ programme was written to analyse these data
yielding:
.
the number of service categories accessed.
the transition frequencies from one service category to every other service.
the subject category of student's course and/orlibrary used.
One of the predominant methods of analysing the data in this project was through the use
of
transition frequency tables. This is one wayof
analysing the sequences of service-use to provide
an overall view of service-use behaviour
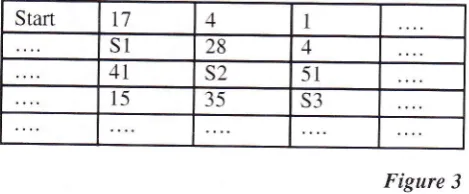
Figure 3
The service categories are recorded in the diagonal cells of the table. The other cells record the number of transitions between pairs of services to the other.
with rows picking up frequency of transition from a
Library & Intbmation Reseach News (LIRN) Volume 24 - Number 76 Spring 200{)
particular service and columns doing so fbr frequency of transition to a given service.
Figure 3 translates as:
17 students on entering the library went immediately to service S1
4 students went immediately to service 52 28 students used service 52 immediately after service S1
51 students used service 53 immediatelv after service 52;
15 students used service S1 immediately after service 53
Results
Although the sample was small and constitutes
students from only two libraries in one academic
institution the results provide some interesting
f'eatures that may be useful to system managers.
This section
will
provide a brief synopsis of thegeneral results accumulated lrom this project.
S equenc es of s emic e-us e
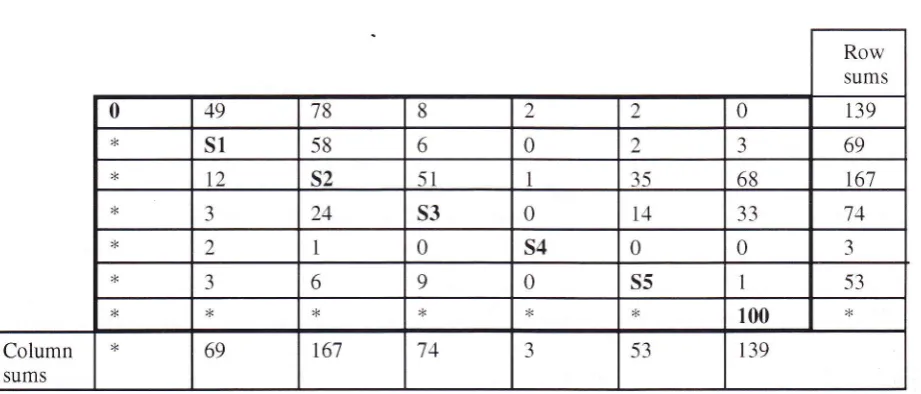
A transition table data, using the more general
schedule of service categories, is shown in Figure 4.
The 0 in the top left hand cell refers to the start
of
the users' visit while the 100 refers to the end of the
visit.
Start t7 4 1
SI 28 4
41 S2 5r
t-5 35 S3
Row
SUtnS
0 84 163 14 5 43 0 309
* s1 98 9
0 4 .J
rt4
* t'7 S2 r04
.51
t4q
i24
:k
4 46 S3 J 22 10
A5
*
-5 6 0 S4 0 0 11
* 4
ll
l8
0 S5 8',7 120
* k )k
100
Column
SUMS
*
rt4
324 t45ll
120 309
Figures 5 and 6 demonstrate sequences of service-use within the two libraries.
#;;';;i:i';-Example s of inte rp re tativ e stateme nts draw n .from
Figure 4 are:
.
84 students on entering the library went immediately to serviceSl
(provisionof
info rmat i on ab o ut do c ume nt s )
.
163 students on entering the library went immediately to service 32 (provisionofdirect
access to specific documents
prior
to.fuller use)Librry & Intbmation Researcb News (LIRN) Voiume 24 - Number 76 Spring 2000
.
149 students left the library after service 52.
114 students accessed serviceSl
(provisionof
inJb rmat i on ab o ut do c ume nt s )
.
145 students accessed service 53 (support.for immediate document studt ).
1I
students accessed service 54 (advice givirtgand user education)
Figure 5: Transitionfrequencies
(Library
lVo.I)
Row
SUMS
0 35 85 6 -1
1
0 t36
* S1 40 .J 0 2 0 45
* 5 s?. 5?
)
16 R1 151* 1 22 S3 .,) 8 37
1l
.J 5 0 S4 0 0 8
* 5 9 0 s5 r8 JJ
* * * ik 100 >k
Column
SUMS
45 157 11 8 J-r 136
Row
SUMS
0 49 78 8 2 2 0 139
* S1 58 6 0 2 J 69
t2 S2 51 I 3.5 68 t67
-l 24 S3 0
l4
.1 -1 712 I 0 S4 0 0 -:)
J 6 9 0 S5 53
* 100 *
Column
SUInS
* 69 167 74 -1 53 r39
What users actually do
Kothnn Ray et aL.
Summary of Figure 4 and Figure 5:
The tables suggest that the pattern of service use
broadly similar within both libraries.
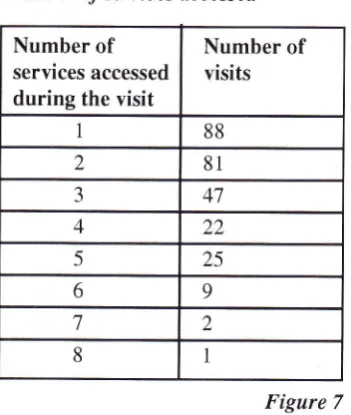
Number of semices accessed
Number
of
services accessed
during
thevisit
Number
of
visitsI 88
2 81
3 47
4 22
5 25
6 9
7 2
8 1
Figure 7
Figure 7 shows the number of visits where the students accessed at least one information service.
Summary of Figure 7
.
The most frequent number of service accesseswithin a visit was 1
.
One student accessed eight servicesAverage number of semice category accesses
Figure 8 highlights the mean number of service category accesses for the entire sample and for the
various groups within the sample. (These Jigures
are based on visits involving the use of at least one
infbrmation sen,ice)
"l*:T;:T:fil';:-.''J;x;,\Ll'
Summary of Figure B
is
Within the sample of visits surveyed:.
Humanities students access more services thanEducation students
.
Students using library No. 2 access more servicesthan students using library No. 1
.
Subject studied affects the number of servicesaccessed.
General summary of results
.
on average 2.5 types of service categories areaccessed by a student on a single visit
.
22Vo of students use the catalogue first.
of the 22Vo of students. 56Vo of these then checkissue status.
.
less than lVo of visits entail use of the advice services. either professional or non-professional..
7Va of the students included in the sample population use only'utilities'
(did not use anyinformation service)
.
49Vo of the visits involved a catalogue search.
47 Va of the sample used study facilities.
there were emerging differences between studentsstudying particular subjects. Humanities students
use more services (2.72) while Education students use less services (1.88) on each visit to the library on the evidence of the sample,
.
the most popular service accessed immediately after entering the library was 52 (provisionof
direct access to specific documentsprior
to.fulleruse)
.
the least popular service accessed immediately after entering the library was 54 (advice givirtg and user eclucation)Conclusion
This small-scale research project has provided a
number of positive outcomes including the design of
an etfective data collection method, and relevant analytical and presentational tools. The project highlights a number of problems that include the
level of detail in the classification scheme becoming too detailed for the responses from the students.
Despite these problems the project did highlight that this methodology can be used to collect valuable service access data that would allow system managers to gain a deeper appreciation of
service-Sample of visits Mean
A I students, both libraries 2.47
Library No.
I
students 2.31Library No. 2 students 2.63
Nursing and paramedical students
(n=30)
2.33
Biosciences students (n=41) 2.46
Humanities students (n=47 2.72 Education students (n=4 i ) 1.88
Whal users actually do Kathryn Ray et oL.
NOTE - The authors would be pleased to generate and return transition tables and related output on
behalf of persons interested in undertaking surveys
of the type described, provided data files are sent to them in an appropriate
format.
Confidentiality would of course be respected.References
Brophy, P. and Wynne, P. (1997) Management information
systems and performance measurement for the electronic library. Cente for Reseorch in Librory ond
I n fo r m otio n M o n o ge m e n7 M o n c h este r M etrop o I ita n
University,
MacGregor Smith and Rouse ( 1979) Application of
queuing network models to optimization of resource
allocation within libraries,lournol of the Americon Society
for Informotion Science 30, 25 0-253
Seymour, C.A & Schofield,J. L. ( I 973). Measuring reader failure at the catalogue. Library Resources andTechnicol
Services, 17,6-24.
Heine, M.H.,Winkworth, 1., and Ray, K. (l 999) Modeling service seeking behaviour in an academic library: a methodology and its application Journol of Acodemic
Libr o r ia nship fin pressJ
Winkworth, 1., Heine, M.H., and Ray, K. Measuring users' service-seeking behaviour. Paper presented at the 3rd
Northu mbrio Internotionol Conference on Performonce Meosurement in Librories ond lnformotion Services: "Volue
o n d I mp oct", Lon gh i rst, N orth u mbe rland, 27 -3 I August
1999 published lnformation North, Newcastle upon Tyne, 2000
Higher Education Funding Council for England (.l997) Assigning Departments to Academic Cost Centres: Annexe A.
http://www.niss.ac.uk/education/hefce/pu b97197_25.htm I #anna
Winkworth, l.R. ( 1999) "Performance measurement and
performance indicators" in Jenkins, C. and Morley, M. eds. Colleaion Monogement in Acodemic Librories,2nd ed.
Aldershot: Gower p.7l - 105
t-ibruy & Intbmation Research News il-lRN)