https://doi.org/10.5194/gi-7-11-2018
© Author(s) 2018. This work is distributed under the Creative Commons Attribution 4.0 License.
Multifunction waveform generator for EM receiver testing
Kai Chen, Sheng Jin, and Ming Deng
School of Geophysics and Information Technology, China University of Geosciences, Beijing, China Correspondence:Kai Chen ([email protected])
Received: 29 July 2017 – Discussion started: 22 August 2017
Revised: 7 December 2017 – Accepted: 15 December 2017 – Published: 29 January 2018
Abstract. In many electromagnetic (EM) methods – such as magnetotelluric, spectral-induced polarization (SIP), time-domain-induced polarization (TDIP), and controlled-source audio magnetotelluric (CSAMT) methods – it is important to evaluate and test the EM receivers during their devel-opment stage. To assess the performance of the developed EM receivers, controlled synthetic data that simulate the ob-served signals in different modes are required. In CSAMT and SIP mode testing, the waveform generator should use the GPS time as the reference for repeating schedule. Based on our testing, the frequency range, frequency precision, and time synchronization of the currently available function waveform generators on the market are deficient. This pa-per presents a multifunction waveform generator with three waveforms: (1) a wideband, low-noise electromagnetic field signal to be used for magnetotelluric, audio-magnetotelluric, and long-period magnetotelluric studies; (2) a repeating fre-quency sweep square waveform for CSAMT and SIP studies; and (3) a “positive-zero–negative-zero” signal that contains primary and secondary fields for TDIP studies. In this pa-per, we provide the principles of the above three waveforms along with a hardware design for the generator. Furthermore, testing of the EM receiver was conducted with the waveform generator, and the results of the experiment were compared with those calculated from the simulation and theory in the frequency band of interest.
1 Introduction
Electromagnetic (EM) methods are successfully used in a variety of applications, including metal ore investigations, groundwater explorations, hydrocarbon prospecting, volcano research, and deep-earth research (Wei et al., 2010; Key, 2003). In these applications, EM methods are used to
mea-sure natural- or controlled-source signals and then to inter-pret the underground electrical structure using data process-ing and inversion techniques (Osinowo and Olayinka, 2012; Scheuermann, 2016). There are many EM methods in use to-day; however, in this paper we are interested in magnetotel-luric (MT; Cagniard, 1953), controlled-source audio magne-totelluric (CSAMT; Sandberg and Hohmann, 1982), spectral-induced polarization (SIP; Johnson, 1984), and time-domain-induced polarization (TDIP; Marshall and Madden, 1959) methods. The requirements for field instruments support-ing these methods include high resolution, large exploration depth, low cost, and high-efficiency field data acquisition. All of the above EM methods are dependent on the qual-ity of the field data acquired by the EM instrument. There-fore, the specifications of the EM receiver are of particu-lar importance for high-quality EM prospecting. The current EM receivers – such as the V8 receiver from Phoenix Geo-physics (PhoenixGeoGeo-physics, 2017), GDP32 from Zonge (Zonge, 2017), ADU-07e from Metronix (Metronix, 2017), and KMS-820 from KMS (KMS, 2017) – are all specified as being multifunction, multi-channel, and easy to use with low noise levels and few clock drift errors.
tion waveform generators available on the market, such as the Agilent 33250A, which support multiple broadband wave-forms; however, the frequency precision and time synchro-nization error in these generators are deficient. For example, in the TDIP mode test, the arbitrary waveform function is suitable, but the time synchronization error is deficient.
In this paper, we describe a multifunction waveform gen-erator. The details of the waveform generator, including the system design and the hardware principles, are discussed. Section 2 describes the requirement of the three types of waveforms. Next, we discuss the hardware principle design in Sect. 3. Section 4 describes the test results to confirm the function of the waveform generator. In Sect. 5, the discussion and the specification comparison table are presented.
2 System design
The multifunction waveform generator is designed to output three types of waveforms: white noise for MT (AMT/MT/LMT), a repeated swept square waveform for CSAMT and SIP modes, and a “positive-zero–negative-zero” (PZNZ) waveform for the TDIP mode.
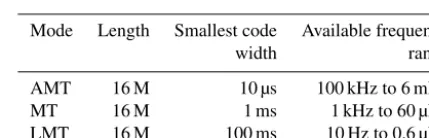
The MT method consists of three branches – AMT, stan-dardized MT, and LMT – and these branches differ in terms of the exploration depths of interest and the effective fre-quency ranges. Figure 1 illustrates the frefre-quency ranges ap-plicable to the three branches of the MT method. The high-frequency band in the AMT method is from 10 kHz to 0.1 Hz, which spans 5 decades; and the frequency band in the stan-dardized MT method is from 320 to 5×10⁻⁴Hz, which spans approximately 6 decades; the frequency band in the LMT method is from 1 to 1×10⁻⁵Hz, which spans ap-proximately 5 decades. A PRBS generator is the best choice for generating broadband signals (Amrani et al., 1998). The highest frequency is determined by the width of the smallest encoding, and the lowest frequency depends on the length of the PRBS. According to the three different frequency band modes, the length of the PRBS must be greater than 1×10⁶. Therefore, we designed a PRBS with length 2N−1, whereN equals 24 and the length is 16 M. By changing the smallest code width of the PRBS, it was easy to meet the three MT modes operating in different frequency ranges.
Mode Length Smallest code Available frequency
width range
AMT 16 M 10 µs 100 kHz to 6 mHz
MT 16 M 1 ms 1 kHz to 60 µHz
LMT 16 M 100 ms 10 Hz to 0.6 µHz
The formal definition of the PRBS is
D=X24+X7+X2+X+1. (1) The length of the sequence is 16 M. The smallest code width, which changes for different fundamental frequencies, can be selected from 10 µs, 1 ms, and 100 ms. Table 1 lists the pa-rameters for the three modes.
The designed frequency range for the CSAMT method is from approximately 0.1 Hz to 10 kHz. The programmable frequency stepping schedule is according to the typical CSAMT frequency stepping schedule used in the field when working with the V8 receiver from Phoenix Geophysics. The frequency stepping schedule contains 41 frequency points and lasts for 50 min. Figure 2 presents the typical frequency stepping schedule plotted on a log scale and two frequency points in a double frequency range as an approximate aver-age on a log scale. The 41 frequency points cover 4 decades and extend from 9600 to 0.9375 Hz. All frequency points are derived from a 12.288 MHz high-stability clock source. To increase the lower-frequency signal-to-noise ratio (SNR), the length of the stacking time of the lower frequencies is longer than that of the higher frequencies. The longest stacking time is 323 s for 1.25 Hz in the low-frequency band, and the short-est is 40 s in the high-frequency band.
Figure 2.Stack time length for a typical CSAMT frequency step-ping schedule.
Figure 3.Stack time length for a typical SIP frequency stepping schedule.
time was used in the lower-frequency band than that used in the higher-frequency band. The longest stack time was 273 s in the low-frequency band at 1.25 Hz, and each point lasted for 50 s in the high-frequency band.
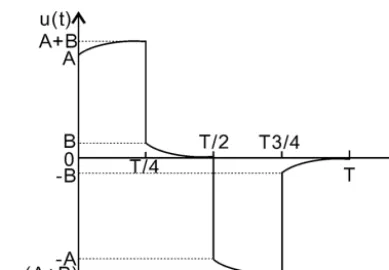
The PZNZ waveform for the TDIP module is shown in Fig. 4 and consists of four phases: positive “on” time, “off” time, negative “on” time, and “off” time. The duty ratio is 1:1. In the figure,T denotes the four-phase period, and the width of the pulse isT /4. The termAdenotes the amplitude of the primary electrical field,B denotes the maximum am-plitude of the secondary electrical field, andA+B denotes the total electrical field. The self-potential and other distur-bances are not considered in the figure.
Figure 4.PZNZ waveform from a theoretical simulation.
Figure 5.Schematic of the PZNZ waveform generator.
u1(t )=
A, 0≤t < T /4 0, T /4≤t < T /2 −A, T /2≤t <3T /4 0,3T /4≤t < T
(2)
u2(t )=
B−Be−t /τ,0≤t < T /4 Be−(t−T4)/τ, T /4≤t < T /2 Be−(t−T2)/τ−B, T /2≤t <3T /4 −Be−(t−34T)/τ, 3T /4≤t < T
(3)
u1(t) andu2(t) denote the primary and secondary electrical fields, respectively, and the exponent attenuation curve refers to the secondary electrical field.
Figure 5 shows a schematic of the circuit used to generate the PZNZ waveform, which contains both primary and sec-ondary electrical fields. The resistor–capacitor (RC) network transforms the PZNZ (Vin)waveform into a PZNZ waveform (Vout)with the secondary electrical field.
A= R3//R2 R1+R3//R2
K (4)
B= R3//R2 R1+R3//R2
K− R2 R1+R2
K (5)
τ=R3C1 (6)
circuit.
3 Hardware principle 3.1 Block diagram
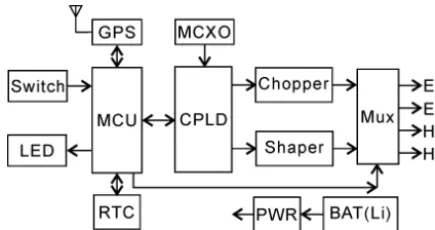
Figure 6 presents a block diagram of the waveform gener-ator, which has the advantages of automation, ease of use, high phase precision, and low power. As shown in the fig-ure, the hardware consists of an input switch, microcontroller unit (MCU), GPS module, complex programmable logic de-vice (CPLD), compensated microprocessor crystal (MCXO), real-time clock (RTC), chopper, shaper, multiplexer, power conversion circuit, and built-in Li-ion battery package. DS3231 from Maxim Integrated is a low-cost, extremely accurate RTC with an integrated temperature-compensated crystal oscillator (TCXO) and crystal. It has the advantages of high integration level, low power, and ease of use. The low-power 8 bit microcontroller MSP430G2553 from Texas Instruments was used as the MCU, and 5M80ZE64 from Altera was used as the CPLD. The input switch is used to change the work mode without configuring the complicated external parameters. The LED is used to indicate the working status. The different work modes output different LED flash patterns. The GPS module is LEA-6T from u-blox, which provides a high-precision time pulse per second with low power consumption. The MCXO has the specifications of high-stability clock source (12.288 MHz;±30 ppb) and low power consumption (3.3 V and 12 mA). To lock the GPS, the MCU receives the time information from the GPS module and writes to the RTC. The CPLD is used to implement a frequency divider, logic operator, the pulse per second (PPS) lock, and tracking. The RTC is the time counter used for circulation of the frequency stepping schedule. The chopper circuit chops a high-precision DC reference into a bipolar square waveform under the control of the CPLD. The shaper generates the TDIP PZNZ waveform. Moreover, the sum of the primary and secondary field signals is also provided as output. The multiplexer is controlled by the MCU to select either the chopper or the shaper output. The power module converts the Li-ion battery (11.1 V and 10 Ahr) voltage to digital power at 3.3 V and analog power at±3 V.
power consumption, the GPS module is powered down dur-ing the MT mode.
When the CSAMT mode is selected, the MCU reads the GPS time information and writes to the RTC. The MCU controls the CPLD divisionde factor according to the fre-quency stepping schedule. The CPLD divides the clock source (12.288 MHz) to the target frequency step by step. The divider is trigged by the PPS from the GPS module. The 41-frequency-point clock signal drives the chopper circuit to generate a bipolar square waveform. All frequency stepping schedules start from the reference time base of 00:00:00 and repeat from high frequency to low frequency. For example, after the power is turned on and the GPS is locked, the current time is 02:20:00, the period of frequency stepping schedule is 50 min, the residual time is 40 min, the first output sig-nal is frequency point no. 40 (1.25 Hz), and the output is the rest 10 min of the current schedule. The frequency stepping schedule is repeated continually.
The procedure in the SIP mode is the same as that de-scribed above for the CSAMT module for the step sched-ule with time synchronization. A typical frequency stepping schedule period is 15 min and contains 12 frequency points.
When the TDIP mode is selected, the RTC time is locked to the GPS module and the CPLD generates a pulse with 2 s width synchronization as the PPS from the GPS module to drive the shaper circuit. The reference time base is 00:00:00, and the typical period is 8 s with a duty ratio of 1:1.
To lock the GPS time to the local RTC, the MCU obtains the time information from the GPS module and writes it to the RTC. In the CSAMT, SIP, and TDIP modes, the MCU must know the current time before it can switch the repeating schedule.
3.2 Clock source
temper-Figure 7.Schematic of the chopper circuit (Echannel).
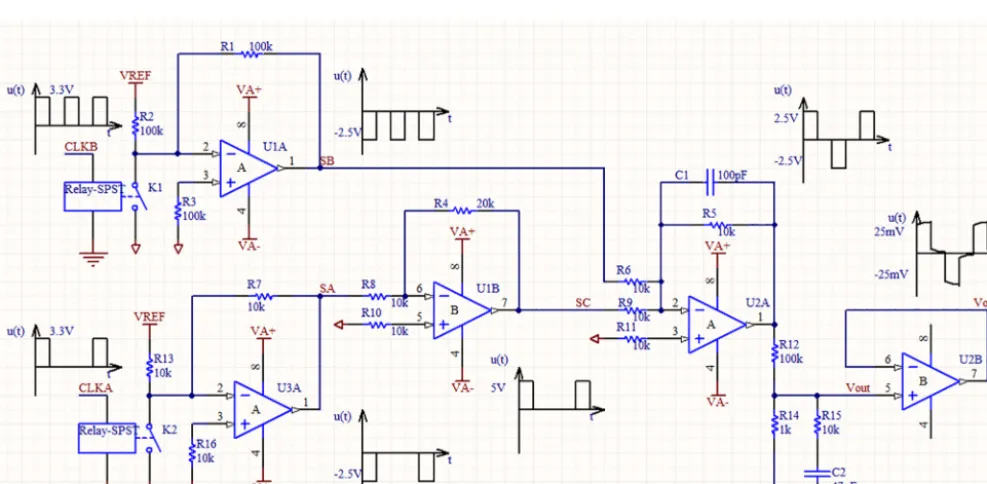
Figure 8.Schematic of the shaper circuit.
ature range of−20 to 75◦C. The power consumption of the module is 12 mA at 3.3 V. For example, to generate the clock (f =9600 Hz) in the CSAMT mode, the MCU sets the divi-sion factor to 1280 and the CPLD divides the clock signal, which is triggered by the PPS from the GPS module. After 50 PPS counts, the MCU sets the division factor to 1600, and the output clock frequency changes to 7680 Hz. The above steps are then repeated, and each division is triggered by the PPS. There is a 1 s pause between each switch divider for
the CPLD to synchronize with the MCU. The CPLD is con-trolled by an MCU with a serial-peripheral interface.
ground. The output from U2 pin1 is a bipolar square wave with an amplitude of 2.5 V. The component U2B is an attenu-ator and low-pass filter, and the output decreases from 5 Vpp to 20 mVpp for the E channel. The bandwidth is limited to 100 kHz. The amplitude of the H channel is 200 mVpp, which is different from the gain of the U2B.
3.4 Shaper circuit
A schematic of the shaper circuit is shown in Fig. 8. The shaper circuit shapes the clock output from the CPLD into a PZNZ waveform. In the shaper circuit, there are two chan-nel clock sources (CLKA and CLKB) and one output (Vout). The CLKA and CLKB outputs are set as different frequen-cies such that the frequency of CLKA is double the frequency of CLKB, and the duty ratio of CLKB is 1:3. The width of each pulse is 2 s. The amplifiers U1A and U3A are both used as chopper circuits, which chop the DC reference to the square waveform. The clock is transformed into a square waveform with an amplitude of 2.5 V. The amplifier U1B is set with a gain of−2. The amplifier U2A adds nodes SB and SC. The waveform at node SD is a bipolar PZNZ waveform. The components R12, R14, R15, and C2 constitute an RC network to generate the PZNZ waveform based on the prin-ciples described earlier. The amplitude at the output of the shaper is approximately 50 mVpp.
4 Test 4.1 MT mode
We used the developed multifunction waveform generator to test our multifunction EM receiver (EMR6). The out-put of the multifunction waveform generator was connected to the input of the EMR6, which works in three sequen-tial modes: 30 min for AMT mode, 24 h for MT mode, and 72 h for LMT mode. All raw data were processed using the white-noise method by the MT data processing software (SSMT2000) from Phoenix Geophysics. The results of the data processing are shown in Fig. 9. The apparent resistivity and impedance phase are present across the entire 9-decade frequency range from 1× 10⁻⁵to 1×10⁴Hz. The theoreti-cal simulation result of the apparent resistivity was 1270m,
Figure 9.Apparent resistivity and impedance phase results from the EMR6 testing.(a)shows the apparent resistivity curves, and (b)shows the impedance phase curves.
Figure 10.Time series in TDIP mode as captured by the EMR6.
and the impedance phase was approximately 0◦. When the experimental results were compared to those from the the-oretical simulation, the bias error between the experiment results and theoretical value for the apparent resistivity was 1.5 %.
The results of the experiment indicated that the multifunc-tion waveform generator could test the MT receiver across the entire MT band, and the EMR6 receiver was shown to have a correct response in the target bands.
4.2 TDIP mode
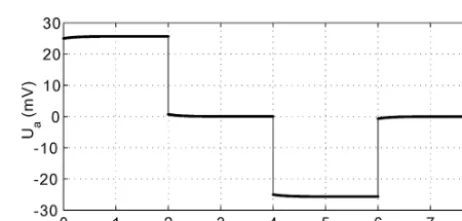
To verify the TDIP waveform, the generator was switched to the TDIP mode and its output was connected to the EMR6 Echannel input; the EMR performs TDIP data acquisition during 2 min at a 2400 Hz sample rate. Figure 10 shows the time series captured by the EMR6. The full waveform was recorded for the entire time series of the E1 channel, in-cluding the primary and secondary field waveforms. The am-plitude was approximately 50 mVpp, and the “on” time and “off” time pulse widths were 2 s.
Table 2.Specification comparison with Agilent 33510B.
Specifications Agilent 33510B Newly developed multifunction
waveform generator
Function Sine, square, ramp, pulse, PRBS, frequency sweep, PZNZ triangle, PRBS, white noise
Channels 2 4 (Ex,Ey,Hx,Hy)
Time sync Internal timer or Ext Trig connector GPS
PRBS 1–50 M bps 10 µHz–100 kHz
Power AC 100–240 V Built-in rechargeable Li-ion battery
Figure 11.Comparison between the calculated results and the the-oretical simulation results for TDIP mode.
window was 10 ms; the width of the windows was 8, 16, 32, 64, 128, 256, 512, 1024, and 2048 sample points. Figure 11 shows a comparison between the measured results and those from the theoretical simulation. The chargeability was dis-tributed from 0.7 to 9 %. The results show that the output from the waveform generator during the experiment response was in good agreement with the theoretical output. The bias error of the nine windows was 0.8 % between the measured results from the experiment and those from the theoretical simulation.
4.3 SIP mode
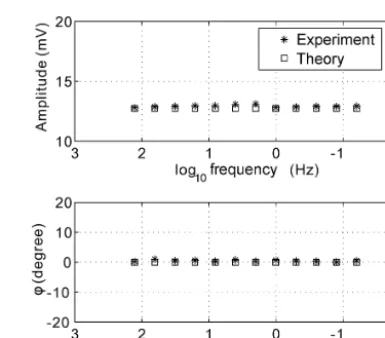
The EMR6 and waveform generator operated in the SIP mode. To simplify the experiment, the current data of the transmitter and a variety of geometric factors were not con-sidered. The EMR6 recorded the frequency-swept square waveform for 15 min and calculated the amplitude of each target frequency. Figure 12 shows the 12 target frequencies from 128 to 0.0625 Hz. The amplitudes measured in the ex-periment were approximately 12.74 mV, and the phases were approximately 0◦. The bias error between the experiment and theory was 0.5 % across the entire frequency range.
Figure 12.Comparison between the experimental results and the theoretical simulation results for the SIP mode.
Figure 13.Comparison between the calculated results and the sim-ulation results for the CSAMT mode.
4.4 CSAMT mode
to meet the testing requirements of the EMR6 receiver. The waveform generator supports a broadband, low-noise PRBS for MT, repeating frequency sweep square waveform for CSAMT and SIP with a programmable frequency step list, and PZNZ waveform containing both primary and secondary fields for the TDIP mode. Moreover, additional requirements for the waveform generator included (1) ease of use, auto-repeat circulation of output according to the scheduled fre-quency step list; (2) high-precision phase and time synchro-nization; and (3) low power consumption for the LMT mode test, which has the capacity of the built in Li-ion battery that allows for 1 week of operation.
Based on the results of the above experiment, Table 2 presents the comparison of the specifications of the de-veloped multifunction waveform generator and the Agilent 33510B function waveform generator. The presented results indicate that Agilent 33510B is not suitable for EM receiver testing. The developed multifunction waveform generator is a better signal source for this purpose.
Total harmonic distortion (THD) is another important fac-tor determining the performance of the EM receiver. We have used a low-distortion signal generator (DS360) from Stan-ford Research Systems as a pure signal source. This function is not contained in the current work, and it may be realized in a future development.
6 Conclusions
The performance of the existing commercial func-tion/arbitrary waveform generator is deficient with regard to time synchronization and waveform requirements. The multifunction waveform generator described in this paper was found to be useful for conducting EM receiver testing for multiple EM methods. The results of the testing show that the multifunction waveform generator could provide three mode signals containing independent broadband signals with different spectral characteristics, white noise, a repeating swept square waveform, and a PZNZ waveform consisting of primary and secondary fields. The apparent resistivity and impedance phase of the broadband white-noise source was very flat across a wide frequency band. The theoretical design of the TDIP waveform was shown to have a correct response. In the SIP and CSAMT modes, the results of the
Author contributions. KC developed the required hardware and software. SJ created the overall design and performed the tests. MD was the chopper and shaper circuit technology consultant.
Competing interests. The authors declare that they have no conflict of interest.
Acknowledgements. General funding was provided by the Na-tional High Technology Research and Development Program of China (2014AA06A603), National Science Foundation of China (61531001), Central University Fundamental Research Project of the Ministry of Education (2652015403), and Key Development Program of China (2016YFC0303100). We are thankful for the data processing software from Phoenix Geophysics. We would also like to thank Editage (www.editage.cn) for their English language editing services.
Edited by: Mark Paton
Reviewed by: Rujun Chen and one anonymous referee
References
Amrani, M. E. H., Dowdeswell, R. M., Payne, P. A., and Persaud, K. C.: Pseudo-random binary sequence interrogation technique for gas sensors, Sensor. Actuat. B-Chem., 47, 118–124, 1998. Cagniard, L.: Basic theory of the magneto-telluric method of
geo-physical prospecting, Geophysics, 18, 605–635, 1953.
Chen, R. J., Yao, H. C., and Liu, S. L.: Automatic testing system of pseudo-random multi-frequency instrument receiver, Ref. No: CN200910044457, Chinese Patent, 2010.
Ge, S. C., Deng, M., Chen, K., and Shi, X. Y.: Broadband signal generator for the approximation of a magnetotelluric source for indoor testing, J. Geophys. Eng., 13, 612–621, 2016.
He, Z. X., Chen, R. J., Liu, X. J. L., and He, L. F.: Magne-totelluric instrument performance evaluation method, Ref. No: CN200910237810, Chinese Patent, 2011.
Johnson, I. M.: Spectral induced polarization parameters as de-termined through time-domain measurements, Geophysics, 49, 1993–2003, 1984.
fast-spreading ridge, PhD thesis, University of California, San Diego, 97–105, 2003.
KMS: KMS-820, http://www.kmstechnologies.com/kms_ company_overview.html, last access: 1 January 2017.
Marshall, D. J. and Madden, T. R.: Induced Polarization, a study of its causes, Geophysics, 24, 790–816, 1959.
Metronix: ADU-07e, http://www.metronix.de/metronix/index.php, last access: 1 January 2017.
Osinowo, O. O. and Olayinka, A. I.: Very low frequency electro-magnetic (VLF-EM) and electrical resistivity (ER) investigation for groundwater potential evaluation in a complex geological ter-rain around the Ijebu-Ode transition zone, southwestern Nigeria, J. Geophys. Eng., 9, 374–396, 2012.
Phoenix Geophysics: V8 receiver, http://www.phoenix-geophysics. com/products/receivers/v8/, last access: 1 January 2017.
Sandberg, S. K. and Hohmann, G. W.: Controlled-source audiomag-netotellurics in geothermal exploration, Geophysics 47, 100– 116, 1982.
Scheuermann, A.: Electric and electromagnetic measurement meth-ods in civil and environmental engineering, J. Geophys. Eng., 13, E1–E2, 2016.
Wei, W., Jin, S., Ye, G., Deng, M., Jing, J., Unsworth, M., and Jones, A. G.: Conductivity structure and rheological property of litho-sphere in Southern Tibet inferred from super-broadband magne-totelluric sounding, Sci. China Earth Sci., 53, 189–202, 2010. Zonge: GDP32, http://zonge.com/instruments-home/instruments/