Http://www.ijetmr.com©International Journal of Engineering Technologies and Management Research [39]
GENDER GAP INDEX FOR EMPLOYMENT OPPORTUNITY
Shweta Tewari1, Rajshree Chouhan2, Sanjeev3 1
GGIC Noorpur Ghaziabad, 2Bhupal Nobals’ University 3
Canara Bank New Delhi
Abstract:
Women account for nearly half of the human resources of a nation and play an important role in the socio-economic development of a country. In India, in spite of focus on women empowerment, condition of women at the work place is not very encouraging. Women often face greater barriers than men in terms of securing a decent jobs, wages and conducive working conditions. Provisions relating to women’s work were introduced in 1891, with amendment of the Factories Act, 1881. After independence, number of provisions has been made in the constitutions to protect the welfare of women workers. Number of protective legislations have also been made and implemented by the government for the interest of women workers. The basic objective behind implementation of these legislation are to provide equal and a decent level of remuneration, proper child care center , maternity relief and decent working conditions to women workers. Despite these constitutional and legislative arrangements to reduce gender gap, women in India are facing discrimination at work place and suffer from harassment. The present paper critically reviewed the effectiveness of government policies and legislations framed and enacted for the welfare of women workers. It also examines the gender dimensions of the trends in various aspects of labour market viz. labour force participation rate, workforce participation rate, unemployment rate and wage rate. An attempt has been made to capture the discrimination at work by computing Gender Gap Index using major indicators of labour market. For computing the index, data for the last four decades has been used. The analysis shows that there are gaps in effective enforcement of relevant laws and implementation of women responsive policies. The gender gap index for employment opportunities and the analysis of major employment indicators showed that gender gap is increasing in many aspects. Major indicators of employment such as Labour Force participation rate, Worker population ratio, Unemployment rate and wages now have larger gender gaps than before.
Keywords: Gender Gap Index, Wage Rate; Labour Force Participation Rate; Labour Market; Unorganized Sector; Unemployment Rate.
DOI: 10.5281/zenodo.1019445
Http://www.ijetmr.com©International Journal of Engineering Technologies and Management Research [40]
Introduction 1.
The gender gap is most obvious in the labour market, where women often face greater barriers than men in terms of securing a decent jobs, wages and conducive working conditions. In India, inspite of focus on women empowerment, condition of women at the work place is not very encouraging. Despite several constitutional and legislative arrangements to reduce gender gap, women in India are facing discrimination at work place and suffer from harassment. A recent study report by World Economic Forum titled Global Gender Gap Report, 2010 calculated the Gender Gap Index for 134 countries. India ranks 112 among these countries with index value of 0.615. India is the lowest ranked country among the BRIC economies. In terms of sub-indices India’s performance is above average only on the political empowerment of women, but lag far behind in terms of other indices. In the category of economic participation and opportunities index, India ranks amongst the lowest with ranking of 128 and index value of 0.403. The gap in the labour market is not only in terms of quantity but also quality as most of the females in the country is working in informal sector with harsh working conditions and without any social safety nets.
The present paper examines the gender dimensions of the trends in various aspects of labour market viz. labour force participation rate, workforce participation rate, unemployment rate and wage rate. It also critically examined the effectiveness of government policies and legislations framed and enacted for the welfare of women workers. An attempt has been made to capture the discrimination at work by computing Gender Gap Index using major indicators of labour market. For computing the index, data for the last four decades has been used.
2. Review of Government Policies
Women constitute an important part of the labour force in India. Therefore, the problems related with the welfare of women workers have received considerable attention by the policy makers in the country. In India provisions relating to women’s work were introduced in 1891, with amendment of the Factories Act, 1881. After independence, number of provisions has been made in the constitutions to protect the welfare of women workers. The Preamble of the constitution itself asserts to secure to its entire citizen “Equality of status and opportunity”. The Constitution of India provided its citizen the right to equality (Article 14 to 18) as one of the funda mental rights. Article 14 of the Constitution ensures equality before law and equal protection of law. Article 15 prohibits any kind of discrimination on the basis of religion, race, caste, sex or place of birth. Article 15 (3) directs state for making special provision for women and children. Article 16 provides equality of opportunity for all citizens in matters relating to public sector employment. Apart from the fundamental right to equality, several directions have been made to the State under the Directive Principle of State Policy. Article 39 (a) mentions that the State will direct its policies towards securing that the citizens, men and women equally, have the right to an adequate means to livelihood and Article 39 (d) direct towards equal pay for equal work. Article 42 directs state for providing a decent working condition and maternity relief.
DOI: 10.5281/zenodo.1019445
Http://www.ijetmr.com©International Journal of Engineering Technologies and Management Research [41] equal and a decent level of remuneration, (ii) Provision for child care center , (iii) Providing maternity relief to women workers, (iv) providing decent working conditions. The present section will discuss some of the legislations ensuring these rights and their effectiveness in solving these issues.
There are number of provisions to regulate safe and decent working conditions. But, these provisions are mainly enforced in the organized sector which engages only ten per cent of the labour force. The rest of the 90 per cent of the labour force in the country are without any legal protection and social safety nets. According to the report on unorganized sector, most of these workers in unorganized sector work in very poor and unhygienic physical conditions. Many of them work in hazardous conditions and have no adequate safeguards or first aid facilities at the work place. About 23.12 per cent of adult men and 39.24 per cent adult women were putting in above 48 hours of work per week (Statistics of Factories).
It emerges from the policy review that in spite of constitutional and legislative provisions, women in India continue to suffer from number of deprivations and discrimination at workplace particularly in the unorganized sector which provides employment to 94 per cent of the total workforce.
3. Women at Work: The Trend
In Indian labour market, the share of female workers is persistently low due to various reasons like culture, tradition and skill set. An analysis of employment indicators for women worker over the last four decades indicates that there is inconsistency in pattern of employment among women. The absolute number of women workers have increased because of population increase but the percentage of female labour has declined over the years. Labour force participation rate (LFPR) for women in rural areas has declined from 34.2 per cent in 1983 to 26.6 per cent in the year 2009-2010. In urban areas, decline in LFPR is marginal during the same period. LFPR was 15.9 per cent in the year 1983 which increased to 16.5 per cent in 1993-1994 which further increased to 17.8 per cent in 2004-2005. But, it declined by 3.2 percentage points to 14.6 per cent in the year 2009-2010. It appears that this trend is influenced by the level of education and family background. As there is increase in interest among women towards availing better and higher education, their entry into the labour market is delayed. The family background plays a dominant role in determining the employment status of women. Rising income levels of a household have an adverse impact on participation of women in the labour force (Das and Desai, 2003).Woman’s participation in employment outside the home is viewed as inappropriate, subtly wrong, and definitely dangerous to their chastity and womanly virtue. When a family recovers from an economic crisis or attempts to improve its status, women may be kept at home as a demonstration of the family’s morality and as a symbol of its financial security.
DOI: 10.5281/zenodo.1019445
Http://www.ijetmr.com©International Journal of Engineering Technologies and Management Research [42] unemployment rate increased from 0.7 per cent in 1983 to 1.6 per cent in 2009-2010 whereas urban unemployment rate increased from 4.9 per cent in 1983 to 5.7 per cent in 2009-2010 (Table 1).
Table 1: Employment Indicators for Female Workers, 1983 to 2009-2010
Years LFPR WPR Unemployment Rate
Rural Urban Rural Urban Rural Urban
1983 34.2 15.9 34.0 15.1 0.7 4.9
1987-1988 33.1 16.2 32.3 15.2 2.4 6.2
1993-1994 33.0 16.5 32.8 15.5 0.9 6.1
1999-2000 30.2 14.7 29.9 13.9 1.0 5.7
2004-2005 33.3 17.8 32.7 16.6 1.8 6.9
2009-2010 26.5 14.6 26.1 13.8 1.6 5.7
Source: Employment and Unemployment Reports, Various Rounds, NSSO
4. Sector-Wise Employment
Sector-wise analysis of employment data indicates transformational changes in employment and stages of development in the labour market. In a growing economy, in general, labour shifts from agriculture and other labour-intensive primary activities to manufacturing and finally to the services sector. Globally, share of agriculture employment has been declining while that of services has been increasing. Indian labour market is also experiencing the same trend. However, in case of rural female workers in India, primary sector still engage largest share of its population. Percentage share of female workers in rural areas was 81.4 per cent during 1990 and 87.1 per cent during 1995 which has declined substantially to 79.3 per cent during 2010. On the other hand, for urban female workers employment share in agriculture has declined sharply by around ten percentage point during the same period from 24.1 per cent in 1990 to 13.9 per cent in 2010. The number of workers in agriculture actually grew over the past decade, but percentage share of women workers in agriculture has declined due to relatively faster employment gr owth in non-agriculture sector. The share of industrial employment has been increasing at marginal pace for both rural and urban areas. Increase in employment in the services sector is particularly visible in urban areas, accounting for 52.8 per cent of all female employment during the year 2010 (Table 2).
Table 2: Percentage Share of Female Workers across Three Industrial Sector
Year RURAL
Primary Secondary Tertiary
1990 81.4 12.4 6.1
1995 87.1 8.3 4.6
2000 85.4 8.9 5.7
2005 83.3 10.2 6.6
2010 79.3 13.0 7.6
URBAN
1990 24.1 30.3 45.6
DOI: 10.5281/zenodo.1019445
Http://www.ijetmr.com©International Journal of Engineering Technologies and Management Research [43]
2000 17.7 29.3 52.9
2005 18.1 32.4 49.5
2010 13.9 33.3 52.8
Source: Employment and Unemployment Reports, Various Rounds, NSSO
Employment Status of Female Workers
5.
Employment status describes socio-economic conditions of workers. Advanced economies normally have high proportion of regular/ salaried workers. A larger share of self-employed and casual workers indicates large agriculture sector and low growth in the formal economy. The study of status of employment over the last four decades shows that percentage of self-employed female workers is very high as compared to casual and regular workers. More than 50 per cent of female workers are self-employed earning very low income. During 1972-73, 63 per cent of the female workers were self-employed, which decreased to 53.3 per cent in the years 2009-2010. In rural areas, 55.7 per cent of females are self-employed whereas in urban areas, 41.1 per cent are self-employed during 2009-2010. Percentage of female workers employed as casual labour was found to be 30.7 per cent during 1972-73 which increased marginally to 36.6 per cent during 2009-2010 i.e. merely six per cent increase during the last forty years of time. In case of regular female employees the increase is abysmally low, only four per cent during the same period. It is clearly evident that increase in female employment is mostly in the self-employed category which is normally considered as most volatile and low earning sector, indicating high level of vulnerability of female workers. The low growth of employment in the regular/ salaried class is mainly due to relatively lower supply of organized sector jobs for females (Table 3).
Table 3: Percentage Distribution of Female Employment (UPSS) by Status
Year Self-Employed Regular/ Salaried Casual Labour
Rural Urban Total Rural Urban Total Rural Urban Total
1972-1973 64.5 48.4 63.0 4.1 27.9 6.3 31.4 23.7 30.7
1977-1978 62.1 49.5 60.7 2.8 24.9 5.3 35.1 25.6 34.0
1983 61.9 45.8 60.0 2.8 25.8 5.6 35.3 28.4 34.4
1987-1988 60.8 47.1 58.9 3.7 27.5 6.9 35.5 25.4 34.2
1993-1994 58.5 45.4 56.7 2.8 28.6 6.3 38.7 26.2 37.0
1999-2000 57.3 45.3 55.6 3.1 33.3 7.3 39.6 21.4 37.1
2004-2005 63.7 47.7 61.0 3.7 35.6 9.0 32.6 16.7 30.0
2009-2010 55.7 41.1 53.3 4.4 39.3 10.1 39.9 19.6 36.6
Source: Employment and Unemployment Reports, Various Rounds, NSSO
6. Gender Gap Index for Employment
DOI: 10.5281/zenodo.1019445
Http://www.ijetmr.com©International Journal of Engineering Technologies and Management Research [44] somewhat inconsistent pattern. During this period of their life-cycle, women tend to leave the labour force to give birth to and raise children, then they return to economically active life when children are older but at a low wage rate.
The gender gap index calculated for four major employment indictors shows that rural index declined from 0.74 in the year 1993-94 to 0.61 in 2009-2010. The index calculated for urban areas also exhibit the declining trend. It declined from 0.47 in 1993-94 to 0.42 in 2009-2010 (Table 4). The analysis of index shows that the gap is increasing over the years in both rural and urban areas and it is more apparent in urban areas. Inequality exists across all indicators with varying degree. It is clear from table that there is high level of inequality in case of LFPR and WPR. Urban area shows higher level of inequality than rural areas. Late entry of women into labour force in urban areas due to continuing education can be cited as one of the main reasons behind high inequality in urban areas. The gender gap in unemployment has increased over the years. Discrimination in wage rates in both rural and urban areas remained high over the years. In spite of all efforts to remove the wage differences between male and female, there is negligible improvement in this direction.
Table 4: Gender Gap Index for Employment Indicators - Rural and Urban
Particulars Rural Urban
1993-94 1999-00 2004-05 2009-10 1993-94 1999-00 2004-05 2009-10
LFPR sub index 0.49 0.48 0.51 0.41 0.27 0.25 0.28 0.24
WPR sub index 0.49 0.48 0.50 0.41 0.26 0.24 0.27 0.24
UR sub index 1.29 1.30 0.85 0.86 0.66 0.75 0.56 0.50
Wage sub index 0.67 0.78 0.66 0.74 0.68 0.72 0.67 0.70
Gender Gap Index for Employment Indicators
0.74 0.76 0.63 0.61 0.47 0.49 0.45 0.42
Source: Author's calculation from Various Rounds, NSSO, MOSPI, Govt. of India
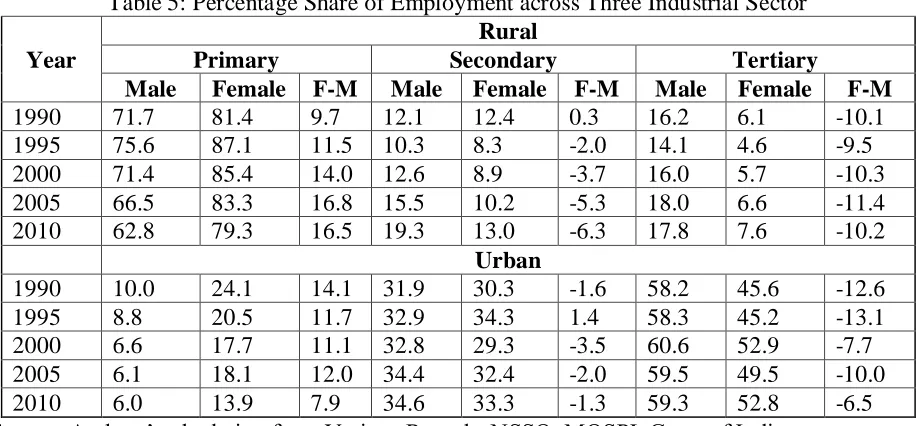
7. Gap Across Broad Industry Group
DOI: 10.5281/zenodo.1019445
Http://www.ijetmr.com©International Journal of Engineering Technologies and Management Research [45] Table 5: Percentage Share of Employment across Three Industrial Sector
Year
Rural
Primary Secondary Tertiary
Male Female F-M Male Female F-M Male Female F-M
1990 71.7 81.4 9.7 12.1 12.4 0.3 16.2 6.1 -10.1
1995 75.6 87.1 11.5 10.3 8.3 -2.0 14.1 4.6 -9.5
2000 71.4 85.4 14.0 12.6 8.9 -3.7 16.0 5.7 -10.3
2005 66.5 83.3 16.8 15.5 10.2 -5.3 18.0 6.6 -11.4
2010 62.8 79.3 16.5 19.3 13.0 -6.3 17.8 7.6 -10.2
Urban
1990 10.0 24.1 14.1 31.9 30.3 -1.6 58.2 45.6 -12.6
1995 8.8 20.5 11.7 32.9 34.3 1.4 58.3 45.2 -13.1
2000 6.6 17.7 11.1 32.8 29.3 -3.5 60.6 52.9 -7.7
2005 6.1 18.1 12.0 34.4 32.4 -2.0 59.5 49.5 -10.0
2010 6.0 13.9 7.9 34.6 33.3 -1.3 59.3 52.8 -6.5
Source: Authors’ calculation from Various Rounds, NSSO, MOSPI, Govt. of India
8. Gap in Status of Employment
The pattern of changes in the status of employment in the last four decades has not shown any major difference between men and women. More than 50 per cent of both male and female workers are still self-employed. Analysis of trend during the period shows that regular/ salaried employment is much higher for male than female. During 2009-10, 17.7 per cent of male workers are in regular employment, as against only 10.1 per cent of female workers. The situation is worse in case of rural females where only 4.4 per cent of women are in regular employment. However, overall regular employment for male has shrunk from 19.7 per cent to 17.7 per cent and has increased for females from 6.3 per cent to 10.1 percent during the period. The increase in regular employment may be due to relatively lower wages for females than males. The trends show distinct signs in case of casual labourers. Casual workers form a large proportion of women workforce as compared to their male counterparts. During 1972-73, 19.7 percent of male and 30.7 percent of females are casual labour. This has increased to 32.2 percent and 36.6 percent for males and females respectively during 2009-10 (Table 6).
Table 6: Sex-wise Status of Employment
Years Self-Employed Regular Employee Casual Labour
Male Female Male Female Male Female
1972-1973 60.6 63.0 19.7 6.3 19.7 30.7
1977-1978 58.0 60.7 18.3 5.3 23.7 34.0
1983 55.9 60.0 18.2 5.6 25.9 34.4
1987-1988 54.3 58.9 18.6 6.9 27.1 34.2
1993-1994 52.9 56.7 17.0 6.3 30.1 37.0
1999-2000 52.8 55.6 14.0 7.3 33.2 37.1
2004-2005 54.2 61.0 18.3 9.0 27.5 30.0
2009-2010 50.0 53.3 17.7 10.1 32.2 36.6
DOI: 10.5281/zenodo.1019445
Http://www.ijetmr.com©International Journal of Engineering Technologies and Management Research [46]
9. Discrimination in Wages
Wages are the main part of total income of a worker, which represents their economic status and over all well-being. There is wide spread disparity in wage rates across different sections of the society. The situation is worse in case of women workers. There is discrimination in wages among female and male workers. The differences in wages are particularly high in rural areas as compared to urban areas. The lack of bargaining power and lack of sufficient skill are the main factors which influence the differences in the wage rate. Moreover, women workers are concentrated in certain occupations only. Indeed more than 60 per cent of females are employed in agriculture and allied activities. Occupations which are dominated by female employees are often poorly paid. Another reason for wage discrimination is less mobility of women workers in the labour market. Women also want to spend less time in commuting than men. Therefore, they have relatively smaller pool of jobs to choose from, which may result in lower equilibrium wages for those jobs. An analysis of wage rates over the last twenty years support the above assertion. In rural areas, women workers are receiving only about 60 per cent of the male’s wages. In urban areas, situation is relatively better than in rural areas, where women workers are getting about 80 per cent of male’s wages. Discrimination in wages has remained same the last two decades for both rural and urban areas (Table 7).
Table 7: Average wage/salary received per day by regular wage/salaried employees of age 15-59 years by sex (in Rs.)
Year Rural Urban
Female Male F/M Female Male F/M
1993-94 34.89 58.48 0.60 62.31 78.12 0.80
1999-00 114.01 127.32 0.90 140.26 169.71 0.83
2004-05 85.53 144.93 0.59 153.19 203.28 0.75
2009-10* 155.87 249.15 0.63 308.79 377.16 0.82
Source: Author's calculation from Various Rounds, NSSO, MOSPI, Govt. of India
DOI: 10.5281/zenodo.1019445
Http://www.ijetmr.com©International Journal of Engineering Technologies and Management Research [47] Table 8: Gap (F/M) in the average salary received per day by regular wage/salaried employees of
age 15-59 years by broad educational level
Education level 2004-05 2009-10
Rural Urban Rural Urban
Not literate 0.49 0.54 0.48 0.59
Literate up to Middle 0.48 0.58 0.50 0.62
Secondary & Higher Secondary 0.63 0.82 0.57 0.81
Diploma/ Certificate 0.93 0.86 0.82 0.77
Graduate and above 0.64 0.73 0.71 0.79
All 0.59 0.75 0.63 0.82
Source: Author's calculation from Various Rounds, NSSO, MOSPI, Govt. of India
Apart from status of employment and education level, wage rate vary with the kind of occupation across different industries. The wage rate prevalent in various sectors can provide information on the gender discrimination depending on the occupation across industries. Liberalization policy followed by the Indian government has affected the growth of different industries in the country. With less government regulation and increased competition, employment and pay pattern has changed tremendously in recent years. There is huge variation in the wage rate across industries. In order to compete with other companies in the open economy, companies have resorted to differential wage rate based upon education and skill set. This trend has adverse effect on the women workers and their wage. The industries involving higher level of physical and manual works started discrimination against women in terms of both work availability and wages. Female wages are half of the male wages in mining & quarrying and manufacturing sector in both rural and urban areas. This is mainly due to involvement of strenuous and physical work in these sectors. In rural areas, in mining and quarrying activities, female wage is only 34 per cent of male’s wages. One disturbing trend is that the wage inequality is increasing over the period in almost all occupational categories (Table 9).
Table 9: Gap (F/M) in the Average wage/ salary received per day by regular wage/ salaried employees of age 15-59 years by industry of origin (in Rs.)
Industry Division Rural Urban
1993-94 1999-00 2004-05 1993-94 1999-00 2004-05
Agriculture 0.83 0.7 0.77 0.91 0.42 0.76
Mining and Quarrying 0.54 0.31 0.34 0.68 0.58 0.52
Manufacturing 0.43 0.39 0.42 0.53 0.53 0.58
Manufacturing 0.58 0.5 0.39 0.75 0.74 0.54
Electricity Gas & Water 0.8 1.12 1.03 0.89 0.85 0.69
Construction 1.1 1.06 0.85 0.54 1.05 1.12
Trade 0.97 0.92 0.68 0.99 1.33 1.01
Transport and Storage etc. 0.79 0.81 1.07 1.04 1.19 1.34
Services 0.72 0.58 0.72 0.84 1.04 0.84
All 0.6 0.9 0.59 0.8 0.82 0.75
DOI: 10.5281/zenodo.1019445
Http://www.ijetmr.com©International Journal of Engineering Technologies and Management Research [48]
10. Conclusion
It emerges from above analysis that there are gaps in effective enforcement of relevant laws and implementation of women responsive policies. The gender gap index for employment opportunities and the analysis of major employment indicators showed that gender gap is increasing in many aspects. Major indicators of employment such as Labour Force participation rate, Worker population ratio, Unemployment rate and wages now have larger gender gaps than before. There is increase in the informalisation of women labour making it difficult to do effective tracking. This is further aggravated as large number of women is working in agriculture sector either in their own farm or on contract under harsh conditions with very low remuneration and without any organized institutional support. The increasing disparity in the labour market confirms the need for and importance of an enabling environment that combines anti -discrimination laws with supportive equality institutions and coherent policy packages promoting equality at the workplace and beyond (ILO, 2007). The challenge before the policy makers in India is to ensure that a sizeable portion of its workforce gets its due under law and decent employment. Improvement in the labour market policies and legislative framework, effective monitoring and stricter enforcement of laws is crucial for reducing inequality. Labour inspection system needs to be strengthened to check the enterprises’ compliance to existing laws and regulations. Furthermore, it is the need of hour to promote equal opportunities for girls and women to access quality education and training. This would facilitate effective absorption of women in labour market with decent working conditions, narrowing down the gender gap and make women equal partner in growth.
References
[1] Anand S, Sen A. (1995): ‘Gender inequity in human Development: Theories and Measurement’, Occcasional Paper 19 (paper prepared for the Human Development Report 1995) New York: United Nations Development Programme.
[2] Black, Sandra, and Elizabeth Brainerd (2004): ‘Importing Equality? The Impact of Globalization on Gender Discrimination,’ Industrial and Labor Relations Review 57 (4): 540-59.
[3] Deshpande, S. and L. K. Deshpande, (1993): ‘Gender-Based Discrimination in the Urban Labour Market’, ch. 10 in (Papola and Sharma, 1993).
[4] Jacob, P. (2001): ‘Magnitude of the Women Work Force in India: An Appraisal of the NSS Estimates and Methods.’ Sarvekshana XXIV, No. 4.
[5] Khandker, Shahidur R. (1989): ‘Improving Rural Wages in India’, Working Paper, Population and Human Resource Department, World Bank.
[6] Menon, N., Rodgers, Y. M. (2008): ‘International Trade and the Gender Wage Gap: New Evidence from India’s Manufacturing Sector’, Brandeis University, US.
[7] Ministry of Statistics and Programme Implementation, National Sample Survey Organisation (Various Rounds), Employment and Unemployment Survey Reports, 1983, 1987-88, 1993-94, 1999-00, 2004-05 & 2009-10.
[8] Mukhopadhyay, S.and Tendulkar, S. (2008): ‘Gender Differences in Labour Force Participation in India: An Analysis of NSS data’, Institute of Social Studies Trust, Delhi.
*Corresponding author.