SRef-ID: 1432-0576/ag/2005-23-1473 © European Geosciences Union 2005
Annales
Geophysicae
A Monte Carlo model of auroral hydrogen emission line profiles
J.-C. G´erard1, V. I. Shematovich2, D. V. Bisikalo2, and D. Lummerzheim3
1Laboratoire de Physique Atmosph´erique et Plan´etaire, Universit´e de Li`ege, Li`ege, Belgium 2Institute of Astronomy RAS, Moscow, Russian Federation
3Geophysical Institute, University of Alaska, Fairbanks, Alaska, USA
Received: 25 October 2004 – Revised: 22 March 2005 – Accepted: 31 March 2005 – Published: 3 June 2005
Abstract. Hydrogen line profiles measured from space-borne or ground-based instruments provide useful informa-tion to study the physical processes occurring in the proton aurora and to estimate the proton flux characteristics. The line shape of the hydrogen lines is determined by the ve-locity distribution of H atoms along the line-of-sight of the instrument. Calculations of line profiles of auroral hydro-gen emissions were obtained using a Monte Carlo kinetic model of proton precipitation into the auroral atmosphere. In this model both processes of energy degradation and scat-tering angle redistribution in momentum and charge transfer collisions of the high-energy proton/hydrogen flux with the ambient atmospheric gas are considered at the microphysical level. The model is based on measured cross sections and scattering angle distributions and on a stochastic interpreta-tion of such collisions. Calculainterpreta-tions show that collisional angular redistribution of the precipitating proton/hydrogen beam is the dominant process leading to the formation of extended wings and peak shifts in the hydrogen line pro-files. All simulations produce a peak shift from the rest line wavelength decreasing with increasing proton energy. These model predictions are confirmed by analysis of ground-based H-β line observations from Poker Flat, showing an anti-correlation between the magnitude of the peak shift and the extent of the blue wing of the line. Our results also strongly suggest that the relative extension of the blue and red wings provides a much better indicator of the auroral proton char-acteristic energy than the position of the peak wavelength.
Keywords. Atmospheric composition and structure (Air-glow and aurora) – Ionosphere (Particle precipitation) – Space plasma physics (Kinetic theory)
1 Introduction
The presence of proton precipitation in the auroral re-gions was first inferred from ground-based observations of Doppler-shifted emissions of the hydrogen Balmer series
Correspondence to: J.-C. G´erard
(jc.gerard@ulg.ac.be)
(Vegard, 1939). Proton precipitation is usually not a major source of auroral particle energy input compared with elec-tron precipitation. However, there are a variety of magne-tospheric mechanisms that eventually lead to precipitation of protons into the atmosphere, producing auroral hydrogen emission features. Energetic protons originating from the ring current, radiation belts, and the plasma sheet precipitate into the upper atmosphere with some distribution in pitch an-gle and energy. The incident protons undergo collisions and experience charge exchange reactions with atmospheric con-stituents. After capturing an electron in a charge exchange interaction, a precipitating proton moves as an energetic hy-drogen atom that preserves the speed and direction of the original proton. If the hydrogen atom is in an electronically excited state, de-excitation may occur through photon emis-sion. The observed line profiles are formed as a result of integration of the contributions of all emitting-atom velocity vectors projected on the line-of-sight. These emissions will be red (blue)-shifted as the H atom moves from (toward) the observer. Spectroscopic measurement of these Doppler shifts therefore provides a means of inferring precipitating proton energies. Satellite and rocket-borne instruments yield in-situ measurements of the local fluxes and energy spectra of the energetic neutral and charged particles. As the beam of pro-tons penetrates into the thermosphere, it eventually turns into a mixture of energetic protons and hydrogen atoms. There-fore, the proton aurora is spread out into a diffuse glow, as neutral hydrogen atoms can move across magnetic field lines. Hydrogen emissions originate exclusively from proton pre-cipitation, since the density of ambient hydrogen in the ther-mosphere is negligibly small. Hydrogen line profiles mea-sured from space-borne or ground-based instruments provide information needed for detailed studies of the physical pro-cesses that protons undergo as they penetrate into the atmo-sphere. So far, the wavelength shift of the peak emission of hydrogen lines observed along the magnetic field lines has been frequently used as an indicator of the initial energy of the proton precipitation. It was generally assumed that large Doppler shifts from a rest wavelength are associated with en-ergetic proton precipitation.
and scattering angle redistribution in all possible elastic, in-elastic, ionization and charge transfer collisions with atmo-spheric constituents. Energy losses of the downward going H+/H flux are determined by the momentum transfer to the target atmospheric particles – O2, N2, and O in collisions, and by the energies associated with internal and chemical excitation of the ambient gas. The efficiencies (frequencies) of these collisional processes are directly dependent on the cross sections of the corresponding processes. Angular re-distribution of the precipitating protons takes place at the al-titudes of the lower thermosphere, where collision frequen-cies with the atmospheric gas become relatively high. In the region located below 200 km, where most hydrogen emis-sions originate, the mean free path of protons and energetic H atoms varies from several centimetres to several kilometres. Therefore, although the angular redistribution undergone by an energetic particle through a collision with a neutral atmo-spheric species is rather small, often less than 1◦(Cisneros
et al., 1976; Van Zyl et al., 1978; Johnson et al., 1988; Gao et al., 1990), the variation of the pitch angle of this particle through the multiple collisions at low altitude can be signif-icant. In a low-energy H+/H beam (which makes the main contribution to the emissions), the elastic momentum trans-fer collisions become dominant. The losses of energy in col-lisions are proportional to the sine of the scattering angle. This implies that both collisional angular redistribution and the energy degradation rate (i.e. the lifetime of the energetic particles in the simulated domain or, in other words, the total number of collisions exciting emissions) are functions of the scattering angle. Consequently, the accuracy of the simula-tion of the scattering angle in the model is a key parameter for low-energy atoms and for the determination of hydrogen line profiles. Proton aurora hydrogen emissions and their line profiles provide an opportunity to estimate the characteristics of the precipitating proton flux. The H-β line at 486.1 nm is frequently observed with ground-based instruments since its spectral region is fairly free from contamination by auroral and airglow emissions (see, e.g. Lummerzheim and Galand, 2001). The Ly-αauroral line profile near 121.6 nm has been measured from space (Chua et al., 2003). Modeling the line shape and the brightness of the hydrogen lines requires the knowledge of the velocity distribution of H atoms in the col-umn observed by the instrument.
Several models developed to calculate the proton energy degradation and the associated emission rates have also been applied to the calculation of the H emission line profiles (Rees, 1982; Galand et al., 1998; Lorentzen et al., 1998; G´erard et al., 2000; Lummerzheim and Galand, 2001). Lin-earised Boltzmann equations were generally used for the de-scription of the gas flow in this region. These approaches can be generally categorized as (Decker et al., 1996): i) con-tinuous slowing-down approximation (Rees, 1982; Galand et al., 1997); ii) linear transport theory (Basu et al., 1987); iii) Monte-Carlo test particle method (Kozelov and Ivanov, 1992; Synnes et al., 1998). These numerical methods allow the evaluation of several effects induced by proton precip-itation (escape fluxes, heating rate of the atmospheric gas,
optical emission rates, etc.). However, for the specific prob-lem of the calculation of synthetic hydrogen line profiles in the proton aurora, a more sophisticated model must be used. Indeed, to accurately model hydrogen line profiles it is nec-essary to take into account the stochastic nature of collisional scattering. This is especially important for high-energy pro-tons (or H atoms) that collide with the target particle and change their direction following a probabilistic distribution of the scattering angle (Smith et al., 1991). This aspect was not completely included in previous models (except Galand et al., 1998) but it was the most important feature of the ki-netic model described by G´erard et al. (2000). A second important feature of this model is the use of updated cross sections and scattering angles based on experimental data. A third characteristic is the self-consistency of the model, as we simultaneously consider all sources (collisional, geometrical, and magnetic mirroring) of spreading of the incident beam.
In this study we calculate and analyse the hydrogen line profiles formed by auroral proton precipitation, using the Monte Carlo kinetic model. In Sect. 2, the physical pro-cesses leading to the excitation of hydrogen emissions and inputs from atomic physics needed to calculate these lines are discussed. The details of the Monte Carlo kinetic model used to calculate hydrogen line profiles are given in Sect. 3. In the next section, the results of the calculations are ana-lyzed and discussed. Ground-based observations of the hy-drogen Balmer-βline profile performed in Alaska are shown to be consistent with our conclusion that collisional angular redistribution causes the shift in the peak of the H line profile to decrease with increasing initial energy of the precipitated protons.
2 Processes of hydrogen emission excitation in the up-per atmosphere
Interactions of precipitating energetic protons of magneto-spheric origin with the atmomagneto-spheric constituents include mo-mentum and energy transfer in elastic and inelastic col-lisions, ionization of target atmospheric molecules/atoms, charge transfer, and electron capture collisions. The ener-getic H atoms produced by proton impact further interact with the main constituents of the atmosphere, transferring their momentum and kinetic energy by elastic and inelastic collisions, ionization and stripping processes. These colli-sional processes of penetration of the energetic H+/H beam into the ambient atmosphere can be written as:
H+f(Hf)+M→
H+f0(Hf0)+M∗ H+f0(Hf0)+M∗+e Hf0 +(H+
f0)+M+(M∗+e) ,
where M denotes one of the atmospheric constituents – O2, N2, or O. The secondary fast Hf atoms and H+f protons
producing a growing set of translationally and internally ex-cited particles of the ambient atmospheric gas. These colli-sional processes are accompanied by excitation of hydrogen emissions:
– simultaneous charge-exchange and excitation
H++M→H(n)+M+,
where M is an atmospheric atom/molecule, and H(n) the hydrogen atom inn-th excited level;
– direct excitation from ground state in momentum trans-fer collisions with atmospheric species
H(1)+M→H(n)+M.
The emission cross sections for Ly-α, H-α, and H-β lines excited in the collisions of low-energy H+ and H with N2 and O2 were measured by Van Zyl and Neumann (1980; 1988). These measurements indicate that the hydrogen emis-sion rates peak near and below the projectile energy of 1 keV, when the precipitating flux becomes preferably neutral. 2.1 Energy degradation of the proton flux-excitation,
ion-ization, and charge transfer
If we only consider strictly forward H+/H scattering, the
hydrogen emission line profile is defined by its cross sec-tion (CSh(E)), or, more precisely, by the ratio of the emis-sion cross section to the total energy loss cross section (CSh(E)/CSt(E)). In this case, a proton with a given initial energy Ep will cascade down the whole energy range from Epto thermal energy. It will excite hydrogen emissions with
a line profile corresponding to the CSh(E)/CSt(E) function relative to the wavelength defined by Epto the rest line. In this case no upward flux of excited atoms is generated, so that the line profile will be limited to one wing only, red or blue, depending on whether the observations are made from above or below the region of emission. If we consider two proton beams with energies E1and E2(let us assume that E1>E2), both will produce a line profile with the same shape, except that the E1protons will produce a more extended wing. The presence of the extended wing for more energetic protons causes a larger shift in the peak from the rest line. This is the result that was obtained in a strictly forward scattering approach (see, e.g. Eather, 1967; Sigernes, 1996).
2.2 Magnetic mirroring, geometric spreading and colli-sional pitch-angle redistribution
The presence of magnetic mirroring and geometric spreading only affects the pitch angle distribution of the H+/H beam. Since the line profile shape depends on the projection of the emitting atom velocity on the line-of-sight, this effect leads to broadening of the profile and formation of another wing. As it was shown by Galand and Richmond (1999), the ef-fect of magnetic mirroring is small. Estimates by G´erard et
al. (2000) of the role of the pure geometric spreading also confirmed the minor role of this process on the emission line profiles.
A key process in the production of hydrogen emission is collisional angular redistribution. First, the presence of colli-sional scattering causes angular redistribution of the proton-hydrogen atom beam. This process can lead to a full isotropi-sation of the low-energy flux (which mainly contributes to hydrogen emissions) in the lower thermosphere. The sec-ond important feature is a more effective energy degradation of the incident flux through losses of energy in momentum transfer collisions that are proportional to the sine of the scat-tering angle. It is important to note that collisional pitch an-gle redistribution also leads to an opposite dependence of the peak shift with respect to the energy of precipitating protons. Let us consider two proton beams with initial energies E1and E2(<E1). Protons with higher energy (E1)will reach energy E2 following a certain number of collisions with the atmo-spheric atoms or molecules. This implies that the initially more energetic beam will be more angularly redistributed at a fixed energy, i.e. it will become more isotropic in compar-ison with an initially less energetic precipitation. We shall come back to this important aspect in the Discussion section. 2.3 Cross sections and measured scattering angle
distribu-tions
In this model, we use the standard set of cross sections listed by G´erard et al. (2000). The hydrogen emission cross sec-tions were measured by Van Zyl and Neumann (1980, 1988) with uncertainties of about ±20%. Analysis of the cross sections (CS) shows that the peak of the ratio of the emis-sion cross section to the total cross section is located near 1 keV. Therefore, most of the produced H emissions are gen-erated by hydrogen atoms with a kinetic energy near 1 keV, i.e. in the range of the Van Zyl and Neumann measurements. This means that synthetic line profiles cannot be significantly modified by varying the cross section within the accuracy of the measurements.
these collisions are knock-on, so the scattering angle is uni-formly distributed. If these collisions are not knock-on, there should be some angular distribution with a peak at small an-gles, so the adopted assumption provides an upper limit to the role of this effect.
3 Numerical formulation
The penetration of an energetic H+/H beam into the ambi-ent atmospheric gas can be described by a set of Boltzmann equations for the H+and fast H beams (G´erard et al., 2000). The Direct Simulation Monte Carlo method is used to solve the system of kinetic equations describing the space spread-ing and energy degradation of the H+/H flux. The Monte-Carlo method consists of generating a sample of paths for the state of the physical system under study, in this case the penetration of a H+/H beam into the high-latitude upper at-mosphere. In the numerical simulations the evolution of the system of model particles due to collisional processes be-tween the H+/H beam and the ambient atmospheric gas and
the H+/H transport are calculated from the initial state to the steady state. The details of the algorithmic realization of the numerical model were given earlier (Shematovich et al., 1994; G´erard et al., 2000). Here we only point out the following modifications to the numerical stochastic model of the proton aurora:
– An effective approximation of the majorant frequency (Ivanov and Rogazinskij, 1998) is used to sample the collision statistics. This allows the sequence of colli-sions drawn in the model to be chosen most effectively. – The multi-channel structure of the H+/H + M collisions is taken into account for the selected changes of colli-sional state in the model, i.e. each transition is treated as a simultaneous sampling of all possible (elastic, inelas-tic, ionization, hydrogen emission excitation and charge exchange) channels. Each collisional channel is char-acterized by its corresponding weight, proportional to the ratio of the partial cross section for a given chan-nel to the total cross section of the collisional process. This insures that the statistics on each channel, and es-pecially, on the hydrogen emission excitations, is suffi-ciently sampled.
A key component of this model is the stochastic treatment of the scattering angle distribution in momentum and charge transfer collisions. The hydrogen line profiles are to a large extent controlled by the angular properties of the H+/H+M scattering processes (G´erard et al., 2000; Lummerzheim and Galand, 2001). The essence of the Direct Simulation Monte Carlo method is a sampling of all possible collisions in the physical region under study. Therefore, during the numeri-cal realisation of the kinetic model of proton aurora, statis-tics for all collisional processes are accumulated. It pro-vides a good basis to evaluate the Ly-α, H-α, and H-βsource functions by storing all excitation processes and their spatial
characteristics, and makes it possible to determine the statis-tical distribution of the emitted Ly-α, H-α, and H-βphotons. The emerging synthetic hydrogen line profiles are calculated by numerical integration of the calculated source functions along the line-of-sight.
4 Model simulations
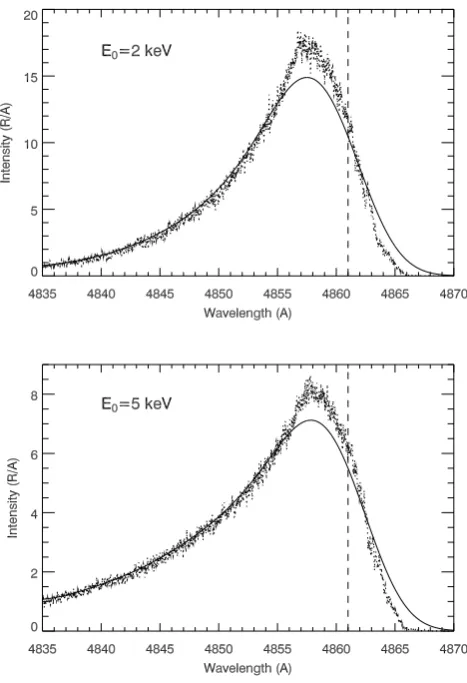
The results of numerical simulation of the H-βline produced by incident protons with energy flux Q0=1 mW m−2s−1and kappa distribution as an energy spectrum are presented in Figs. 1–4. For this energy spectrum the proton mean en-ergy (Em) is connected to the proton distribution charac-teristic energy E0 by the ratio Em=2κE0/(κ−2)=4.67 E0 for κ=3.5. The temperature background and background atmospheric densities are obtained from the MSISE-90 model (Hedin, 1991) with the following input param-eters: day=359, latitude=70◦, longitude=0◦, F10.7=200, F10.7A=210, F10.7P=205, Ap=6, and Q0=1 mW/m2. Ex-amples of the H-β line profiles for the cases of character-istic energy E0=2 keV and 5 keV are shown in the top and bottom panels of Fig. 1, respectively. The line profiles con-volved with a Gaussian response function with a full width at half maximum (FWHM)=0.5 nm, typical of spectral ground-based observations, are presented as well. The calculated peak shifts from the rest line wavelength as a function of the mean energy of precipitating protons for simulated and con-volved synthetic H-β line profiles are shown in Fig. 2. The full widths at half maximum as a function of mean energy of precipitating protons for simulated and convolved H-β line profiles are given in Fig. 3. In this figure, the dashed-dotted line shows the FWHM of the blue wing, and the dashed line shows the FWHM of the red wing. The emission at the peak originates from hydrogen atoms that have undergone efficient collisional energy degradation in the lower thermo-sphere, while the original high-energy precipitation is re-sponsible for the extreme blue-shifted wing of profile. As E0 increases, the number of high-energy hydrogen also in-creases, causing the development of the extreme blue wing. The ratios of spectral brightness of the blue-shifted wing at 484 nm and 485 nm to that of the peak for simulated H-β line profiles are given in Fig. 4. Analysis of these results shows that in our simulations, the peak of the line profile shifts from 0.43 to 0.2 nm, when the mean energy increases from 2.3 keV to 117 keV. Once the profile is convolved (with FWHM=0.5 nm), the peak shifts from 0.37 to 0.24 nm. As it is seen from Fig. 3 the efficiency curves showing the full width at half maximum as a function of mean energy of pre-cipitating protons can be used to evaluate Em from
obser-vations in the range Em=0.5–50 keV. The efficiency curves
showing the ratios of spectral brightness of the blue-shifted wing at 484 nm and 485 nm to that of the peak can also be useful for the interpretation of the observations in this range of mean energies (Lummerzheim and Galand, 2001).
Fig. 1. Synthetic H-β line profiles calculated for proton precipi-tation with characteristic energy E0=2 keV (top) and 5 keV
(bot-tom). The calculated H-βline profiles are shown by the dotted lines, and these lines convolved with a Gaussian response function with FWHM=0.5 nm by the solid lines.
[image:5.595.309.544.60.400.2]Fig. 2. Dependence of peak shift from the rest line wavelength for simulated (squares) and convolved (triangles) synthetic H-βline profiles on the mean energy of precipitating protons.
Fig. 3. Dependence of full width at half maximum for simulated (top panel) and convolved (bottom panel) synthetic H-βline profiles on the mean energy of precipitating protons. The dash-dotted lines show the FWHM of the blue wing, and the dashed lines give the FWHM of the red wing.
Fig. 4. Ratios of spectral brightness of the blue-shifted wing at 484 nm and 485 nm to that of the peak for convolved synthetic H-β
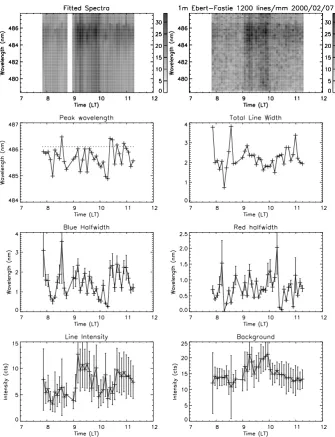
[image:5.595.310.543.480.653.2] [image:5.595.51.283.480.650.2]Fig. 5. H-βspectra observed along the magnetic field line with a 1-m Ebert-Fastie spectrometer at Poker Flat on 7 February 2000. The time variation of different quantities related to the line shape and brightness are also shown.
intensity ratios can be used to infer the proton flux mean energy from observations of hydrogen emission lines. In contrast, the dependence of the peak shift on the proton energy is less useful for the analysis of proton characteristics because the efficiency curve for the peak shift (Fig. 2) is too flat. These results confirm that the peaks of hydrogen emission lines shift toward the rest wavelength when the proton energy increases. This effect may be understood in terms of collisional isotropisation of the downgoing proton beam. As explained before, if we assume a proton precipitation with a near mono-directional field-aligned angular distribution (above the atmosphere), energy loss collisions which also cause angular scattering lead to a more and more isotropic distribution as the beam penetrates the atmosphere. A more isotropic distribution will also have
leads to a substantially larger shift of the peak wavelength than an isotropic distribution. It must be stressed that this energy dependence may only be quantitatively discussed on the basis of an accurate consideration of the process of collisional redistribution in the Monte Carlo model.
5 Observations
To verify the direction of the predicted shift of the line peak, we analyzed a set of 26 nights of observations of the H-β line at 486.1 nm conducted at Poker Flat (Alaska, USA) with the 1-m Ebert-Fastie spectrometer (Lummerzheim and Ga-land, 2001) between 1998 and 2000. Although we did not perform an absolute brightness calibration, the spectrome-ter wavelength calibration with an Xe lamp was done at the start and end of every night of observation, to ensure an ac-curate spectrum. The wavelength resolution was determined experimentally to be a full width at half maximum (FWHM) of 0.43 nm. The data were analyzed by fitting synthetic line profiles to averaged scans, using a nonlinear, least-squares fitting method (Press et al., 1989). Since the Doppler shift associated with the energy and pitch angle distribution of the precipitating particles causes an asymmetrical H-β line pro-file, we have constructed a synthetic line profile I(λ)from a Gaussian shape with different half widths on the blue and red sides of the peak. To account for contamination by elec-tron aurora, our fit also includes a wavelength-independent background. The procedure is described in more detail in Lummerzheim and Galand (2001).
An example of the observational data and the parameters extracted by the fitting process are shown in Fig. 5. In this plot, the H-βspectra and different parameters, including the wavelength of the peak of the Doppler-shifted H-β line and the widths of blue-shifted and red-shifted wings of the line, are shown for 7 February 2000 between 07:00 and 12:00 UT. The co-added spectra are shown on the top right panel as a function of time, and the reconstructed data from the nonlin-ear fit are shown in the top left panel. The other plots show the individual parameters from the fit: the wavelength of the peak of the line, the width of the blue and red wing separately and the total line width, as well as the background ness and the integral under the entire line, i.e. the line bright-ness in relative units. A similar analysis was performed for a number of observational periods between 1998 and 2000. In the following we only discuss the parameters describing the wavelength of the peak of the line and the width of the line profile.
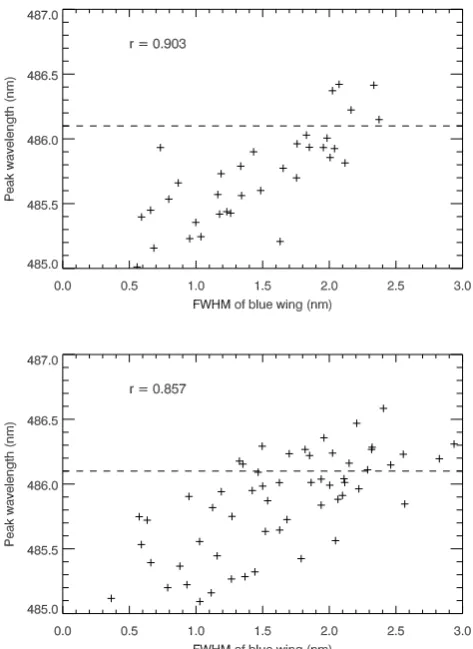
[image:7.595.309.546.60.385.2]We checked the dependence of observed peak positions versus the FWHM of the line blue wing. As it was shown in Fig. 4, the FWHM of the blue wing is proportional to the mean energy of the proton flux. The results of the observa-tions directly show that the line peak shifts toward the rest line wavelength when the proton energy increases. The cor-relation factors for this dependence in the set of observations analyzed were all above the value of 0.8. Such high cor-relations strongly support the calculated dependence of the
Fig. 6. Dependence of the peak wavelength on the FWHM of blue wing for H-β line observations on 7 February 2000, 8:02:36–11:14:20 UT, (top panel) and on 7 March 2000, 7:12:01– 11:10:46 UT (bottom panel). The correlation coefficientsrare in-dicated. The H-β rest wavelength is indicated by the horizontal dashed line in each panel.
peak shift on the proton mean energy. Two examples of the observed dependence of the peak position on the FWHM of the blue wing for H-β line are given in Fig. 6. The general behaviour is the same for the observed and calculated depen-dences. It is seen however that the range of observed peak shifts is larger than that for the calculated ones. This can be explained by both the limitations of the numerical model used, and by the observational uncertainties.
6 Conclusions
at a fixed energy, i.e. energetic protons (hydrogen atoms) are ultimately more isotropised. Since these isotropised H atoms contribute to the wavelength range near the rest line, this pro-cess will shift the peak to the rest line. Stochastic model sim-ulations based on measured distributions of scattering angles show that collisional angular redistribution is indeed very im-portant. In all simulations we find the peak shift from the rest line to decrease with increasing energy. As described before, our model predictions are confirmed by the analysis of auroral H-βline profiles. We also note that the shapes of the excitation cross sections for Ly-α, H-α, and H-β lines are quite similar. Therefore, the dependence of the hydro-gen line profiles on the initial proton energy will be identical. Simulations carried out for Ly-αand H-αprofile have indeed confirmed this common behaviour of the H line profiles. Acknowledgements. J. C. G´erard is supported by the Belgian Fund for Scientific Research (FNRS). This research was partially funded by the Belgian National Fund for Collective Fundamental Research (FRFC grant 2.4517.02), and grant 05-02-17165 of the Russian Foundation for Basic Research and the PRODEX program of the European Space Agency.
Topical Editor T. Pulkkinen thanks two referees for their help in evaluating this paper.
References
Basu, B., Jasperse, J. R., Robinson, R. M., Vondrak, R. R., and Evans, D. S.: Linear transport theory of auroral proton precip-itation: A comparison with observations, J. Geophys. Res., 92, 5920–5932, 1987.
Basu, B., Jasperse, J. R., Strickland, D. J., and Daniel, R. E.: Trans-port theoretical model for the electron-proton-hydrogen atom au-rora, 1, Theory., J. Geophys. Res.,98, 21 517–21 532, 1993. Chua, D. H., Dymond, K. F., Budzien, S. A., McCoy, R. P., G´erard,
J.-C., Coumans, V., Bisikalo, D. V., and Shematovich, V. I.: High resolution FUV observations of proton aurora., Geophys. Res. Lett., 30, 1948–1951, doi::10.1029/2003GL017830, 2003. Cisneros, C., Alvarez, I., Barnett, C. F., and Ray, J. A.:
Differen-tial scattering and total cross sections of hydrogen and deuterium atoms in nitrogen, Phys. Rev.,14, 84–87, 1976.
Decker, D. T., Kozelov, B. V., Basu, B., Jasperse, J. R., and Ivanov, V. E.: Collisional degradation of the proton-H atom fluxes in the atmosphere: A comparison of theoretical techniques, J. Geophys. Res.,101, 26 947–26 960, 1996.
Eather, R. H.: Auroral proton precipitation and hydrogen emissions, Rev. Geophys.,5, 207–285, 1967.
Galand, M., Lilensten, J., Kofman, W., and Sidje, R. B.: Proton transport model in the ionosphere, 1. Multistream approach of the transport equations, J. Geophys. Res.,102, 22 261–22 272, 1997.
Galand, M., Lilensten, J., Kofman, W., and Lummerzheim, D.: Pro-ton transport model in the ionosphere 2. Influence of magnetic mirroring and collisions on the angular redistribution in aproton beam, Ann. Geophys., 16, 1308–1321, 1998,
SRef-ID: 1432-0576/ag/1998-16-1308.
Galand, M. and Richmond, A. D.: Magnetic mirroring in an inci-dent proton beam, J. Geophys. Res., 104, 4447–4456, 1999. Gao, R. S, Johnson, L. K., Hakes, C. L., Smith, K. A., and
Steb-bings, R. F.: Collisions of kilo-electron-volt H+and He+with
molecules at small angles: Absolute differential cross sections for change transfer, Phys. Rev. A, 41, 5929–5933, 1990. G´erard, J.-C., Hubert, B., Bisikalo, D. V., and Shematovich, V. I.: A
model of the Lyman-αline profile in the proton aurora, J. Geo-phys. Res., 105, 15 795–15 806, 2000.
Hedin, A. E.: Extension of the MSIS thermosphere model into the middle and lower atmosphere, J. Geophys. Res., 96, 1159–1172, 1991.
Hubert, B., G´erard, J.-C., Shematovich, V. I., Bisikalo, D. V., and Solomon, S. C.: The role of proton precipitation in the excitation of the auroral FUV emissions, J. Geophys. Res., 106, 21 475– 21 494, 2001.
Ivanov, M. S. and Rogazinskij, S. V.: Analysis of numerical tech-niques of the Direct Simulation Monte-Carlo method in the rar-efied gas dynamics, Sov. J. Numer. Anal. Math. Model., 3, 453– 472, 1988.
Johnson, L .K., Gao, R. S., Smith, K. A., and Stebbings, R. F.: Ab-solute differential cross sections for very-small-angle scattering of keV H and He atoms with H2and N2, Phys. Rev. A, 38, 2794– 2797, 1988.
Kozelov, B. V. and Ivanov, V. E.: Monte-Carlo calculation of proton-hydrogen atom transport in N2, Planet. Space Sci.,40,
1503–1511, 1992.
Lorentzen, D. A., Sigernes, F., and Deehr, C. S.: Modeling and observations of dayside auroral hydrogen emission Doppler pro-files, J. Geophys. Res., 103, 17 479–17 488, 1998.
Lummerzheim, D. and Galand, M.: The profile of the hydrogen
H-βemission line in proton aurora, J. Geophys. Res., 106, 23–32, 2001.
Press, W. H., Flannery, B. P., Teukolsky, S. A., and Vetterling, W. T.: Numerical Recipes in C-The Art of Scientific Computing, Cam-bridge University Press, 2nd edition, 1989.
Rees, M. H.: On the interaction of auroral protons with the Earth’s atmosphere, Planet. Space Sci., 30, 463–472, 1982.
Shematovich, V. I., Bisikalo, D. V., and G´erard, J.-C.: A Kinetic model of the formation of the hot oxygen geocorona, I. Quiet geomagnetic conditions, J. Geophys. Res., 99, 23 217–23 228, 1994.
Sigernes, F.: Estimation of initial auroral proton energy fluxes from Doppler profiles, J. Atmos. Terr. Phys., 58, 1871–1883, 1996. Smith, G. J., Johnson, L. K., Gao, R. S., Smith, K. A., and
Steb-bings, R. F.: Absolute differential cross sections for electron cap-ture and loss by keV hydrogen atoms, Phys. Rev. A, 44, 5647– 5652, 1991.
Synnes, S. A., Soraas, F., and Hansen, J. P.: Monte-Carlo simula-tions of proton aurora, J. Atm. S. Terr. Phys., 60, 1695–1705, 1998.
Van Zyl, B., Neumann, H., Le, T. Q., and Amme, R. C.: H+N2 and H+O2 collisions-experimental charge-production cross sections and differential scattering calculations, Phys. Rev. A, 18, 506– 516, 1978.
Van Zyl, B. and Neumann, H.: H-αand H-βemission cross sections for low-energy H and H+collisions with N2and O2, J. Geophys. Res., 85, 6006–6010, 1980.
Van Zyl, B. and Neumann, H.: Lyman-αemission cross sections for low-energy H and H+collisions with N2, and O2, J. Geophys.
Res.,93, 1023–1027, 1988.