Chapter 2
Functions and
Graphs
Section 5
Objectives for Section 2.5
Exponential Functions
The student will be able to graph and identify the properties of exponential functions.
The student will be able to graph and identify the properties of base e exponential functions.
The student will be able to apply base e exponential functions, including growth and decay applications. The student will be able to solve compound interest
Exponential Function
The equation
defines an exponential function for each different constant b, called the base. The domain of f is the set of all real
Riddle
Here is a problem related to exponential functions: Suppose you received a penny on the first day of
December, two pennies on the second day of December, four pennies on the third day, eight pennies on the fourth day and so on. How many pennies would you receive on December 31 if this pattern continues?
Solution
Day No. pennies
1 1
2 2 2^1
3 4 2^2
4 8 2^3
5 16 ...
Solution
(continued)
Now, if this pattern continued, how many pennies would you have on Dec. 31?
Your answer should be 230 (two raised to the thirtieth
power). The exponent on two is one less than the day of the month. See the preceding slide.
What is 230?
1,073,741,824 pennies!!! Move the decimal point two
Solution
(continued)
The obvious answer to the question is to take the number of pennies on December 31 and not a lump sum payment of $10,000,000
(although I would not mind having either amount!)
This example shows how an exponential function grows extremely rapidly. In this case, the exponential function
is used to model this problem.
( ) 2
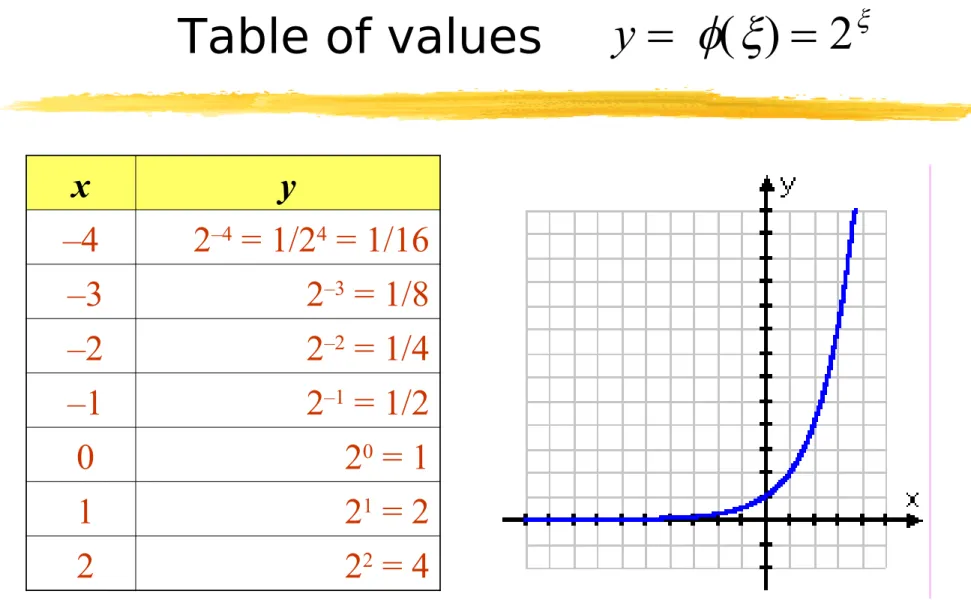
xGraph of
Use a table to graph the exponential function above. Note:
x is a real number and can be replaced with numbers such as as well as other irrational numbers. We will use integer values for x in the table:
f
(
x
)
= 2
xTable of values
x y
–4 2–4 = 1/24 = 1/16
–3 2–3 = 1/8
–2 2–2 = 1/4
–1 2–1 = 1/2
0 20 = 1
1 21 = 2
Basic Properties of the Graph of
All graphs will pass through (0,1) (y intercept)
All graphs are continuous curves, with no holes of jumps. The x axis is a horizontal asymptote.
If b > 1, then bx increases as x increases.
If 0 < b < 1, then bx decreases as x increases.
Graph of
Using a table of values, you will obtain the following graph.
The graphs of and will be
reflections of each other about the y-axis, in general.
1
( ) 2
2
x
x
f x
=
−=
2 4 6 8 10 12
graph of y = 2^(-x) approaches the positive x-axis as x gets large
passes through (0,1)
( ) x
Graphing Other
Exponential Functions
Now, let’s graph
Proceeding as before, we construct a table of values and plot a few points. Be careful not to assume that the graph crosses the negative x-axis. Remember, it gets close to the x-axis, but never intersects it.
( ) 3
xPreliminary Graph of
( ) 3
x
Complete Graph
5 10 15 20 25 30
Series1
Other Exponential Graphs
This is the graph of
It is a reflection of the graph of
about the y axis
It is always decreasing. It passes through (0,1).
( ) 4
xf x
=
−( ) 4
xProperties of Exponential Functions
For a and b positive, a 1, b 1, and x and y real, 1. Exponent laws:
2. ax = ay if and only if x = y
a
xa
y=
a
x+ya
x
a
y=
a
x−y
a
x( )
y=
a
xy( )
ab
x=
a
xb
xa
b
⎛
⎝⎜
⎞
⎠⎟
x=
a
xBase
e
Exponential Functions
Of all the possible bases b we can use for the exponential function y = bx, probably the most useful one is the
exponential function with base e.
The base e is an irrational number, and, like π, cannot be represented exactly by any finite decimal fraction.
However, e can be approximated as closely as we like by evaluating the expression
1
1
x
Exponential Function With Base e
The table to the left
illustrates what happens to the expression
as x gets increasingly larger. As we can see from the table, the values approach a
Exponential Function With Base e
y = e
xand
y = e
–x
Relative Growth Rates
Functions of the form y = cekt, where c and k are constants and the independent variable t represents time, are often used to model population growth and radioactive decay.
Note that if t = 0, then y = c. So, the constant c represents the initial population (or initial amount.)
The constant k is called the relative growth rate. If the relative growth rate is k = 0.02, then at any time t, the
population is growing at a rate of 0.02y persons (2% of the population) per year.
Growth and Decay Applications:
Atmospheric Pressure
The atmospheric pressure
p decreases with
increasing height. The pressure is related to the number of kilometers h
above the sea level by the formula:
• Find the pressure at sea level (h = 0)
• Find the pressure at a height of 7 kilometers.
0.145h
Solution
• Find the pressure at sea level (h = 0)
• Find the pressure at a height of 7 kilometers
0.145(7)
(7) 760
275.43
P
=
e
−=
760
760
)
0
(
=
e
0=
Depreciation of a Machine
A machine is initially worth
V0 dollars but loses 10% of its value each year. Its value after t years is given by the formula
Find the value after 8 years
0
( )
(0.9 )
tDepreciation of a Machine
A machine is initially worth
V0 dollars but loses 10% of its value each year. Its value after t years is given by the formula
Find the value after 8 years of a machine whose initial
Solution:
0
( )
(0.9 )
tV t
=
V
0
( )
(0.9 )
tV t
=
V
8
(8) 30000(0.9 ) $12,914
Compound Interest
The compound interest formula is
Here, A is the future value of the investment, P is the
initial amount (principal or future value), r is the annual interest rate as a decimal, n represents the number of
compounding periods per year, and t is the number of years
1
nt
r
A P
n
⎛
⎞
=
⎜
+
⎟
Compound Interest Problem
Compound Interest Problem
Find the amount to which $1500 will grow if deposited in a bank at 5.75% interest compounded quarterly for 5 years.
Solution: Use the compound interest formula: