DATA MINING
CSE -4229
Contents
Cluster Analysis
Application of Clustering
Major clustering approach
Clustering Algorithm
K-means Algorithm
Nearest Neighbor Algorithm Agglomerative Algorithm
Divisive Algorithm
Conclusion
Finding groups of objects such that the objects in
a group will be similar (or related) to one another and different from (or unrelated to) the objects in
other groups Inter-cluster
distances are maximized Intra-cluster
distances are minimized
Cluster Analysis
Cluster: a collection of data objects
Similar to one another within the same cluster
Dissimilar to the objects in other clusters
Cluster analysis
Finding similarities between data according to
the characteristics found in the data and grouping similar data objects into clusters
Unsupervised learning:
no predefined
A good clustering method will produce high
quality clusters with
high intra-class similarity
low inter-class similarity
The quality of a clustering result depends on both
the similarity measure used by the method and its implementation.
The quality of a clustering method is also
measured by its ability to discover some or all of the hidden patterns.
Application of Clustering
Applications
of
clustering
algorithm
includes
Pattern Recognition
Spatial Data Analysis
Image Processing
Economic Science (especially market research)
Web analysis and classification of documents
Classification of astronomical data and
classification of objects found in an
archaeological study
Scalability
Ability to deal with different types of attributes
Discovery of clusters with arbitrary shape
Minimal requirements for domain knowledge to
determine input parameters
Able to deal with noise and outliers
Insensitive to order of input records
High dimensionality
Incorporation of user-specified constraints
Interpretability and usability
Outliers are objects that do not belong to any
cluster or form clusters of very small cardinality
In some applications we are interested in
discovering outliers, not clusters (outlier
analysis)
cluster
outliers
Major Clustering Approach
Partitioning approach
Construct various partitions and then evaluate
them by some criterion
Typical methods:
k-means, k-medoids,
Major Clustering
Approach(Conti…)
Hierarchical approach
Hierarchical methods obtain a nested partition
of the objects resulting in a tree of clusters.
Typical methods:
BIRCH(Balanced Iterative Reducing and Clustering
Using Hierarchies),
ROCK(A Hierarchical Clustering Algorithm for
Categorical Attributes).
Chameleon(A Hierarchical Clustering Algorithm Using
Major Clustering
Approach(Conti…)
Density-based approach
Based on connectivity and density functions
Typical methods:
Density based methods include DBSCAN(A
Density-Based Clustering Method on Connected Regions with Sufficiently High Density),
OPTICS( Ordering Points to Identify the Clustering
Major Clustering
Approach(Conti…)
Grid-based approach
Based on a multiple-level granularity structure
Typical methods:
STING(Statistical Information Grid),
WaveCluster(Clustering Using Wavelet
Transformation)
Major Clustering Approach
Cluster Analysis
Hierarchical Methods
Agglomerative Divisive
Partitions
K-means
Density-Based
Grid-Based Model-Based
Clustering Algorithm(K-means)
K-means Algorithm: The K-means algorithm may be described
as follows
1. Select the number of clusters. Let this number be K
2. Pick K seeds as centroids of the k clusters. The seeds may be picked
randomly unless the user has some insight into the data.
3. Compute the Euclidean distance of each object in the dataset from
each of the centroids.
4. Allocate each object to the cluster it is nearest to base on the
distances computer in the previous step.
5. Compute the centroids of the clusters by computing the means of the
attribute values of the objects in each cluster.
6. Cheek if the stopping criterion has been met(e.g. the cluster
membership is unchanged) if yes go to step 7. If not, go to step 3.
7. [optional] One may decide to stop at this stage or to split a cluster or
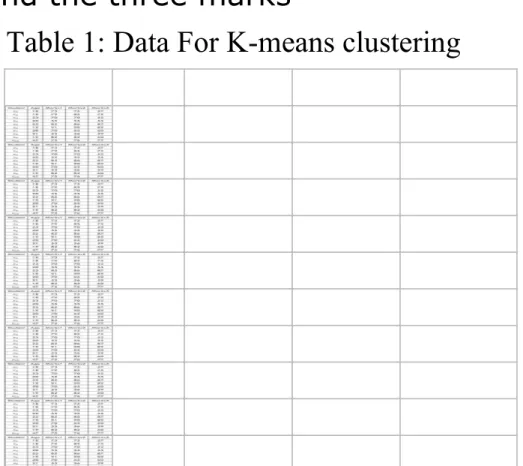
K-means Example
Consider the data about students. The only attributes are
the age and the three marks
Student Age Marks1 Marks2 Marks3
18 73 75 57
18 79 85 75
23 70 70 52
20 55 55 55
22 85 86 87
19 91 90 89
20 70 65 60
21 53 56 59
19 82 82 60
47 75 76 77
K-means Example(Conti…)
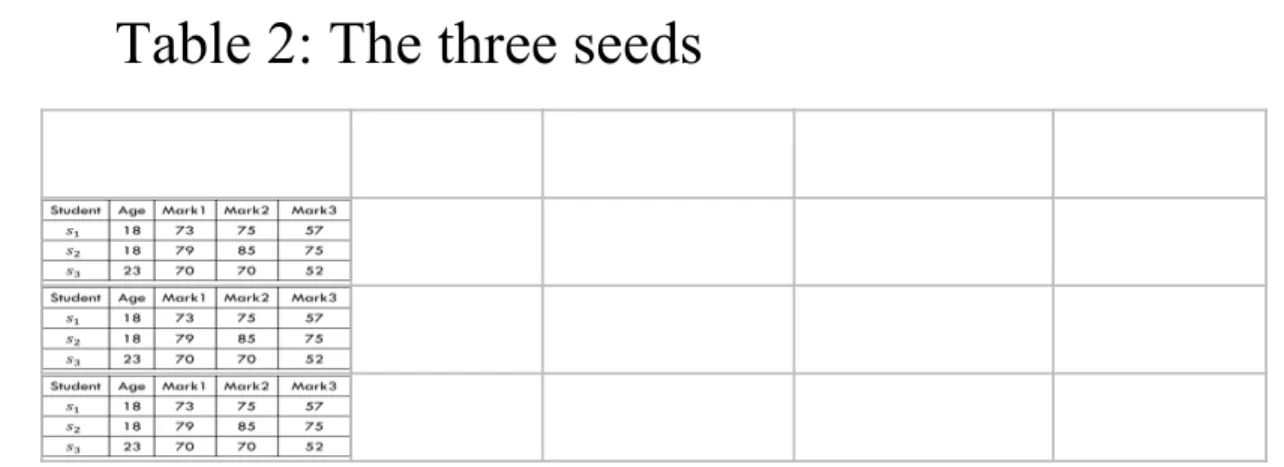
Steps 1 and 2: Let the three seeds be first three students.
Now compute the distances
Based on these distances, each student is allocated to the
nearest cluster.
Student Age Mark1 Mark2 Mark3
18 73 75 57
18 79 85 75
23 70 70 52
C1 18 73 75 57 Distances from clusters
Allocation to the nearest cluster
C2 18 79 85 75 From From From
C3 23 70 70 52 C1 C2 C3
S1 18 73 75 57 0
K-means Example(Conti…)
C1 18 73 75 57
S1 18 73 75 57
0 0 0 0
C1 18 73 75 57 Distances from clusters
Allocation to the nearest cluster
C2 18 79 85 75 From From From
C3 23 70 70 52 C1 C2 C3
S1 18 73 75 57 0 34
K-means Example(Conti…)
C2 18 79 85 75
S1 18 73 75 57
0 6 10 18
C1 18 73 75 57 Distances from clusters
Allocation to the nearest cluster
C2 18 79 85 75 From From From
C3 23 70 70 52 C1 C2 C3
S1 18 73 75 57 0 34 18 C1
K-means Example(Conti…)
C3 23 70 70 52
S1 18 73 75 57
5 3 5 5
C1 18 73 75 57 Distances from clusters
Allocation to the nearest cluster
C2 18 79 85 75 From From From
C3 23 70 70 52 C1 C2 C3
S1 18 73 75 57 0 34 18 C1
S2 18 79 85 75 34
K-means Example(Conti…)
C1 18 73 75 57
S2 18 79 85 75
0 6 10 18
C1 18 73 75 57 Distances from clusters
Allocation to the nearest cluster
C2 18 79 85 75 From From From
C3 23 70 70 52 C1 C2 C3
S1 18 73 75 57 0 34 18 C1
S2 18 79 85 75 34 0
K-means Example(Conti…)
C2 18 79 85 75
S2 18 79 85 75
0 0 0 0
C1 18 73 75 57 Distances from clusters
Allocation to the nearest cluster
C2 18 79 85 75 From From From
C3 23 70 70 52 C1 C2 C3
S1 18 73 75 57 0 34 18 C1
S2 18 79 85 75 34 0 52 C2
K-means Example(Conti…)
C3 23 70 70 52
S2 18 79 85 75
5 9 15 23
C1 18 73 75 57 Distances from clusters
Allocation to the nearest cluster
C2 18 79 85 75 From From From
C3 23 70 70 52 C1 C2 C3
S1 18 73 75 57 0 34 18 C1
S2 18 79 85 75 34 0 52 C2
S3 23 70 70 52 18 52 0 C3
S4 20 55 55 55 42 76 36 C3
S5 22 85 86 87 57 23 67 C2
S6 19 91 90 89 66 32 82 C2
S7 20 70 65 60 18 46 16 C3
S8 21 53 56 59 44 74 40 C3
S9 19 82 82 60 20 22 36 C1
S10 47 75 76 77 52 44 60 C2
Age Marks
1 Marks2 Marks3 Cluster
S1 18 73 75 57 C1
S2 18 79 85 75 C2
S3 23 70 70 52 C3
S4 20 55 55 55 C3
S5 22 85 86 87 C2
S6 19 91 90 89 C2
S7 20 70 65 60 C3
S8 21 53 56 59 C3
S9 19 82 82 60 C1
S10 47 75 76 77 C2
K-means Example(Conti…)
Age Mark1 Mark2 Mark3
C1 18.5 77.5 78.5 58.5
S1 18 73 75 57
S9 19 82 82 60
Age Marks
1 Marks2 Marks3 Cluster
S1 18 73 75 57 C1
S2 18 79 85 75 C2
S3 23 70 70 52 C3
S4 20 55 55 55 C3
S5 22 85 86 87 C2
S6 19 91 90 89 C2
S7 20 70 65 60 C3
S8 21 53 56 59 C3
S9 19 82 82 60 C1
S10 47 75 76 77 C2
K-means Example(Conti…)
Age Mark1 Mark2 Mark3
C1 18.5 77.5 78.5 58.5
C2 26.5 82.5 84.3 82.0
S2 18 79 85 75
S5 22 85 86 87
S6 19 91 90 89
S10 47 75 76 77
Age Marks
1 Marks2 Marks3 Cluster
S1 18 73 75 57 C1
S2 18 79 85 75 C2
S3 23 70 70 52 C3
S4 20 55 55 55 C3
S5 22 85 86 87 C2
S6 19 91 90 89 C2
S7 20 70 65 60 C3
S8 21 53 56 59 C3
S9 19 82 82 60 C1
S10 47 75 76 77 C2
K-means Example(Conti…)
Age Mark1 Mark2 Mark3
C1 18.5 77.5 78.5 58.5
C2 26.5 82.5 84.3 82.0
C3 21 61.5 61.5 56.5
S3 23 70 70 52
S4 20 55 55 55
S7 20 70 65 60
S8 21 53 56 59
Age Marks
1 Marks2 Marks3 Cluster
S1 18 73 75 57 C1
S2 18 79 85 75 C2
S3 23 70 70 52 C3
S4 20 55 55 55 C3
S5 22 85 86 87 C2
S6 19 91 90 89 C2
S7 20 70 65 60 C3
S8 21 53 56 59 C3
S9 19 82 82 60 C1
S10 47 75 76 77 C2
K-means Example(Conti…)
Age Mark1 Mark2 Mark3
C1 18.5 77.5 78.5 58.5
C2 26.5 82.5 84.3 82.0
C3 21 61.5 61.5 56.5
Cluster membership Cluster-1: S1 , S9
Cluster-2: S2 ,S5 , S6 , S10
K-means Example(Conti…)
Use the new cluster means to re compute
C1 18.5 77.5 78.5 58.5 Distances from clusters
Allocation to the nearest cluster
C2 26.5 82.5 84.3 82 From From From
C3 21.0 62.0 61.5 56.5 C1 C2 C3
S1 18 73 75 57 10.0 52.3 28.0 C1
S2 18 79 85 75 25.0 19.8 62.0 C2
S3 23 70 70 52 27.0 60.3 23.0 C3
S4 20 55 55 55 51.0 90.3 16.0 C3
S5 22 85 86 87 47.0 13.8 79.0 C2
S6 19 91 90 89 56.0 28.8 92.0 C2
S7 20 70 65 60 24.0 60.3 16.0 C3
S8 21 53 56 59 50.0 86.3 17.0 C3
S9 19 82 82 60 10.0 32.3 46.0 C1
S10 47 75 76 77 52.0 41.3 74.0 C2
K-means Example(Conti…)
No changes
in member
We have done.
Cluster membership Cluster-1: S1 , S9
Cluster-2: S2 ,S5 , S6 , S10
Example
K-means Example(Conti…)
0 1 2 3 4 5 6 7 8 9 100 1 2 3 4 5 6 7 8 9 10
0 1 2 3 4 5 6 7 8 9 10
0 1 2 3 4 5 6 7 8 9 10
0 1 2 3 4 5 6 7 8 9 10
0 1 2 3 4 5 6 7 8 9 10 0 1 2 3 4 5 6 7 8 9 10
34
Strengths
Relatively efficient: O(tkn), where n is # objects,
k is # clusters, and t is # iterations. Normally,
k, t << n.
Often terminates at a local optimum.
Weaknesses
Applicable only when mean is defined (what about
categorical data?)
Need to specify k, the number of clusters, in
advance
Trouble with noisy data and outliers
Not suitable to discover clusters with non-convex
shapes
K-means Example(Conti…)
The results of the k-means method depend strongly on the
initial guesses of the seeds.
The k-means method can be sensitive to outliers. If an
outlier is picked as a starting seed, it may end up in a cluster of its own. Also if an outlier moves from one cluster to another during iterations, it can have a major impact on the clusters because the means of the two clusters are likely to change significantly.
Although some local optimum solutions discovered by the
K-means method are satisfactory, often the local optimum is not as good as the global optimum.
The K-means method does not consider the size of the
clusters. Some clusters may be large and some very small.
Nearest Neighbor Algorithm
An algorithm similar to the single link technique
is called the nearest neighbor algorithm.
With this serial algorithm, items are iteratively
merged into the existing clusters that are closet.
In this algorithm a threshold, t is used to
Nearest Neighbor Algorithm
Algorithm for Nearest Neighbor clustering
Input:
D = {, } // Set of elements
A //Adjacency matrix showing distance between elements
Output: K // Set of clusters
1. ;
2. K= {} 3. K = 1
4. For i =2 to n do
1. Find the in some cluster
1. dis(,) is the smallest;
2. if dis(, )≤ t then
1. = U
3. else
1. K = K+1;
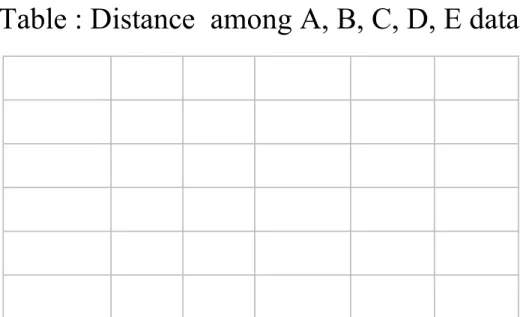
Nearest Neighbor Algorithm
Example
Item A B C D E
A 0 1 2 2 3
B 1 0 2 4 3
C 2 2 0 1 5
D 2 4 1 0 3
E 3 3 5 3 0
Nearest Neighbor Algorithm
Example
A placed to a cluster by itself
K1={A}
Item A B C D E
A 0 1 2 2 3
B 1 0 2 4 3
C 2 2 0 1 5
D 2 4 1 0 3
Nearest Neighbor Algorithm
Example
Consider B, should it be added to K1 or form a
new cluster?
Dist(A,B)=1 and less than threshold value 2
So K1={A, B}
Item A B C D E
A 0 1 2 2 3
B 1 0 2 4 3
C 2 2 0 1 5
D 2 4 1 0 3
Nearest Neighbor Algorithm
Example
For C we calculate distance from both A and B.
Dist(AB, C)= min{dist(A, C), Dist(B, C)}
Dist(AB, C)=2
So K1={A, B, C}
Item A B C D E
A 0 1 2 2 3
B 1 0 2 4 3
C 2 2 0 1 5
D 2 4 1 0 3
Nearest Neighbor Algorithm
Example
Dist(ABC, D)= min{Dist(A, D), Dist(B, D),Dist(C, D)}
=min{2,4,1} =1
So K1={A, B, C, D}
Item A B C D E
A 0 1 2 2 3
B 1 0 2 4 3
C 2 2 0 1 5
D 2 4 1 0 3
Nearest Neighbor Algorithm
Example
Dist(ABCD, E)= min{Dist(A, E), Dist(B, E),Dist(C, E), Dist(C, E)}
=min{3, 3, 5, 3}
=3 greater than threshold value.
So K1={A, B, C, D} And K2={E}
Item A B C D E
A 0 1 2 2 3
B 1 0 2 4 3
C 2 2 0 1 5
D 2 4 1 0 3