R E S E A R C H
Open Access
TGF-
β
2 initiates autophagy via Smad and
non-Smad pathway to promote glioma
cells
’
invasion
Chao Zhang
1,2, Xin Zhang
1,2, Ran Xu
1,2, Bin Huang
2, An-Jing Chen
2, Chao Li
1,2, Jian Wang
1,2,3*and Xin-Gang Li
1,2,3*Abstract
Background:Glioblastoma multiforme (GBM) is characterized by lethal aggressiveness and patients with GBM are in urgent need for new therapeutic avenues to improve quality of life. Current studies on tumor invasion focused on roles of cytokines in tumor microenvironment and numerous evidence suggests that TGF-β2 is abundant in glioma microenvironment and vital for glioma invasion. Autopagy is also emerging as a critical factor in aggressive behaviors of cancer cells; however, the relationship between TGF-β2 and autophagy in glioma has been poorly understood.
Methods:U251, T98 and U87 GBM cell lines as well as GBM cells from a primary human specimen were used in vitro and in vivo to evaluate the effect of TGF-β2 on autophagy. Western blot, qPCR, immunofluorescence and transmission-electron microscope were used to detect target molecular expression. Lentivirus and siRNA vehicle were introduced to establish cell lines, as well as mitotracker and seahorse experiment to study the metabolic process in glioma. Preclinical therapeutic efficacy was evaluated in orthotopic xenograft mouse models. Results:Here we demonstrated that TGF-β2 activated autophagy in human glioma cell lines and knockdown of Smad2 or inhibition of c-Jun NH2-terminal kinase, attenuated TGF-β2-induced autophagy. TGF-β2-induced autophagy is important for glioma invasion due to the alteration of epithelial-mesenchymal transition and metabolism conversion, particularly influencing mitochondria trafficking and membrane potential (△Ψm). Autopaghy also initiated a feedback on TGF-β2 in glioma by keeping its autocrine loop and affecting Smad2/3/7 expression. A xenograft model provided additional confirmation on combination of TGF-βinhibitor (Galunisertib) and autophagy inhibitor (CQ) to better“turn off”tumor growth.
Conclusion:Our findings elucidated a potential mechanism of autophagy-associated glioma invasion that TGF-β2 could initiate autophagy via Smad and non-Smad pathway to promote glioma cells’ invasion.
Keywords:Malignant brain tumor, Autophagy, TGF-β, Tumor invasion, Galunisertib
Background
Malignant brain tumors are among the most intractable tumors and are known for their devastating prolifera-tion, invasion and chemotherapy resistance [1]. Despite enormous efforts to target various pathways by sup-pressing oncogenes or angiogenesis, no improvement in survival has occurred, necessitating further study of the mechanisms of glioma oncogenesis [2]. Of all the
hallmarks of glioma, the invasive ability poses a great barrier to surgeons and limits treatment options. Survival is measured in months (median survival is 14.6 months) [3]. In aggressive tumors, many kinds of autocrine and paracrine cytokines derived from astrocytes, microglia or glioma were found, which promotes tumor cell invasion, progression and metastasis. And during glioma invasion, the cytokines are reported to promote the trans-differentiation of immobile, polarized epithelial cells to motile, invasive mesenchymal cells, which is known as the epithelial-mesenchymal transition (EMT) [4–6]. Thus,
* Correspondence:jian.wang@uib.com;lixg@sdu.edu.cn
1Department of Neurosurgery, Qilu Hospital of Shandong University, 107
Wenhua Western Rd, Jinan, Shandong 250012, China
Full list of author information is available at the end of the article
much research has focused on the effect of cytokines on glioma invasion [7, 8].
Among the cytokines, TGF-β (transforming growth factor-β) is reported to be associated with essential mol-ecules in glioma invasion [9–11]. And also in high grade tumors, increased TGF-β is related with poor clinical prognosis [8, 12, 13]. TGF-βcould be divided into three isoforms in mammals: TGF-β1, TGF-β2, TGF-β3 and shared approximately 80% amino acid sequence identity and are distributed in different tissues [14].
In all the isoforms of TGF-β, TGF-β2 is specifically overexpressed in highly aggressive glioma and is in-volved in brain tumor development [14, 15]. Elevated TGF-β2 expression levels are usually observed in the later stages of tumor progression and in up to 95% of high grade gliomas [15–17]. TGF-β2 initiates an auto-crine loop to promote its own expression and enable oncogenic activity. Thus the hyperactive TGF-βpathway and its key role in glioma oncogenesis provide a new target to cure gliomas. For instance, the TGF-βpathway inhibitors AP12009 and Galunisertib have been applied in phase II/III clinical cases, yielding encouraging results [18, 19].
Besides, this cytokine also has a dual role in oncogen-esis. Depending on conditions and tumor stage, TGF-β can act as either a tumor suppressor or as a tumor pro-moter [19, 20].The mechanism of TGF-βtransformation from tumor suppressor to tumor promoter is unclear. Currently, researchers are searching for the “switch fac-tors”causing this behavior.
Previous studies have shown that autophagy could be activated by TGF-β and potentiate TGF-β-mediated growth inhibition in human hepatocellular carcinoma cells [21]. In our experiments, we tried to elucidate the effect of TGF-β on glioma from the autophagy aspect. Autophagy is an evolutionarily conserved lysosomal deg-radation pathway in which the cell re-digests its own proteins and organelles, thus maintaining macromolecu-lar synthesis and ATP production [22]. The intactness of this flux is important for tumor cell invasion which con-sumes high levels of ATP, involves secretion factors, and reorganizes skeleton proteins [23, 24]. The inhibition of autophagy impairs tumor cell invasion. [25] Autophagy-mediated tumor promotion may work through suppress-ing the p53 response, maintainsuppress-ing mitochondria func-tion, sustaining metabolic homeostasis and preventing the diversion of tumor progression [26]. However, the exact mechanism underlying how autophagy impairs glioma tumor progression needs to be explored and rela-tionship between autophagy and cytokines also needs large studies. As autophagy and TGF-βare both involved in glioma invasion and participate in similar tumor func-tions, whether there are innate connections between these two factors in glioma and whether these associations
influence glioma oncogenesis remain unknown. Our current study reports that TGF-β2 activates autophagy in glioma, influencing glioma invasion and metabolism reprogramming.
Methods
Cell culture and reagents
The high-grade, human glioma cell lines U251, U87 MG and T98G were obtained from American Type Culture Collection (Manassas, VA, USA) and used for in vitro experiments. Tumor cells were maintained as monolayer cultures in Dulbecco’s Modified Eagle’s Medium (DMEM; GIBCO) supplemented with 5% fetal calf serum (FCS). Primary cell line (P3) was obtained from the Department of Biomedicine, University of Bergen. When indicated, the cells were treated with TGF-β2 (10 ng/ml; PeproTech) and/or the small molecule TGF-β receptor inhibitor LY2157299 (10 μM; Selleck), chloroquine (10 μM; Selleck), bafilomycin A1 (10 μM; Tocris) and rapamycin (20μM; Selleck). The inhibitor was added 2 h before the addition of TGF-β2.
Constructs, transfection, and lentiviral/retroviral infection
The siATG5, siATG7 shRNA-expressing vector was ob-tained from GenePharma (Shanghai, China). GFP-LC3 (pBABEpuro, 22,405)-expressing vectors were obtained from Addgene (Cambridge, MA, USA). For the stable downregulation of ATG5, ATG7 scrambled and shRNA pGIPZ vectors were purchased from Open Biosystems (Thermo Scientific) or obtained through the Open Bio-systems library. Lentiviral and retroviral supernatants were prepared following the manufacturer’s instructions and provided by GenePharma. Lentiviral infections were carried out accordingly. A validated Stealth RNAi (Gene-Pharma) specific to Smad2 was also transfected into the U251, T98, and U87 cells using Lipofectamine 2000 ac-cording to the manufacturer’s protocol.
Migration and invasion assays
Western blotting
In brief, the cells were harvested, and lysed with protein extraction agent (Beyotime, Beijing, China). 25–50 μg of proteins per sample per lane were loaded for sodium dodecyl sulfate-polyacrylamide gel electrophoresis (SDS-PAGE). Primary antibodies were incubated overnight at 4 °C. Rabbit polyclonal primary antibodies were used against LC3B, SQSTM1, MMP2, MMP9, vimentin, N-cadherin, β-catenin, Slug2, Akt, JNK, SMAD2 (1:1000; Cell Signaling), TGF-β2 (1:500; Abcam), phospho-SMAD2, phospho-Akt, and phospho-JNK (1:500; Cell Signaling). Purified mouse anti-β-actin was used (1:1000; Santa Cruz Biotechnology, Inc.). Secondary antibodies were incubated with anti-mouse immunoglobulin G (IgG), anti-rabbit IgG (1:5000; Santa Cruz Biotechnology) for 1 h at RT. The proteins were visualized using Millipore’s enhanced chemiluminescence (ECL) and detection system analyzed (ChemiDoc Touch, BioRad).
Intracranial injection mouse model
U87 cells were prepared for intracranial injection into NOD SCID male mice obtained from Vital River Labora-tories. A total of five animals per condition were used, and animals were grouped as follows: PBS group, LY2157299 (75 mg/kg/d) group, CQ (25 mg/kg/d) group and LY2157299 (75 mg/kg/d) combined with CQ (25 mg/kg/ d) group, drugs were used by oral application and 10ul U87 cells (1 × 10⁶/μl PBS) were injected in the cerebral cortex using a stereotactic frame. The mice were moni-tored and killed when they presented with neurological signs or after two months, during which time the tumor volumes and invading distance were monitored by MRI (General Electric, 3.0 T). Brains of three groups (PBS group, LY2157299 group and LY2157299 combined CQ group) were harvested and fixed in 4% paraformaldehyde for 48 h, embedded in paraffin and prepared for IHC. These experiments were approved by the Animal Care and Use Committee of Shandong University and con-formed to the Animal Management Rule of the Chinese Ministry of Health (documentation 55, 2001).
Quantitative real-time PCR
Total RNA was isolated using the RNeasy mini kit (Qiagen) according to the manufacturer’s instructions. RNA was analyzed quantitatively using a Nanodrop (Nanodrop Technologies, Rockland, DE, USA). Total RNA (1 μg) was reverse transcribed into cDNA using a cDNA synthesis kit (Toyobo) according to the manu-facturer’s instructions. RT-PCR was performed in a Roche LightCycler 2.0 detector with the Toyobo SYBR Green Supermix. The reactions were analyzed using SDS software (Version 2.4). The threshold cycles (CT) were calculated and the relative gene expression was ana-lyzed after normalizing to glyceraldehyde 3-phosphate
dehydrogenase (GAPDH). The human primers are listed in Additional file 1: Figure S1.
Immunofluorescence
GBM cells were plated on glass slides in 24-well culture plates at a concentration of 2 × 10⁵cells/well for 24 h and were subsequently treated with drugs for an add-itional 48 h in DMEM containing FBS. The cells were then fixed with a 4% formaldehyde solution in PBS, permeabilized with 0.5% Triton X-100 in PBS, stained with primary antibody overnight, and labeled with anti-mouse or anti-rabbit IgG conjugated with FITC and DyLight 594 (Santa Cruz Biotechnology). The cells were counterstained with DAPI and observed under an Olympus BX61 fluorescence microscope. Pictures were scanned using a DP71 CCD (charge-coupled device) digital camera.
Mitochondrial morphology
Live cells were fluorescently labeled with 25 nM Mito-Tracker Red (Invitrogen, Molecular Probes) and were then fixed and permeabilized for antibody conjugating. All treatments were performed according to the manufacturer’s instructions. Mitochondrial morphology was analyzed using an Olympus BX61 fluorescence microscope.
Measurement of△Ψm
For the△Ψm measurements, the cells were loaded with 50 nM tetramethylrhodamine methylester (JC-1) for 30 min at room temperature. The dye was present dur-ing the experiment accorddur-ing to the manufacturer. The mitochondrial membrane potential was analyzed using an Olympus BX61 fluorescence microscope equipped with a 40× objective and quantified by flow cytometry (Novocyte, ACEA).
Enzyme-linked Immunosorbent assay
For the quantitative determination of activated human TGF-β2, MMP2, MMP9 concentrations in cell culture supernatants, the quantitative sandwich enzyme im-munoassay technique was used with commercially available, specific immunoassay kits for human TGF-β2 (R&D Systems), MMP2, and MMP9 (eBioscience). The minimum detectable dose of TGF-β2 was less than 7.0 pg/ml. The assay was performed in triplicate ac-cording to the manufacturer’s instructions.
ATP—Lactate determination
was measured using the L-Lactate assay kit (Abcam). The data were expressed as moles of ATP and mg/dl lac-tate, and all values were normalized to the number of cells.
Statistical analysis
Results are presented as the mean ± SD from at least three independent experiments. The comparisons were per-formed using with two-tailed Student’s t test, Spearman correlation test, Pearson correlation test, Wilcoxon matched-pair test, one-way ANOVA and long-rank analyse. Significant differences: *p< 0.05; **p< 0.01;***p< 0.001.
Results
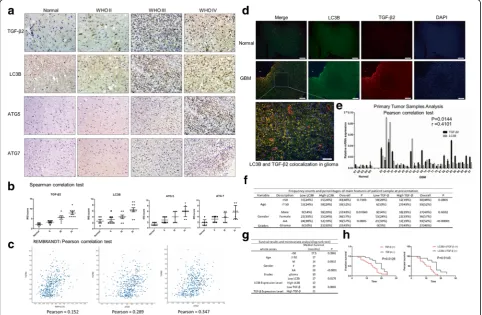
TGF-β2 and LC3B are highly expressed in glioma and correlated with each other indicating poor prognosis in glioma patients
Although large studies has been conducted [27, 28], the role of autophagy’s markers Light Chain 3B (LC3B), ATG5 and ATG7 in glioma prognosis was still controversial. By
applying immunochemistry on samples with different pathologic grades obtained from patients in Qilu Hospital, China from 2012 to 2015, we found that the percentage of LC3B, ATG5, ATG7 positive cells was associated with the pathologic grade (Fig. 1a). During this IHC process, we also found abundant TGF-β2 positive cells in GBM sam-ples accompanied with autophagy markers positive. To quantitatively analyze the immunochemistry samples, we used the IRS scoring model (IRS = SI (staining inten-sity) × PP (percentage of positive cells)) [29], Wilcoxon matched-pair test, and Spearman correlation test to assess the results. Then the autophagy related markers and TGF-β2 were both identified to be associated with the patho-logic grades (Fig. 1b) and correlated with each other when searched in REMBRANDT database (Fig. 1c).
To further explore the relationship between autophagy and TGF-β, we concentrated on LC3B and TGF-β.The immunofluorescence images indicated that these two molecules were co-localized in glioma tissues (Fig. 1d). We verified these conclusions in primary tumor samples
and qRT-PCR analysis showed similar results in normal brain tissues and glioma patients: Student’s t test, LC3B: GBM vs Normal,p= 0.0401, TGF-β2: GBM vs Normal,
P = 0.0490; Pearson correlation test, r = 0.4101,
p= 0.0144 (Fig. 1e).
Then based on the data we obtained from qRT-PCR, LC3B and TGF-β2 expression levels were also found to be associated with glioma grades in Chi-square test, whereas patient age and gender had no influence (Fig. 1f). We then added the survival time index and used the long-rank test to analyze. Data showed that high TGF-β2 expression in-dicated poor prognosis and short survival time in glioma patients (Fig. 1g). And among the samples with high TGF-β2 expression, robustly positive LC3B expression usually indicated a worse survival outcome (Fig. 1h). As the rela-tionship between TGF-β2 and autophagy in glioma has not been explored, these results indicate that TGF-β2 and LC3B are highly expressed in glioma and correlated with each other. High expression levels of TGF-β2 with LC3B indicates poor prognoses in glioma patients.
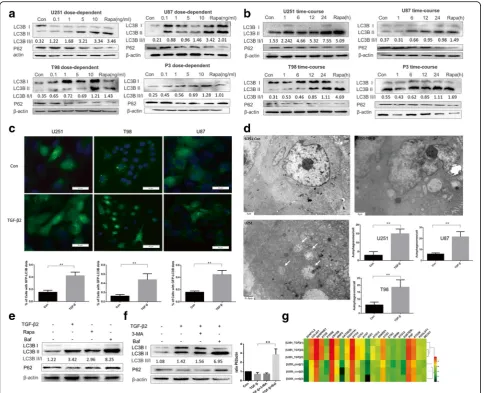
TGF-β2 induces autophagy in human glioma cell lines in a time and dose-dependent manner
To investigate the exact relationship between TGF-β2 and LC3B in glioma, we treated the tumor cells with a TGF-β2 dose gradient ranging from 0.1 ng/ml to 10 ng/ml, and after 24 h, Western blotting was used to detect autophagy levels. As an increase in the LC3B-II/I ratio is a credible marker of autophagy enhancement [30], TGF-β2 promoted endogenous LC3B-I to LC3B-II conversion in three different cell lines and one primary cell line in a dose-dependent manner (Fig. 2a Additional file 6: Figure S6a). To determine the proper time required for TGF-βstimulation, we set a gradient time course and also tested the conversion ratio by western blot. Our results indicated that 24 h was appropriate to induce glioma autophagy (Fig. 2b and Additional file 6: Figure 6b).
To confirm this phenomenon, we applied a lenti-viral system and generated stably expressing GFP-LC3 cells to monitor autophagy (TGF-β2, 10 ng/ml, 24 h) (Fig. 2c). In autophagy studies, the analysis of GFP-LC3 localization is widely performed by counting LC3-GFP positive cells (LC3-GFP dots greater than four) [30]. We found that TGF-β2 treatment increased the percentage of LC3-GFP positive cells (Fig. 2c). As transmission electron microscopy is the gold standard for identifying autophagosome double-membrane structure, we used transmission electron microscopy and found that glioma autophagosomes increased after TGF-β2 treatment (Fig. 2d, Additional file 2: Figure S2a).
Considering the disadvantage of cell lines to represent glioma’s characters, we introduced primary cells in our in vitro experiment, which were obtained from newly surgical GBM samples in Qilu hospital and grades were
confirmed by pathology IHC. As shown in western blot (Fig. 2e), TGF-β2 could also initiate autophagy in pri-mary cell under the same condition (10 ng/ml; 24 h) which indicate that the results of cell lines may represent the primary cells to some extent in our experiment.
Effects of 3-MA or Baf on autophagy flux mediated by TGF-βwere also determined. Glioma cells were incubated with 3-MA (10 mmol/L) or Baf (10 nmol/L) during the treatment with TGF-β2 (Fig. 2f) and results indicated that Baf could effectively inhibit TGF-βinduced autophagy ex-cept for 3-MA. According to the results of a microarray that compared the control and TGF-β2 treatment groups, the mRNA levels of the autophagy related genes BECN1, ATG5, ATG7 were also up-regulated after TGF-β2 treat-ment (Fig. 2g). To summarize, autophagy can be induced by TGF-β2 (10 ng/ml, 24 h) and blocked by Baf (10 nmol/L, 24 h). We next investigated the biological significance of this phenomenon.
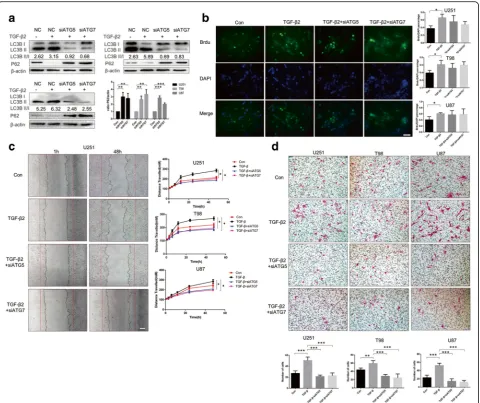
TGF-β2 induced autophagy is related to glioma invasion and migration
To explore the biological meaning of TGF-β2-induced autophagy in oncogenesis, we first introduced a stable siRNA expression system targeting the essential au-tophagy gene ATG5 and ATG7. Efficiency of siRNA was examined by Western blot (Fig. 3a), and the ratio of LC3B-I to LC3B-II conversion and SQSTM1 (also well known as P62) degradation indicated that siATG5, siATG7 was an effective target for inhibiting autophagy flux. As we know from previous studies, TGF-β2 pro-motes glioma oncogenesis behavior [9, 31, 32]. We used methods involving CCK-8 and BrdU proliferation as-says to assess cell proliferation and observed no obvi-ous effect after TGF-β2 treatment in normal tumor cells (NTC) or autophagy-deficient tumor cells (Fig. 3b, Additional file 3: Figure S3).
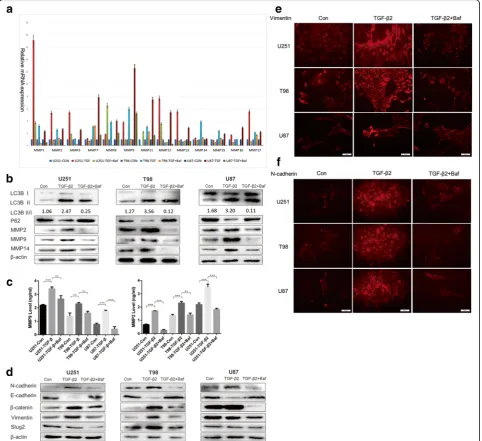
TGF-β2 induced EMT in glioma cells could be blocked by suppressing autophagy
To identify the mechanism of autophagy-influenced glioma invasion, we conducted qRT-PCR to determine the expression levels of MMPs in normal glioma cells and Baf-treated tumor cells with or without TGF-β2 stimulation (Fig. 4a). The Baf treatment down-regulated the mRNA expression of the mostly MMP family in cells exposed to TGF-β2, and in contrast control group with TGF-β2 showed increasing expression levels of most
expressed (Fig. 4c). In addition to degrading ECM, MMP2, 9 are also markers of EMT. We used Western blotting to examine other EMT markers to assess the potential association between EMT, TGF-β2 and autoph-agy. N-cadherin, Vimentin, Slug2, and β-catenin in-creased in normal tumor cells (NTC) treated with TGF-β2 but decreased in autophagy-inhibited cells however E-cadherin showed reverse effect (Fig. 4d). Immuno-fluorescence again demonstrated a direct change of Vimentin and N-cadherin between NTC and Baf-treated cells after treatment with TGF-β2 (Fig. 4e, f ). Taken to-gether, these results provide a potential explanation for
how autophagy impairs glioma invasion: the inhibition of autophagy may lead to an impaired EMT and a failure in the invasive behavior of glioma cells.
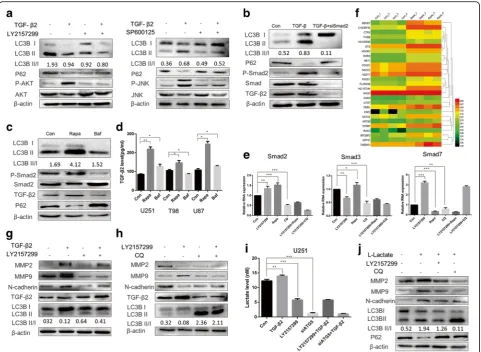
Autophagy induction by TGF-β2 is mediated by c-Jun NH2-terminal kinase and the Smad pathway and in turn affects TGF-β2 synthesis and secretion
AKT-PI3K-mTOR pathway by 3-MA did not attenuate TGF-β2-induced autophagy (Fig. 5a). Thus, we assessed the mTOR-independent pathway using the c-Jun NH2-terminal kinase (JNK) pathway inhibitor SP600125. This treatment efficiently down-regulated the LC3B-II level in TGF-β2 treated glioma cells, indicating JNK pathway was one potential pathway responsible for TGF-β2 induced autophagy. TGF-βsignals also went through downstream Smad and non-Smad pathways. The JNK pathway is a
non-Smad pathway, and therefore we examined whether the Smad pathway also participated in autophagy induc-tion. After transient siRNA with siSmad2, the addition of TGF-β2 did not stimulate autophagy in glioma, suggesting that the Smad pathway was also involved in autophagy in-duction (Fig. 5b).
autocrine signaling (Fig. 5c), finding that rapamycin ele-vated the endogenous TGF-β2 levels in glioma cell and enhanced Smad2 phosphorylation. However, in siATG5-treated tumor cells, the Western blotting results showed reverse effect (Fig. 5c). The ELISA assay for TGF-β2 also demonstrated these phenomenon (Fig. 5d).
We next explored how autophagy influenced TGF-β2. The qRT-PCR results demonstrated that enhancing au-tophagy by rapamycin increased the R-Smad expression levels (Smad2, Smad3) and decreased the I-Smad expres-sion level (Smad7). In contrast, CQ down-regulated Smad2 and Smad3 and up-regulated Smad7 (Fig. 5e). Microarray also indicated that promoting autophagy could also in turn regulate TGF-β genes’ expression (Fig. 5f).
LY21457299 is a clinical applied TGF-β inhibitors, how-ever Western blotting demonstrated that LY2157299 had little effect on the endogenous TGF-β2 levels. After block-ing autophagy flux with CQ or siATG5, the TGF-β2 level decreased (Fig. 5g).
Lactate was also reported to promote TGF-βsynthesis and MMP2 production in glioma cells [37]. And lactate was associated with autophagy process tightly. We hy-pothesis that autophagy may mediate TGF-β2 autocrine via lactate secretion. In our experiments, lactate synthesis was increased in TGF-β2-stimulated tumor cells however decreased after siATG5 or CQ-treatment (Fig. 5h). And when we added exogenous lactate in cultured tumor cells, results confirmed that lactate could stimulate TGF-β2 and Fig. 5TGF-β2 activates glioma autophagy via Smad dependent and independent pathways, which in turn promote TGF-βautocrine signaling and boost glioma invasion.aThe effects of PI3K kinase inhibitor 3-MA (10μmol/L) and the JNK pathway inhibitor SP600125 (10μmol/L) on TGF-β induced autophagy.bImmunoblots showed autophagy was attenuated in siSmad2-treated tumor cells though treated with TGF-β2.cResults showed level of TGF-β2 autocrine loop after promoting or inhibiting autophagy with Rapamycine or siATG5.dELISA verified TGF-β2 level change after glioma cells treated with rapamycin and ATG5 knock down.eQuantitative reverse transcription-PCR analyses about Smad2, Smad3 and Smad7 which were compared between glioma cells treated with rapamycin, CQ and the TGF-β2 inhibitor LY2157299.fImmunoblots showed that inhibiting the TGF-βpathway with LY2157299 may cause an inefficient EMT.gThe combination of CQ and LY2157299 inhibited autocrine TGF-β2 signaling in glioma cells.hELISA results showed that siSmad2- and siATG5-treated tumor cells exhibited low L-lactate levels after TGF-β2 treatment.
i,jL-lactate promoted glioma EMT marker expression and can be inhibited by CQ. (Student’s t-test; Columns, means of triplicate assays. Bars, SD. *,
MMP2 expression and EMT-related protein changes, however CQ, except for LY2157299, could inhibit this process (Fig. 5i). Therefore, we summarized that TGF-β2 could induced autophagy in glioma via both Smad and non-Smad pathway (JNK pathway), and inhibiting autoph-agy could also in turn mediated endogenous TGF-β2 level in an autocrine fashion which might resulted from the changing of lactate level secreted by glioma cells.
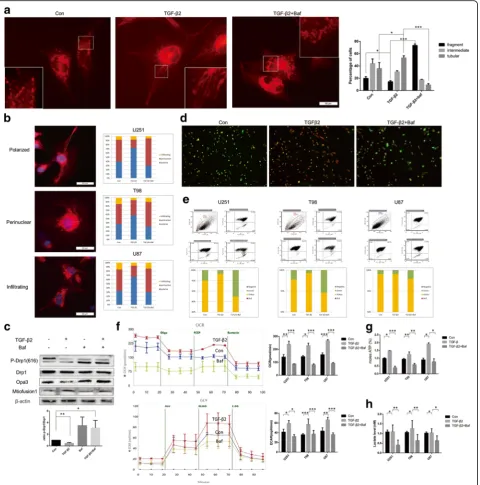
TGF-β2 and autophagy mediated energy mitochondria function of glioma
In addition to the signal pathway activation and invasion related genes variation, there might be other mechanisms leading to the failure of TGF-β2 caused by autophagy in-hibition. As tumor cell invasion is a highly energy- and material-consuming process [23, 24] and autophagy is tightly associated with tumor metabolism [26, 38, 39], We thus hypothesized that TGF-β2-induced autophagy is en-hanced to generate more ATP and materials for invasion. First we introduced the MitoTracker Red probe to observe the mitochondrial morphology and localization. Based on one newly issued research [40], we identified the mito-chondria morphology as fragmented, intermediate and tubular according to the length of the mitochondria (Fig. 6a, Additional file 4: Figure S4a). In our experiment, tubular form was found to be a more favorable form in the cell invasion apex and underwent more trafficking. TGF-β2-treated NTCs favored the tubular mitochondria, whereas autophagy inhibited tumor cells formed more fragmented mitochondria.
Mitochondrial trafficking can also be classified as three forms [41]: perinuclear, polarized and infiltrating (Fig. 6b, Additional file 5: Figure S5a) according to the dis-tance from nuclei to mitochondria. Then TGF-β group showed an increased percentage of the polarized form and Baf group showed more perinuclear form (one-way ANOVA, polarized form, U251 Con 40 ± 2.1% vs TGF 72 ± 6.2% vs Baf 30 ± 5.5% p = 0.019, perinuclei Con 52 ± 3.7% vs TGF 20 ± 4.8% vs Baf 65 ± 6.2%p= 0.026). That indicated Baf stopped TGF-β2 stimulation repro-gramming mitochondrial trafficking to fuel tumor cell invasion at a long distance (Fig. 6b).
Apart from above two factors, mitochondrial mem-brane potential (△Ψm) is also a vital factor for ATP generation. We used a JC-1 probe to detect the changes
of △Ψm in mitochondria. JC-1 probe is an ideal probe
that forms J-aggregates with red fluorescence in high △Ψm conditions and J-monomers with green fluores-cence in low △Ψm conditions [42]. We observed red fluorescence increasing after TGF-β2 treatment in NTCs and green fluorescence enhancing in Baf treatment tumor cells though also treated with TGF-β2 (Fig. 6c, Additional file 5: Figure S5b). This phenomenon was confirmed by flow cytometry (FCM): one-way ANOVA,
green percentage, U251 Con 4.55 ± 3.26% vs TGF 1.82 ± 0.67% vs Baf 15.55 ± 3.28%p= 0.038 (Fig. 6d).
As we could observe the changes of mito-fussion and fission in TGF-β2 and Baf treated groups, the exact mo-lecular signal pathway were also explored by Western blot according to related studies [40, 43]. Results indi-cated that the phosphorylation of Drp1 and the expres-sion of Opa3 and Mitofuexpres-sion1 was responsible for the effect (Fig. 6e).
Besides the mitochondria changing, tumor cells were also characterized for aerobic glycolysis (Warburg-like metabolism). We thus recurred to XFe24 analysis (Seahorse) and found that TGF-β2 also altered metab-olism program towards to aerobic glycolysis which re-sulted in a higher consumption rate of oxygen (OCAR) and an increased extracellular acidification (ECAR) to sus-tain ATP providing and then inhibiting autophagy could block this process (Fig. 6f). ATP assay kit and L-lactate testing kit also confirmed the same results (Fig. 6g, h). These results above provided a further explanation for how inhibiting autophagy might impair TGF-β2-stimulated glioma invasion: the mitochondria relocalization, morpho-logical changes, down regulation in membrane potential and aerobic glycolysis reprogramming.
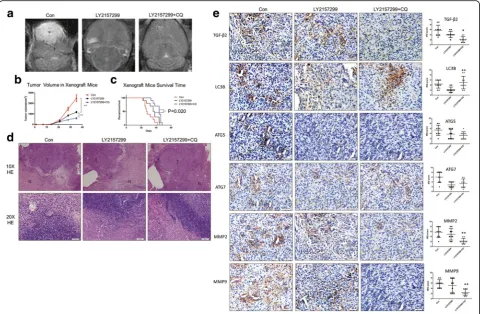
In vivo xenograft models demonstrated that treatment with combined TGF-β2 and autophagy inhibition provides more benefits than galunisertib single application
finding provides additional evidence that TGF-βmay par-tially act via autophagy to function in glioma invasion.
Discussion
In the present study, we explored one finding that TGF-β2 was highly expressed and correlated with LC3B in clinical samples. And in vitro, TGF-β2 induced autoph-agy in glioma cell lines in a time- and dose-dependent fashion. As TGF-βis an abundant component of the gli-oma tumor microenvironment, our research may provide another explanation as to why high levels of LC3B expres-sion are usually found in high grade gliomas. In addition to hypoxia and starvation, TGF-β2 and other cytokines (IL-2, IL-6, TNF-α, IFN-γ) may potentially promote gli-oma autophagy. Much research has been focused on cyto-kines and autophagy [45, 46], however few answered the question that what was the meaning of cytokine-initiated autophagy.
Our study demonstrated that autophagy flux is vital for TGF-β-induced glioma invasion and we attributed partial reasons to the failure of EMT, which should increase with TGF-β2 stimulation. Reasonablely illustration in our study was that autophagy blockage suppressed EMT-related protein expression and also decreased the level of L-lactate which induces TGF-β2 autocrine and promotes EMT marker expression. Moreover, other researchers have also reported that autophagy-related genes such as BECN1 and SQSTM1 are associated with EMT [47, 48]. These findings provide a new opportunity for discussing the EMT under autophagy during tumor invasion. How-ever, the exact mechanism by which autophagy influences the EMT is mysterious, and further exploration needs to be done in the future.
In addition to EMT, autophagy and TGF-β are both broadly involved in tumor metabolism. Tumor invasion is a high-energy-consumption process, so the ATP Fig. 7LY2157299 combined with CQ improved the outcome of glioma compared to treatment with only LY2157299 or CQ in vivo.aIn vivo
experiments show that the combination of LY2157299 (75 mg/kg/d) and CQ (25 mg/kg/d) had better capacity to inhibit glioma invasive behavior and proliferation monitored and measured by 3T MRI.bTumor volume monitored by MRI and calculated, results showed that the combination group got the smallest tumor volume than single LY2157299 group and control group (Student’s t-test; Columns, means of triplicate assays. Bars, SD. *,P< 0.05; ***,
P< 0.001).cLog-rank (Mantel-Cox) test demonstrated the LY2157299/CQ group brought a longer survival time compared to LY2157299 group (P=0.02).
generation failure induced by autophagy inhibition may also explain the deficiencies in tumor invasion (Fig. 6g, h). Here is our hypothesis that tumor cells evolved to allow TGF-βto activate autophagy as TGF-βboosted metabol-ism as well as large reactive oxygen species (ROS) produc-tion [49] and if there was no factor eliminating ROS promptly, tumor cells would soon apoptosis for mitochon-dria damage. Besides, there was a long debate about mito-chondrial fusion and fission, including which process is more favorable for tumor invasion and metabolism. Inter-estingly, TGF-β promotes glioma invasion and elevates ATP generation, causing increased fusion forms of mito-chondria. Although we have determined some proteins (Drp1, Opa3 and Mitofusion1) of mitochondira conver-sion which TGF-βtargeted on, a lot of work still need to be done to enrich the outline of the process. Autophagy may have a larger role in tumor invasion that has yet not to be determined.
The two main downstream pathways of TGF-βsignaling are the Smad-dependent and Smad-independent pathways [31, 50]. In our study, both were found to participate in TGF-β2-induced autophagy in glioma (Fig. 5a, c). TGF-β activates the PI3K-Akt-mTOR pathway during the TGF-β -induced EMT, however the phosphorylation of mTOR usually inhibits autophagy. TGF-βmay play both stimula-tory and inhibistimula-tory roles in autophagy. But at least in U251 cells, the autophagy stimulation by the Smad and JNK pathways may outweigh the antiautophagic effect of mTOR. Whether this change from an inhibitory role to a stimulatory role in autophagy indicates that the TGF-β changes from functioning as a tumor suppressor to tumor promoter also needs more exploration.
We knew that the TGF-β effects on glioma require sustained autocrine pathway activation [31]. Therefore, we explored the effect of autophagy flux in cytokines’ autocrine loop. Our results demonstrated that autophagy inhibitors mediated TGF-β expression in mRNA levels (Fig. 5e). Experiments (Fig. 5h) also proved that the in-creased amounts of metabolic products resulting from enhanced autophagy (lactate) leads to increased auto-crine TGF-β2 levels. According to these results, TGF-β pathway might influence the invasive behaviors of tumor cells via TGF-β-autophagy-lactate-TGF-β loop. LY2157299 was a newly identified TβRI inhibitor with phase III clinical trials. However, in glioma LY2157299 showed little effect on the TGF-β2 autocrine level, which may result in keeping the tumor cells in a favorable microenvironment that tends to promote oncogenesis. Thus, we advised to administer a combined treatment of LY2157299 and CQ to mice, based on the tumor xeno-graft models results.
In clinical trials, it is still controversial that LC3B is as-sociated with the grade of the glioma. High LC3B expres-sion of LC3B sometimes is associated with an improved
outcome for patients with poorer performance. For pa-tients with normal performance, survival was better for patients with lower LC3B staining [51]. We found that TGF-β2 and LC3B dual positive patients had distinctly shorter survival times than TGF-β2 positive and LC3B negative patients. We hypothesize that the autophagy level may be a valid predictor of patient prognosis only in pa-tients whose IHC showed both TGF-β2 and LC3B stain-ing. Many factors can influence autophagy, and possibly only when autophagy was mainly activated by cytokines rather than other factors, autophagy was an effective pre-dictor. Another explanation is that TGF-β2 only induces glioma autophagy when it reaches a certain level in the tumor microenvironment. Therefore, LC3B positive stain-ing usually indicates a higher level of TGF-β2 in glioma, leading to a poor outcome. These hypotheses was verified primarily with statistical results. However, whether other cytokines are coordinated with these results and whether this could be a widely used phenomenon remain interest-ing, unanswered questions.
Overall, our work provides a novel role for autophagy in TGF-β2-induced glioma invasion that potentially oc-curs through the regulation of energy metabolism and autocrine TGF-β(mode pattern Additional file 7: Figure S7). The functional alteration of TGF-β from a tumor suppressor to a tumor promoter may be associated with autophagy. Furthermore, the combination of TGF-βand autophagy inhibitors improves disease in vivo, which may in turn guide the application of CQ in clinical cases. More generally, this study resulted in a systematic iden-tification of cytokines and autophagy, which can also be used for similar studies.
Conclusion
Our findings elucidated a potential mechanism of autophagy-associated glioma invasion that TGF-β2 could initiate autophagy via Smad and non-Smad pathway to promote glioma cells’invasion. During this process, the alteration of epithelial-mesenchymal transition and me-tabolism conversion were considered to involved in. And based on this study, we believe a new approche to cure glioma could be found and new opinion could be in-spired to refresh our view about cancer.
Additional files
Additional file 1: Figure S1.The human primers used in Fig. 4a were listed in this supplementary figure. (TIFF 2375 kb)
Additional file 2: Figure S2.athe results of TEM in other two cell lines (U87 and T98) showing the similar phenomenon with U251.bthe results of woud healing in other two cell lines (U87 and T98) showing the similar phenomenon with U251. (TIFF 3664 kb)
Additional file 4: Figure S4.The exact value of qPRC test in Figure 4a, and resutls were caculated by t-test. (TIFF 1768 kb)
Additional file 5: Figure S5.The figures of mitotracker and JC-1 probe in other two cell lines (U87 and T98) showing the similar phenomenon with U251. (TIFF 5335 kb)
Additional file 6: Figure S6.ImageJ was introduced to assess the western blot results in in Fig. 2a & b in U251, T98, U87 cells. Columns, means of triplicate assays. Bars, SD; (TIFF 1261 kb)
Additional file 7: Figure S7.Modern pattern of the whole research showing that autophagy-associated glioma invasion that TGF-β2 could initiate autophagy via Smad and non-Smad pathway to promote glioma cells’invasion. (TIFF 1134 kb)
Abbreviations
AA:Astrocytoma; Baf: Bafilomycin A1; CQ: Chloroquine; DMSO: Dimethyl sulfoxide; EMT: Epithelial-mesenchymal transition; GBM: Glioblastoma multiforme; JNK: c-Jun NH2-terminal kinase; mTOR: Mammalian target of rapamycin; NTC: Normal tumor cell; Rapa: Rapamycin
Acknowledgements
The authors thank Yu Hou for editorial assistance and Shuo Xu for assistance in statistical analyses.
Grant support
This work was supported by Natural Science Foundation of China Grant (81,502,164, 81,402,060 and 81,572,487), the Shandong Provincial Natural Science Foundation Grant (BS2015YY004 and BS2014YY033), the Special foundation for Taishan Scholars (No.ts20110814, tshw201502056), the Fundamental Research Funds of Shandong University, the Department of Science & Technology of Shandong Province (2015GGE27101 and 2015ZDXX0801A01), the University of Bergen, the Helse Bergen, Norway and the Norwegian Centre for International Cooperation in Education (SIU)(UTF-2014/10047).
Authors’contributions
CZ wrote the main part of the essay including experiment results, methods and materials, abstract and JW wrote the part of introduction and XGL wrote the part of discussion. AJC analyzed data for the microarray. CZ conducted the western blot, the qRT-PCR, the ELISA and eXF24 analysis assay in Fig. 2, Fig. 3 and Fig. 6, XZ and RX conducted the in vitro tube formation assay. AJC conducted the immunofluorescence in Figs. 1, 3 and Fig. 4, CL conducted the electron transmission microscope, and BH conducted tumor xenograft model and analysis the data. All authors reviewed the manuscript. All authors read and approved the final manuscript.
Competing interests
The authors declare that they have no competing interests.
Publisher’s Note
Springer Nature remains neutral with regard to jurisdictional claims in published maps and institutional affiliations.
Author details
1Department of Neurosurgery, Qilu Hospital of Shandong University, 107
Wenhua Western Rd, Jinan, Shandong 250012, China.2Brain Science
Research Institute, Shandong University, 44 Wenhuaxi Road, Jinan, China.
3Department of Biomedicine, University of Bergen, Bergen, Norway.
Received: 27 June 2017 Accepted: 29 October 2017
References
1. Ricard D, Idbaih A, Ducray F, Lahutte M, Hoang-Xuan K, Delattre J-Y. Primary brain tumours in adults. Lancet. 2012;379:1984–96.
2. Cloughesy TF, Cavenee WK, Mischel PS. Glioblastoma: from molecular pathology to targeted treatment. Annu Rev Pathol-Mech. 2014;9:1–25. 3. Owonikoko TK, Arbiser J, Zelnak A, Shu H-KG, Shim H, Robin AM, Kalkanis
SN, Whitsett TG, Salhia B, Tran NL. Current approaches to the treatment of metastatic brain tumours. Nat Rev Clin Oncol. 2014;11:203–22.
4. Friedl P, Locker J, Sahai E, Segall JE. Classifying collective cancer cell invasion. Nat Cell Biol. 2012;14:777–83.
5. Gao D, Vahdat LT, Wong S, Chang JC, Mittal V. Microenvironmental regulation of epithelial–mesenchymal transitions in cancer. Cancer Res. 2012;72:4883–9.
6. Scheel C, Weinberg RA. Cancer stem cells and epithelial–mesenchymal transition: concepts and molecular links. Semin Cancer Biol. 2012;22:396–403. 7. Bhat KP, Balasubramaniyan V, Vaillant B, Ezhilarasan R, Hummelink K,
Hollingsworth F, Wani K, Heathcock L, James JD, Goodman LD. Mesenchymal differentiation mediated by NF-κB promotes radiation resistance in glioblastoma. Cancer Cell. 2013;24:331–46.
8. Joseph JV, Balasubramaniyan V, Walenkamp A, Kruyt FA. TGF-βas a therapeutic target in high grade gliomas–promises and challenges. Biochem Pharmacol. 2013;85:478–85.
9. Joseph J, Conroy S, Tomar T, Eggens-Meijer E, Bhat K, Copray S, Walenkamp A, Boddeke E, Balasubramanyian V, Wagemakers M. TGF-βis an inducer of ZEB1-dependent mesenchymal transdifferentiation in glioblastoma that is associated with tumor invasion. Cell Death Dis. 2014;5:e1443.
10. Kahlert U, Nikkhah G, Maciaczyk J. Epithelial-to-mesenchymal (−like) transition as a relevant molecular event in malignant gliomas. Cancer Lett. 2013;331:131–8. 11. Pala A, Karpel-Massler G, Kast RE, Wirtz CR, Halatsch M-E. Epidermal to
mesenchymal transition and failure of EGFR-targeted therapy in glioblastoma. Cancers. 2012;4:523–30.
12. de Castro JV, Gonçalves CS, Costa S, Linhares P, Vaz R, Nabiço R, Amorim J, Viana-Pereira M, Reis RM, Costa BM. Impact of TGF-β1-509C/T and 869T/ C polymorphisms on glioma risk and patient prognosis. Tumor Biol. 2015; 36:6525–32.
13. Kim Y. Regulation of cell proliferation and migration in glioblastoma: new therapeutic approach. Front Oncol. 2013;3:53.
14. Bruna A, Darken RS, Rojo F, Ocaña A, Peñuelas S, Arias A, Paris R, Tortosa A, Mora J, Baselga J. High TGFβ-Smad activity confers poor prognosis in glioma patients and promotes cell proliferation depending on the methylation of the PDGF-B gene. Cancer Cell. 2007;11:147–60. 15. Jachimczak P, Hessdörfer B, Fabel-Schulte K, Wismeth C, Brysch W,
Schlingensiepen KH, Bauer A, Blesch A, Bogdahn U. Transforming growth factor-β-mediated autocrine growth regulation of gliomas as detected with phosphorothioate antisense oligonucleotides. Int J Cancer. 1996;65:332–7. 16. Kjellman C, Olofsson SP, Hansson O, Von Schantz T, Lindvall M, Nilsson I,
Salford LG, Sjögren HO, Widegren B. Expression of TGF-βisoforms, TGF-β receptors, and SMAD molecules at different stages of human glioma. Int J Cancer. 2000;89:251–8.
17. Maxwell M, Galanopoulos T, Neville-Golden J, Antoniades HN. Effect of the expression of transforming growth factor-β2 in primary human glioblastomas on immunosuppression and loss of immune surveillance. J Neurosurg. 1992;76:799–804.
18. Bogdahn U, Hau P, Stockhammer G, Venkataramana N, Mahapatra A, Suri A, Balasubramaniam A, Nair S, Oliushine V, Parfenov V. Targeted therapy for high-grade glioma with the TGF-β2 inhibitor trabedersen: results of a randomized and controlled phase IIb study. Neuro-Oncology. 2011;13:132–42.
19. Hau P, Jachimczak P, Schlaier J, Bogdahn U. TGF-β2 signaling in high-grade gliomas. Curr Pharm Biotechnol. 2011;12:2150–7.
20. Platten M, Wick W, Weller M. Malignant glioma biology: role for TGF-βin growth, motility, angiogenesis, and immune escape. Microsc Res Techniq. 2001;52:401–10.
21. Kiyono K, Suzuki HI, Matsuyama H, Morishita Y, Komuro A, Kano MR, Sugimoto K, Miyazono K. Autophagy is activated by TGF-beta and potentiates TGF-beta-mediated growth inhibition in human hepatocellular carcinoma cells. Cancer Res. 2009;69:8844–52.
22. Mizushima N, Levine B. Autophagy in mammalian development and differentiation. Nat Cell Biol. 2010;12:823–30.
23. Bettum IJ, Gorad SS, Barkovskaya A, Pettersen S, Moestue SA, Vasiliauskaite K, Tenstad E, Øyjord T, Risa Ø, Nygaard V. Metabolic reprogramming supports the invasive phenotype in malignant melanoma. Cancer Lett. 2015;366:71–83.
24. O. Keunen, M. Johansson, A. Oudin, M. Sanzey, S.A.A. Rahim, F. Fack, F. Thorsen, T. Taxt, M. Bartos, R. Jirik, Anti-VEGF Treatment reduces blood supply and increases tumor cell invasion in glioblastoma, Proc Natl Acad Sci U S A, 108 (2011) 3749–3754.
26. Guo JY, Xia B, White E. Autophagy-mediated tumor promotion. Cell. 2013; 155:1216–9.
27. Aoki H, Kondo Y, Aldape K, Yamamoto A, Iwado E, Yokoyama T, Hollingsworth EF, Kobayashi R, Hess K, Shinojima N, Shingu T, Tamada Y, Zhang L, Conrad C, Bogler O, Mills G, Sawaya R, Kondo S. Monitoring autophagy in glioblastoma with antibody against isoform B of human microtubule-associated protein 1 light chain 3. Autophagy. 2008;4:467–75. 28. Winardi D, Tsai HP, Chai CY, Chung CL, Loh JK, Chen YH, Hsieh CL.
Correlation of altered expression of the autophagy marker LC3B with poor prognosis in astrocytoma. Biomed Res Int. 2014;2014:723176.
29. Weber DC, Tille J-C, Combescure C, Egger J-F, Laouiti M, Hammad K, Granger P, Rubbia-Brandt L, Miralbell R. The prognostic value of expression of HIF1alpha, EGFR and VEGF-A, in localized prostate cancer for intermediate-and high-risk patients treated with radiation therapy with or without androgen deprivation therapy. Radiat Oncol. 2012;7:1748–17. 30. Klionsky DJ, Abdalla FC, Abeliovich H, Abraham RT, Acevedo-Arozena A,
Adeli K, Agholme L, Agnello M, Agostinis P, Aguirre-Ghiso JA. Guidelines for the use and interpretation of assays for monitoring autophagy. Autophagy. 2012;8:445–544.
31. Ikushima H, Todo T, Ino Y, Takahashi M, Miyazawa K, Miyazono K. Autocrine TGF-βsignaling maintains tumorigenicity of glioma-initiating cells through Sry-related HMG-box factors. Cell Stem Cell. 2009;5:504–14.
32. Wick W, Platten M, Weller M. Glioma cell invasion: regulation of metalloproteinase activity by TGF-β. J Neuro-Oncol. 2001;53:177–85. 33. Forsyth P, Wong H, Laing T, Rewcastle N, Morris D, Muzik H, Leco K,
Johnston R, Brasher P, Sutherland G. Gelatinase-A (MMP-2), gelatinase-B (MMP-9) and membrane type matrix metalloproteinase-1 (MT1-MMP) are involved in different aspects of the pathophysiology of malignant gliomas. Brit J Cancer. 1999, 1828;79
34. Sawaya RE, Yamamoto M, Gokaslan ZL, Wang SW, Mohanam S, Fuller GN, McCutcheon IE, Stetler-Stevenson WG, Nicolson GL, Rao JS. Expression and localization of 72 kDa type IV collagenase (MMP-2) in human malignant gliomas in vivo. Clin Exp Metastatis. 1996;14:35–42.
35. Wang RC, Wei Y, An Z, Zou Z, Xiao G, Bhagat G, White M, Reichelt J, Levine B. Akt-mediated regulation of autophagy and tumorigenesis through Beclin 1 phosphorylation. Science. 2012;338:956–9.
36. Williams A, Sarkar S, Cuddon P, Ttofi EK, Saiki S, Siddiqi FH, Jahreiss L, Fleming A, Pask D, Goldsmith P. Novel targets for Huntington's disease in an mTOR-independent autophagy pathway. Nat Chem Biol. 2008;4:295–305. 37. Baumann F, Leukel P, Doerfelt A, Beier CP, Dettmer K, Oefner PJ,
Kastenberger M, Kreutz M, Nickl-Jockschat T, Bogdahn U, Bosserhoff AK, Hau P. Lactate promotes glioma migration by TGF-beta2-dependent regulation of matrix metalloproteinase-2. Neuro-Oncology. 2009;11:368–80. 38. Jin S. Autophagy, mitochondrial quality control, and oncogenesis.
Autophagy. 2006;2:80–4.
39. van der Schaft DW, Hillen F, Pauwels P, Kirschmann DA, Castermans K, Egbrink MG, Tran MG, Sciot R, Hauben E, Hogendoorn PC, Delattre O, Maxwell PH, Hendrix MJ, Griffioen AW. Tumor cell plasticity in Ewing sarcoma, an alternative circulatory system stimulated by hypoxia. Cancer Res. 2005;65:11520–8.
40. Xie Q, Wu Q, Horbinski CM, Flavahan WA, Yang K, Zhou W, Dombrowski SM, Huang Z, Fang X, Shi Y, Ferguson AN, Kashatus DF, Bao S, Rich JN. Mitochondrial control by DRP1 in brain tumor initiating cells. Nat Neurosci. 2015;18:501–10.
41. Caino MC, Ghosh JC, Chae YC, Vaira V, Rivadeneira DB, Faversani A, Rampini P, Kossenkov AV, Aird KM, Zhang R. PI3K therapy reprograms mitochondrial trafficking to fuel tumor cell invasion. Proc Natl Acad Sci U S A. 2015;112: 8638–43.
42. Gao Y, Su Y, Qu L, Xu S, Meng L, Cai S-Q, Shou C. Mitochondrial apoptosis contributes to the anti-cancer effect of Smilax Glabra Roxb. Toxicol Lett. 2011;207:112–20.
43. Ryu SW, Yoon J, Yim N, Choi K, Choi C. Downregulation of OPA3 is responsible for transforming growth factor-beta-induced mitochondrial elongation and F-actin rearrangement in retinal pigment epithelial ARPE-19 cells. PLoS One. 2013;8:e63495.
44. Rosenfeld MR, Ye X, Supko JG, Desideri S, Grossman SA, Brem S, Mikkelson T, Wang D, Chang YC, Hu J, McAfee Q, Fisher J, Troxel AB, Piao S, Heitjan DF, Tan KS, Pontiggia L, O'Dwyer PJ, Davis LE, Amaravadi RK. A phase I/II trial of hydroxychloroquine in conjunction with radiation therapy and concurrent and adjuvant temozolomide in patients with newly diagnosed glioblastoma multiforme. Autophagy. 2014;10:1359–68.
45. Bhutia SK, Dash R, Das SK, Azab B, Su Z-z, Lee S-G, Grant S, Yacoub A, Dent P, Curiel DT. Mechanism of autophagy to apoptosis switch triggered in prostate cancer cells by antitumor cytokine melanoma differentiation-associated gene 7/interleukin-24. Cancer Res. 2010;70:3667–76.
46. Harris J, De Haro SA, Master SS, Keane J, Roberts EA, Delgado M, Deretic V. T helper 2 cytokines inhibit autophagic control of intracellular mycobacterium tuberculosis. Immunity. 2007;27:505–17.
47. Bertrand M, Petit V, Jain A, Amsellem R, Johansen T, Larue L, Codogno P, Beau I. SQSTM1/p62 regulates the expression of junctional proteins through epithelial-mesenchymal transition factors. Cell Cycle. 2015;14:364–74. 48. Cicchini M, Chakrabarti R, Kongara S, Price S, Nahar R, Lozy F, Zhong H,
Vazquez A, Kang Y, Karantza V. Autophagy regulator BECN1 suppresses mammary tumorigenesis driven by WNT1 activation and following parity. Autophagy. 2014;10:2036–52.
49. Youle RJ, van der Bliek AM. Mitochondrial fission, fusion, and stress. Science. 2012;337:1062–5.
50. Siegel PM, Massagué J. Cytostatic and apoptotic actions of TGF-βin homeostasis and cancer. Nat Rev Cancer. 2003;3:807–20. 51. Aoki H, Kondo Y, Aldape K, Yamamoto A, Iwado E, Yokoyama T,
Hollingsworth EF, Kobayashi R, Hess K, Shinojima N. Monitoring autophagy in glioblastoma with antibody against isoform B of human microtubule-associated protein 1 light chain 3. Autophagy. 2008;4:467–75.
• We accept pre-submission inquiries
• Our selector tool helps you to find the most relevant journal • We provide round the clock customer support
• Convenient online submission • Thorough peer review
• Inclusion in PubMed and all major indexing services • Maximum visibility for your research
Submit your manuscript at www.biomedcentral.com/submit