R E S E A R C H A R T I C L E
Open Access
Bayesian probit regression model for the
diagnosis of pulmonary fibrosis: proof-of-principle
Eric B Meltzer
1, William T Barry
2,3, Thomas A D
’
Amico
4, Robert D Davis
4, Shu S Lin
4,5,6, Mark W Onaitis
4,
Lake D Morrison
1, Thomas A Sporn
6, Mark P Steele
1and Paul W Noble
1*Abstract
Background:The accurate diagnosis of idiopathic pulmonary fibrosis (IPF) is a major clinical challenge. We developed a model to diagnose IPF by applying Bayesian probit regression (BPR) modelling to gene expression profiles of whole lung tissue.
Methods:Whole lung tissue was obtained from patients with idiopathic pulmonary fibrosis (IPF) undergoing surgical lung biopsy or lung transplantation. Controls were obtained from normal organ donors. We performed cluster analyses to explore differences in our dataset. No significant difference was found between samples obtained from different lobes of the same patient. A significant difference was found between samples obtained at biopsy versus explant. Following preliminary analysis of the complete dataset, we selected three subsets for the development of diagnostic gene signatures: the first signature was developed from all IPF samples (as compared to controls); the second signature was developed from the subset of IPF samples obtained at biopsy; the third signature was developed from IPF explants. To assess the validity of each signature, we used an independent cohort of IPF and normal samples. Each signature was used to predict phenotype (IPF versus normal) in samples from the validation cohort. We compared the models’predictions to the true phenotype of each validation sample, and then calculated sensitivity, specificity and accuracy.
Results:Surprisingly, we found that all three signatures were reasonably valid predictors of diagnosis, with small differences in test sensitivity, specificity and overall accuracy.
Conclusions:This study represents the first use of BPR on whole lung tissue; previously, BPR was primarily used to develop predictive models for cancer. This also represents the first report of an independently validated IPF gene expression signature. In summary, BPR is a promising tool for the development of gene expression signatures from non-neoplastic lung tissue. In the future, BPR might be used to develop definitive diagnostic gene signatures for IPF, prognostic gene signatures for IPF or gene signatures for other non-neoplastic lung disorders such as bronchiolitis obliterans.
Background
Pulmonary fibrosis is a significant cause of morbidity and mortality worldwide [1,2]. The multiple subtypes of pulmonary fibrosis carry different prognoses. Idiopathic pulmonary fibrosis (IPF), for example, is a particularly fatal subtype of pulmonary fibrosis that leads to death within 3-5 years of its diagnosis; IPF does not usually
respond to immunosuppressant therapy [3-5].
Nonspecific interstitial pneumonia (NSIP) is another subtype of pulmonary fibrosis that has much better rates of survival and treatment response [2,6]. All together, there are perhaps 200 subtypes of pulmonary fibrosis [7]. The American Thoracic Society and Eur-opean Respiratory Society published a classification scheme that describes the major subtypes of pulmonary fibrosis [2]. Other authors describe complex algorithms for making an accurate diagnosis of pulmonary fibrosis [7-9].
An accurate diagnosis of pulmonary fibrosis requires the integration of clinical, radiographic and pathologic information [3,10]. Yet, there is no single test by which * Correspondence: [email protected]
1Department of Medicine, Division of Pulmonary, Allergy and Critical Care
Medicine, Department of Medicine, Duke University Medical Center, Durham, North Carolina, USA
Full list of author information is available at the end of the article
an accurate diagnosis of pulmonary fibrosis can be secured. The complexity of diagnostic algorithms makes it difficult to establish an accurate diagnosis of pulmon-ary fibrosis outside of the academic setting [11,12]. This increases the risk for inaccurate diagnoses and the administration of inappropriate treatments. For the pur-poses of this study, we focused on IPF. The goal of this study was to assess methods by which a diagnostic test for IPF could be developed.
Bayesian probit regression (BPR) is a statistical method, well-suited to the analysis of highly dimensional data such as that produced by gene expression profiling. In the past, BPR was used to model differences in gene expression detected in cases of prostate cancer and ovarian cancer [13,14]. BPR has never been used to ana-lyze non-neoplastic lung tissue.
The experiments described herein were designed as a proof-of-principle for the concept of “developing IPF gene expression signatures with BPR”. Our aims were to develop a provisional diagnostic model for IPF; and to establish BPR as an appropriate method for developing additional gene signatures for non-neoplastic lung disease.
Methods Ethics Statement
This study was approved by the Duke University Health System Institutional Review Board (IRB # Pro00007903, Pro00008725 and Pro00008819) and written informed consent was obtained from all subjects.
Study Population
We selected consecutive patients with IPF. Specimens were collected from 11 patients. All cases fulfilled multi-disciplinary diagnostic criteria described in the Ameri-can Thoracic Society/European Respiratory Society consensus statement [3]. In addition, pathological firmation was obtained for every case. IPF was con-firmed by the identification of a usual interstitial pneumonia (UIP) under the light microscope.
Samples of whole lung tissue were obtained at the time of diagnostic surgical lung biopsy (6 cases) or dur-ing orthotopic lung transplantation surgery (5 cases). Specimens were collected from both the upper and lower lobes whenever possible (6 out of 11 cases).
Control specimens (6 cases) were obtained from donated organs that were accepted for lung transplanta-tion. At the end of lung transplant surgeries, we collected a portion of the newly transplanted lung that was removed during the process of routine lung volume reduction.
Sample Processing
Samples were immediately processed following removal from the body. First, specimens were cut into small
pieces (< 5 mm in diameter), immersed in RNAlater solution (Ambion, Inc., Austin, TX) and incubated over-night at 4°C as per the manufacturer’s instructions. Next, the supernatant was removed and samples were stored in a -20°C freezer.
At a later date, frozen RNA-protected samples were homogenized with a FastPrep device by using Lysing Matrix A (MP Biomedicals, Solon, OH). Total RNA was extracted from the homogenates by using RNAqu-eous-4PCR kits (Ambion, Inc., Austin, TX) as per the manufacturer’s instructions. RNA quantity was mea-sured with a spectrophotometer and RNA quality was assessed with a bioanalyzer (Agilent Technologies, Santa Clara, CA).
Isolated RNA was used to produce labeled-cRNA. Then labeled-cRNA was hybridized to Affymetrix Human Genome U133 Plus 2.0 GeneChips; and scanned using standard Affymetrix protocols. Our complete data-set is available through the Gene Expression Omnibus database (http://www.ncbi.nlm.nih.gov/geo/; accession number GSE24206).
Validation Cohort
The dataset for the validation cohort was accessioned from the Gene Expression Omnibus (http://www.ncbi. nlm.nih.gov/geo/; accession number GSE10667). This dataset contains raw and processed gene expression pro-files from thirty-one patients with IPF and 15 expression profiles from normal lung controls. This data was con-tributed to the Gene Expression Omnibus by investiga-tors at the University of Pittsburgh; these samples were previously described [15,16]. This dataset was generated on Agilent-014850 Whole Human Genome 4 × 44K Microarrays according to the manufacturer’s protocol as reported by the original investigators.
Statistical Analysis Data processing
Expression estimates for the Affymetrix U133 Plus 2.0 GeneChips were obtained by robust multi-array average (RMA) then log2 transformed [17-19]. Data were filtered prior to analysis to annotated probe sets with average expression values > 4.
Unsupervised cluster analysis
Global patterns of gene expression were evaluated (with the top 10% of genes by coefficient of variation) by Prin-cipal Component Analysis (PCA) and hierarchical clus-tering algorithms using the average linkage of the Pearson correlation coefficient.
Differential gene expression
Supervised classification
Multi-gene models for binary phenotypes were derived using singular value decomposition (SVD) and Bayesian probit regression models, as described previously [13,14,20]. In tuning the model parameters, a data-dri-ven empirical approach was taken to select the optimal number of features in each gene signature, using the sum of deviances as a metric of relative performance. For a complete description, refer to Additional file 1, Supplemental Methods and Additional file 2, Figure S1.
Validation
To independently validate the multi-gene models, fea-tures were mapped on a many-by-many basis between the training dataset (Affymetrix HGU133 Plus 2.0) and GSE10667 dataset (Agilent-014850 Whole Human Gen-ome 4 × 44K Microarray) using Unigene and RefSeq IDs (Additional files 3, 4 and 5, Tables S1-S3). Gene expression estimates were scale/shift normalized across the datasets, and loadings from the SVD were derived from the training dataset only, such that predicted prob-abilities from the Bayesian regression model are inde-pendent for the validation set. Association with the phenotype of IPF versus normal control was assessed using a Wilcoxon rank sum test, and the predictive value of the signature was evaluated using receiver operator characteristic (ROC) curves.
Computational Software
All microarray pre-processing, BPR modeling and ana-lyses were performed using R version 2.9 and Biocon-ductor packages designed for use with Affymetrix microarray data (Additional file 6, Software Codes). Gra-phical images were produced in R and in MATLAB R2009a (The MathWorks, Inc., Natick, MA).
Results Patients
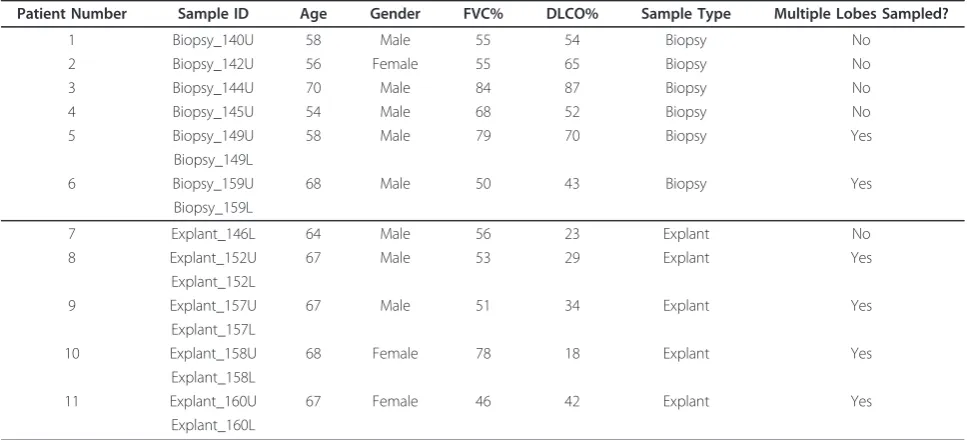
Demographic and physiologic characteristics of the 11 patients enrolled in this study are reported in Table 1. Each patient underwent either a medically-indicated sur-gical lung biopsy or medically-indicated lung transplan-tation surgery; remnants of the biopsy sample or pieces of the explanted lung were preserved for microarray analysis. Physiologic measurements were made prior to surgery. When we compared biopsy to explant, we found no differences in the average age of patients (60.67 ± 2.72 to 66.6 ± 0.68); the proportion of males (83% versus 60%); or the forced vital capacity (65.17 ± 5.75 to 56.8 ± 5.54). However, diffusing capacity for car-bon monoxide was decreased in patients undergoing lung transplantation surgery (61.83 ± 6.38 to 29.2 ± 4.19, p-value < 0.01) which is statistically significant in this patient cohort.
Global Analysis of Gene Expression
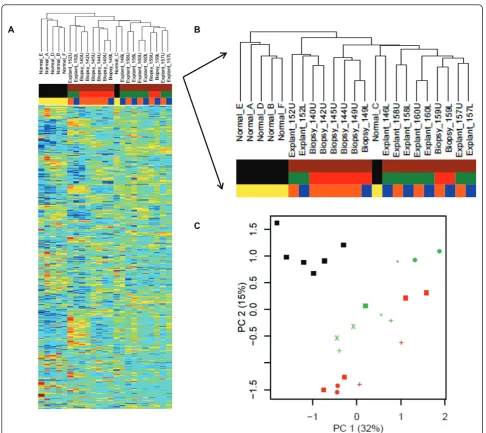
To explore gene expression differences (and similarities) between all of the samples, we carried out an unsuper-vised hierarchical cluster of the entire dataset (Figure 1A). The dataset contains gene expression from 23 sam-ples: 17 samples of IPF from 11 different patients (6 pairs of samples from upper and lower lobes; and 5 samples of single lobes); and 6 samples from normal lung donors. Examining the hierarchical dendrogram (Figure 1B), we found a natural separation between IPF samples and normal lung samples (normals are found on the left-hand side of the figure; IPF samples fall in the middle and on the right-hand side of the dendro-gram), with the exception of one outlier, a sample of normal lung (Normal_C) which falls among the IPF samples.
We further observed that pairs of samples from the upper and lower lobes have similar global gene expres-sion profiles, such that each pair forms its own node in the hierarchical cluster. In order to meet the assump-tions of independent and identically distributed samples for developing signatures of IPF, we chose to use only one sample (the upper lobe, when available) per patient in the subsequent analyses.
Finally, we observed that explanted samples and biop-sied samples largely segregate in the hierarchical clusters with the exceptions of: one pair of biopsied samples (Biopsy_159U and Biopsy_159L) and one normal sample (Normal_C) falling in the explant cluster; and a pair of explants (Explant_152U and Explant_152L) which fall in the biopsy cluster.
To further evaluate global differences in gene sion, we decomposed the high-dimensional gene expres-sion data using principal component analysis (PCA), whereby 47% of the variance in this dataset is captured within the first two principal components for all 23 samples. Again, we found that normal and IPF samples are distinctive (Figure 1C). Furthermore, a separation was seen between the biopsied IPF samples and the explants. Meanwhile, the upper/lower lobe pairs showed strong similarity (average Pearson correlation of 0.929) as compared to unmatched pairs (average Pearson cor-relation of 0.781).
Comparing Gene Expression from the Upper and Lower Lobes
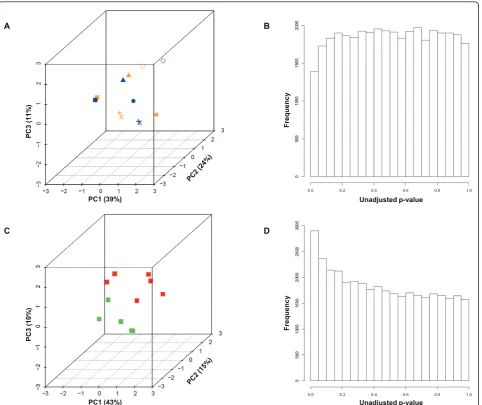
the patient (intraclass correlation coefficient = 0.474, p-value = 0.02 [for the first principal component]).
To identify genes that might be differentially expressed between the upper and lower lobes, we per-formed a paired LIMMA test [21,22] as an empirical Bayesian approach to analyzing microarray data that uses hierarchical linear models to improve estimates of variance. First, we excluded unannotated and lowly expressed genes. Then we plotted the unadjusted p-values for all tests on a frequency histogram and note that the frequency of nominally significant p-values (< 0.05) is no greater than that expected by chance alone (Figure 2B). This suggests that greater differences in expression are observed across subjects than between upper and lower lobe, as supported by serial 2-way ANOVA (data not shown), and the hierarchical clus-ter in Figure 1 where 5 of 6 pairs are noted to be most similar. Therefore, a single sample from each patient was selected for further analysis regardless of lobe.
Comparing Gene Expression from Biopsies and Explants
To investigate the difference between biopsies and explants, we selected the data from this subset of sam-ples (excluding lobar replicates) and decomposed the data by PCA such that 68% of the variance was captured within the first three principal components. The samples were plotted according to expression of the first three principal components (Figure 2C). Here, we could appreciate a distinct separation between IPF biopsies and IPF explants.
Next, we carried out the LIMMA test to identify genes that were differentially expressed between biopsy and explant. Before adjusting p-values, we plotted the results on a frequency histogram. We noted that the frequency of nominally significant p-values (< 0.05) was greater than expected by chance alone (Figure 2D). After adjust-ing the p-values with the Benjamini-Hochberg step-down method to control the false discovery rate (FDR) [23], 13 probesets (corresponding to 11 unique genes) were identified as statistically significant using a FDR threshold of 10% (Additional file 7, Table S4).
Approach to Developing Gene Expression Signatures
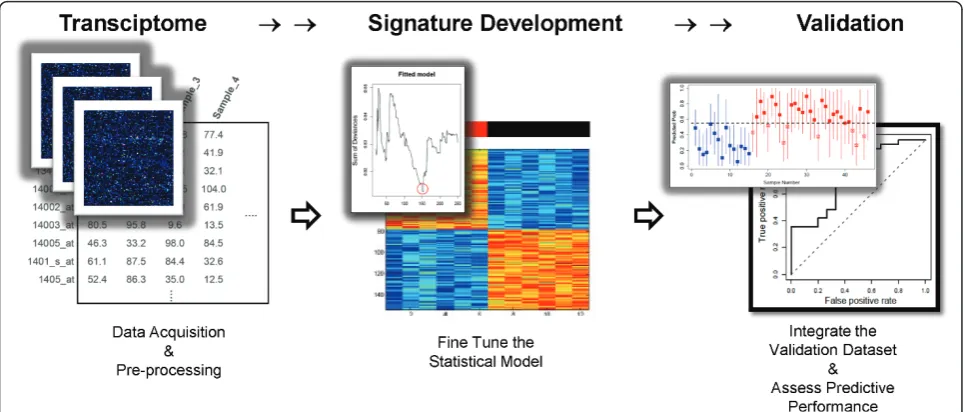
A schematic diagram illustrates the process by which we develop genomic signatures using BPR models (Figure 3). The first step is to select, as the training dataset, a collection of samples that represent two distinct pheno-types. Prior to analysis, the training dataset is filtered to exclude unannotated and lowly expressed genes, without regard to phenotypic information.
Because there is no prior knowledge on which to base the number of genes included in the model, we propose an iterative data-driven approach to model-fitting. We propose using the“sum of deviances”between observed and predicted phenotypes, coupled with the“ misclassifi-cation rate”under a leave-one-out process, to determine the optimal size of our BPR model (i.e., the number of genes to include in the regression equation). Once the number of genes is selected, the model is summarized by the gene annotation and the average of the posterior distribution of the linear predictor under the Bayesian Table 1 Study Population
Patient Number Sample ID Age Gender FVC% DLCO% Sample Type Multiple Lobes Sampled?
1 Biopsy_140U 58 Male 55 54 Biopsy No
2 Biopsy_142U 56 Female 55 65 Biopsy No
3 Biopsy_144U 70 Male 84 87 Biopsy No
4 Biopsy_145U 54 Male 68 52 Biopsy No
5 Biopsy_149U 58 Male 79 70 Biopsy Yes
Biopsy_149L
6 Biopsy_159U 68 Male 50 43 Biopsy Yes
Biopsy_159L
7 Explant_146L 64 Male 56 23 Explant No
8 Explant_152U 67 Male 53 29 Explant Yes
Explant_152L
9 Explant_157U 67 Male 51 34 Explant Yes
Explant_157L
10 Explant_158U 68 Female 78 18 Explant Yes
Explant_158L
11 Explant_160U 67 Female 46 42 Explant Yes
Explant_160L
model. The gene signature is visualized by a heatmap that shows normalized expression values of the selected genes (rows) over the set of samples (columns).
Finally, a second set of samples is used to test the per-formance of the tuned model. This represents an inde-pendent validation. Because the validation dataset is derived on a different microarray platform, expression values need to be mapped and normalized in a merged dataset to account for differences in batch and the
information content of each array. Then, each sample in the validation dataset is applied to the Bayesian regres-sion model in order to generate a predictive probability (from 0.0 to 1.0) as a relative score indicating the likeli-hood of one phenotype over the other. Given informa-tion regarding the true phenotype of each validainforma-tion sample, it is possible to construct a receiver-operating characteristic (ROC) curve for the predictive value of the gene signature.
B
C A
Binary Classification for Signature Development
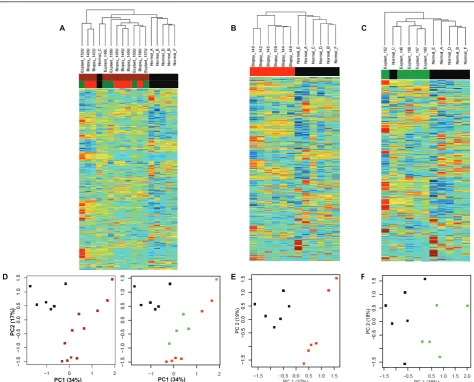
We chose to develop three separate models for the clas-sification of IPF; we planned to test each model for diagnostic accuracy (i.e., functional validity) in an inde-pendent dataset. We developed the first model from all IPF samples (excluding lobar replicates) versus normal controls. This training dataset is summarized in an unsupervised hierarchical cluster (Figure 4A) of the genes showing the largest coefficient of variation (CoV).
Since we identified differential gene expression between IPF biopsies and IPF explants, we chose to sepa-rately develop diagnostic signatures from each class, as
compared to normal controls. For the IPF biopsy sam-ples, the training dataset is summarized in an unsuper-vised hierarchical cluster (Figure 4B). Likewise, for the subset of IPF explants, the training dataset is summarized in an unsupervised hierarchical cluster (Figure 4C).
The three training datasets are each decomposed by PCA and the samples are plotted with regard to the first two principal components (Figures 4D,E and 4F).
Model Parameterization for Signature Development
For all signatures, the top two factors from singular value decomposition were used to fit independent terms
A B
Unadjusted p-value
Frequency
PC1 (39%)
PC
3 (11%
)
PC1 (43%)
PC
3 (10%
)
C D
Unadjusted p-value
Frequency
to the BPR models. The “misclassification rate” and
“sum of deviance” were used to determine the number of genes in each model, as described in Additional file 1 (also see Additional file 2, Figure S1). We determined that 151 genes were needed to optimize the “All IPF” model; 153 genes were needed to optimize the “IPF Biopsy” model; and 70 genes were needed to optimize the“IPF Explant” model.
BPR was performed on each training dataset. Each model was visualized with a heatmap (Figure 5). To illustrate that each training dataset produces a unique set of predictors, we list the top 10 gene predictors alongside each model. The complete gene list for each signature is supplied in the additional files (see Addi-tional files 8, 9 and 10, Tables S5-S7).
Independent Validation of Gene Signatures
We used the GSE10667 dataset to test each gene signa-ture. By using the same dataset to validate all three sig-natures, we were able to make a direct comparison between the models.
First we mapped the features of the Agilent microar-ray GSE10667 dataset to the corresponding features in our Affymetrix training datasets. We found that 148 features of the GSE10667 dataset mapped to features of the“All IPF” model (out of a possible 151 features, 98.0%); 151 features were mapped to the “IPF Biopsy” model (out of 153 possible features, 98.7%); and 69 features were mapped to the “IPF Explant”model (out of 70 possible features, 98.6%). After features were mapped, we merged the training and validation data-sets. Gene expression was normalized across the merged datasets.
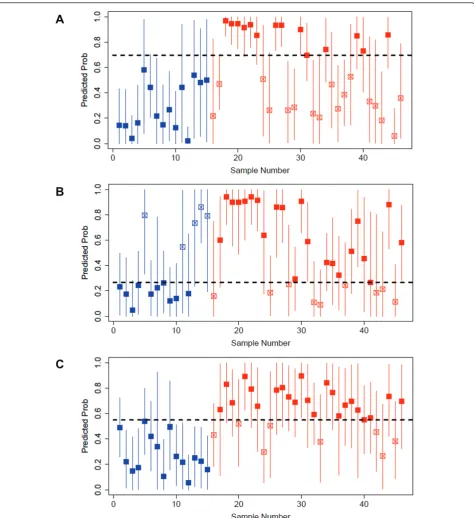
Then, each model was used in turn to predict the phe-notype of each sample in the validation cohort (Figure 6A, B and 6C). Predicted probabilities indicate the likeli-hood of IPF. The true phenotype of each validation sam-ple is shown in color (blue for normal andredfor IPF). Correct predictions are indicated with a solid marker while incorrect predictions are indicated with an open marker. The Youden index was used to compute cut points that maximize linear combinations of sensitivity and specificity for each model in this cohort, run on Agilent arrays. Evaluation of the quality of these thresh-olds would require additional validation on the Agilent platform as part of future investigations.
ROC curves are drawn on a single graph to facilitate comparison (Figure 7). Area under the curve, sensitivity, specificity, positive and negative predictive values and overall predictive accuracy are reported in Table 2. Wil-coxon rank sum was performed on each signature to test the general association of predictions and pheno-types. Interestingly, the “IPF Explant” model outper-forms the“All IPF”and “IPF Biopsy”models.
Discussion
This study shows that IPF gene signatures can be derived from whole lung tissue, given appropriate bios-pecimen selection and acquisition. In fact, this study serves as a proof-of-principle: mathematical models such as BPR (that handle high-dimensional data) can be used to develop multi-gene biomarkers for non-neoplas-tic lung disease, starting from gene expression profiles.
We profiled gene expression from whole lung in 11 patients with IPF and 6 normal controls. Samples of IPF were obtained during diagnostic surgical lung biopsies
or during lung transplantation procedures. Whenever possible, we obtained samples from two different lobes of the lung. During the initial data processing phase of our analysis, we made several interesting discoveries. We found that gene expression is similar between differ-ent lobes of the lung (upper and lower) sampled from the same patient. We also found that gene expression differs substantially between IPF samples obtained at the time of biopsy versus explant.
Then we developed three gene expression models, designed for the diagnosis of IPF. These models were designed for functionality and portability: they were designed to predict the diagnosis of IPF across different patient populations and across different microarray
platforms. Therefore, we needed to test our models on an independent cohort of samples containing both IPF and normal lung, to see if the models’predictions were accurate. This represents the first reported attempt to show validity of IPF gene expression signatures as diag-nostic models.
We found that all three of our IPF gene expression signatures exhibited discriminatory power and could be used to predict a diagnosis of IPF (see Wilcoxon rank sum, Table 2). However, the signature derived from explanted samples was the most accurate at diagnosing IPF in this particular validation cohort. We postulate several explanations. First, our “IPF Explant” training cohort is probably the most similar cohort as compared A B C
D E F
PC1 (34%)
P
C
2 (17%)
PC1 (34%)
with the validation cohort, which is highly enriched with explant and autopsy samples. Second, the homogeneity of samples in the“IPF Explant”cohort promotes a more discriminative model, given the available sample size; while the clinically heterogeneous “All IPF” and “IPF
Biopsy”cohorts tend to develop less discriminative mod-els. Finally, predictive accuracy of our models is linked to the prevalence of IPF in the validation cohort. These factors must be considered in the design of more defini-tive studies.
A
B
C
The fact that a homogeneous“IPF Explant” cohort is most robust highlights the inherent heterogeneity in
the general IPF population (represented by “IPF
Biopsy”) and supports the need for better diagnostic tools.
In the past, other investigators examined gene expres-sion from the lungs of patients with pulmonary fibrosis. Studies were designed to detect gene expression that was altered in pulmonary fibrosis [24-26]. Experiments were also designed as a means to elucidate mechanisms
A
B
C
Figure 7ROC curves. All IPF (brown), IPF Biopsy (red) and IPF Explant (green) are shown for comparison. Optimal cutoff points are circled.
Table 2 Operating Characteristics of the Gene Signatures
Gene Signature
Model
Area Under the
Curve
Sensitivity Specificity Positive Predictive
Value
Negative Predictive Value
Overall Accuracy
Wilcoxon Rank-sum (p-value)
All IPF 0.774 45% 100% 100% 47% 63% 0.0023
IPF Biopsy 0.682 71% 67% 81% 53% 70% 0.048
of pathogenesis or identify novel targets for therapy [27]. One problem with these older studies is the lack of replication in independent cohorts [28]. More recent studies focus on differential gene expression between clinical phenotypes such as acute exacerbations of IPF versus stable IPF [15,29,30]; and IPF versus hypersensi-tivity pneumonitis (HP) [31]. Yet, no study to date has presented a functional gene-based diagnostic model.
We acknowledge the limitations of our study. Our pro-visional models range from 63-83% accurate. The present study was performed on a small cohort and was only intended as a proof-of-principle. However, we believe that, by increasing the number of samples in our training cohort, we can refine the diagnostic model and increase the accuracy of diagnostic predictions. We also recognize the need to discriminate IPF from other subtypes of pul-monary fibrosis. Therefore, a definitive investigation must compare IPF gene expression with gene expression profiles of NSIP, HP and other subtypes of pulmonary fibrosis. Since BPR models are restricted to binary classi-fications, we would potentially extend the Bayesian SVD approach to multinomial outcomes, or other commonly employed methods for high-dimensional expression data (e.g., Classification and Regression Trees [CART]).
Conclusions
We show that BPR is a powerful tool for developing gene signatures from non-neoplastic lung tissue. We hope that this study will lead to the development of a definitive diagnostic gene signature for IPF. To do this, it will be necessary to collect a larger cohort of high-quality biospecimens. We suggest that BPR can also be used to develop a prognostic gene signature for IPF by training a model with samples of rapidly progressive IPF versus slowly progressive IPF. Furthermore, we believe that BPR can be used to model other lung disorders (such as NSIP, HP, bronchiolitis obliterans) by substitut-ing with different phenotypes in the trainsubstitut-ing cohort.
Additional material
Additional file 1: Supplemental Methods. Complete summary of the statistical methods and data integration steps used to develop and validate the multi-gene models.
Additional file 2: Model Selection (Figure S1). In order to optimize the fitted models for IPF Biopsies and IPF Explants, (A) and (C) the total sum of deviance was calculated for the observed phenotype versus posterior probabilities, and (B) and (D) the misclassification rate was computed under leave-one-out re-sampling for model sizes from 50 to 250 genes.
Additional file 3: Mapping theALL IPFGene Signature to GSE10667 (Table S1). 148 out of 151 (98.0%) possible features from the training dataset were mapped to corresponding features of the validation dataset on a many-by-many basis.
Additional file 4: Mapping theIPF BiopsyGene Signature to GSE10667 (Table S2). 151 out of 153 (98.7%) possible features from the
training dataset were mapped to corresponding features of the validation dataset on a many-by-many basis.
Additional file 5: Mapping theIPF ExplantGene Signature to GSE10667 (Table S3). 69 out of 70 (98.6%) possible features from the training dataset were mapped to corresponding features of the validation dataset on a many-by-many basis.
Additional file 6: Software codes in the R programming language (Bioconductor). Includes the algorithm for Bayesian Probit Regression. These codes are written for a specific machine. Please contact the authors for instructions on how to run these codes on another machine.
Additional file 7: Differentially Expressed Genes, IPF Biopsies versus IPF Explants (Table S4). Between IPF biopsies and IPF explants, 13 probesets, corresponding to11 unique genes, are differentially expressed at a FDR threshold of 10%. A positive t-statistic indicates up-regulation in the explants relative to the biopsies.
Additional file 8: Complete Gene List for theAll IPFModel (Table S5). The top 151 probe sets identified by Student t-test correspond to 136 unique genes. A positive t-statistic indicates up-regulation in IPF relative to Normal.
Additional file 9: Complete Gene List for theIPF BiopsyModel (Table S6). The top 153 probe sets identified by Student t-test correspond to 131 unique genes. A positive t-statistic indicates up-regulation in Biopsies relative to Normal.
Additional file 10: Complete Gene List for theIPF ExplantModel (Table S7). The top 70 probe sets identified by Student t-test correspond to 65 unique genes. A positive t-statistic indicates up-regulation in Explants relative to Normal.
Acknowledgements
This work was supported in part by the NIH SCCOR Grant on Host Defense and Chronic Lung Disease, 5P50HL084917-05. This work was also supported by a generous grant from the Drinkard Research Fund. Funding sources were not involved in study design, performance, analysis or manuscript preparation.
Author details
1Department of Medicine, Division of Pulmonary, Allergy and Critical Care
Medicine, Department of Medicine, Duke University Medical Center, Durham, North Carolina, USA.2Department of Biostatistics and Bioinformatics, Duke University Medical Center, Durham, North Carolina, USA.3Institute for Genome Science and Policy, Duke University Medical Center, Durham, North Carolina, USA.4Department of Surgery, Division of Cardiovascular and Thoracic Surgery, Duke University Medical Center, Durham, North Carolina, USA.5Department of Immunology, Duke University Medical Center, Durham, North Carolina, USA.6Department of Pathology, Duke University Medical Center, Durham, North Carolina, USA.
Authors’contributions
EBM participated in the diagnosis and recruitment of the training cohort; clinical data analysis; microarray data analysis; statistics; conceptualization, planning and design of the study; and manuscript preparation, including preparation of the initial draft. WTB participated in the statistical design of the study, microarray data analysis and manuscript preparation. TAD, RDD, SSL, MWO and LDW participated in patient recruitment and development of the tissue acquisition protocol. TAS participated in histopathological review of the specimens; and participated in the development of the tissue procurement protocol. MPS participated in patient recruitment, development of the tissue procurement protocol and manuscript preparation. PWN participated in the diagnosis and recruitment of the training cohort; conceptualization, planning and design of the study design; and manuscript preparation. All authors read and approved the final manuscript.
Competing interests
Received: 29 April 2011 Accepted: 5 October 2011 Published: 5 October 2011
References
1. Olson AL, Swigris JJ, Lezotte DC, Norris JM, Wilson CG, Brown KK:Mortality from pulmonary fibrosis increased in the United States from 1992 to 2003.Am J Respir Crit Care Med2007,176:277-284.
2. American Thoracic Society/European Respiratory Society International Multidisciplinary Consensus Classification of the Idiopathic Interstitial Pneumonias. This joint statement of the American Thoracic Society (ATS), and the European Respiratory Society (ERS) was adopted by the ATS board of directors, June 2001 and by the ERS Executive Committee, June 2001. Am J Respir Crit Care Med2002,165:277-304.
3. American Thoracic Society:Idiopathic pulmonary fibrosis: diagnosis and treatment. International consensus statement. American Thoracic Society (ATS), and the European Respiratory Society (ERS).Am J Respir Crit Care Med2000,161:646-664.
4. Meltzer EB, Noble PW:Idiopathic pulmonary fibrosis.Orphanet J Rare Dis
2008,3:8.
5. du Bois RM:Strategies for treating idiopathic pulmonary fibrosis.Nat Rev Drug Discov2010,9:129-140.
6. Travis WD, Hunninghake G, King TE Jr, Lynch DA, Colby TV, Galvin JR, Brown KK, Chung MP, Cordier JF, du Bois RM,et al:Idiopathic nonspecific interstitial pneumonia: report of an American Thoracic Society project.
Am J Respir Crit Care Med2008,177:1338-1347.
7. Raghu G, Brown KK:Interstitial lung disease: clinical evaluation and keys to an accurate diagnosis.Clin Chest Med2004,25:409-419, v.
8. Ryu JH, Olson EJ, Midthun DE, Swensen SJ:Diagnostic approach to the patient with diffuse lung disease.Mayo Clin Proc2002,77:1221-1227, quiz 1227.
9. du Bois RM:Evolving concepts in the early and accurate diagnosis of idiopathic pulmonary fibrosis.Clin Chest Med2006,27:S17-25, v-vi. 10. Flaherty KR, King TE Jr, Raghu G, Lynch JP, Colby TV, Travis WD, Gross BH,
Kazerooni EA, Toews GB, Long Q,et al:Idiopathic interstitial pneumonia: what is the effect of a multidisciplinary approach to diagnosis?Am J Respir Crit Care Med2004,170:904-910.
11. Thomeer M, Demedts M, Behr J, Buhl R, Costabel U, Flower CD, Verschakelen J, Laurent F, Nicholson AG, Verbeken EK,et al:
Multidisciplinary interobserver agreement in the diagnosis of idiopathic pulmonary fibrosis.Eur Respir J2008,31:585-591.
12. Flaherty KR, Andrei AC, King TE Jr, Raghu G, Colby TV, Wells A, Bassily N, Brown K, du Bois R, Flint A,et al:Idiopathic interstitial pneumonia: do community and academic physicians agree on diagnosis?Am J Respir Crit Care Med2007,175:1054-1060.
13. Berchuck A, Iversen ES, Luo J, Clarke JP, Horne H, Levine DA, Boyd J, Alonso MA, Secord AA, Bernardini MQ,et al:Microarray analysis of early stage serous ovarian cancers shows profiles predictive of favorable outcome.Clin Cancer Res2009,15:2448-2455.
14. Mendiratta P, Mostaghel E, Guinney J, Tewari AK, Porrello A, Barry WT, Nelson PS, Febbo PG:Genomic strategy for targeting therapy in castration-resistant prostate cancer.J Clin Oncol2009,27:2022-2029. 15. Konishi K, Gibson KF, Lindell KO, Richards TJ, Zhang Y, Dhir R, Bisceglia M,
Gilbert S, Yousem SA, Song JW,et al:Gene expression profiles of acute exacerbations of idiopathic pulmonary fibrosis.Am J Respir Crit Care Med
2009,180:167-175.
16. Rosas IO, Richards TJ, Konishi K, Zhang Y, Gibson K, Lokshin AE, Lindell KO, Cisneros J, Macdonald SD, Pardo A,et al:MMP1 and MMP7 as potential peripheral blood biomarkers in idiopathic pulmonary fibrosis.PLoS Med
2008,5:e93.
17. Bolstad BM, Irizarry RA, Astrand M, Speed TP:A comparison of normalization methods for high density oligonucleotide array data based on variance and bias.Bioinformatics2003,19:185-193.
18. Irizarry RA, Bolstad BM, Collin F, Cope LM, Hobbs B, Speed TP:Summaries of Affymetrix GeneChip probe level data.Nucleic Acids Res2003,31:e15. 19. Irizarry RA, Hobbs B, Collin F, Beazer-Barclay YD, Antonellis KJ, Scherf U,
Speed TP:Exploration, normalization, and summaries of high density oligonucleotide array probe level data.Biostatistics2003,4:249-264. 20. West M, Blanchette C, Dressman H, Huang E, Ishida S, Spang R, Zuzan H,
Olson JA Jr, Marks JR, Nevins JR:Predicting the clinical status of human breast cancer by using gene expression profiles.Proc Natl Acad Sci USA
2001,98:11462-11467.
21. Smyth GK:limma: Linear Models for Microarray Data.Bioinformatics and computational biology solutions using R and Bioconductor2005, 397-420. 22. Smyth GK, Yang YH, Speed T:Statistical issues in cDNA microarray data
analysis.Methods Mol Biol2003,224:111-136.
23. Benjamini Y, Hochberg Y:Controlling the False Discovery Rate - a Practical and Powerful Approach to Multiple Testing.J Roy Stat Soc B Met
1995,57:289-300.
24. Pardo A, Gibson K, Cisneros J, Richards TJ, Yang Y, Becerril C, Yousem S, Herrera I, Ruiz V, Selman M, Kaminski N:Up-regulation and profibrotic role of osteopontin in human idiopathic pulmonary fibrosis.PLoS Med2005,
2:e251.
25. Yang IV, Burch LH, Steele MP, Savov JD, Hollingsworth JW, McElvania-Tekippe E, Berman KG, Speer MC, Sporn TA, Brown KK,et al:Gene expression profiling of familial and sporadic interstitial pneumonia.Am J Respir Crit Care Med2007,175:45-54.
26. Zuo F, Kaminski N, Eugui E, Allard J, Yakhini Z, Ben-Dor A, Lollini L, Morris D, Kim Y, DeLustro B,et al:Gene expression analysis reveals matrilysin as a key regulator of pulmonary fibrosis in mice and humans.Proc Natl Acad Sci USA2002,99:6292-6297.
27. Kaminski N, Rosas IO:Gene expression profiling as a window into idiopathic pulmonary fibrosis pathogenesis: can we identify the right target genes?Proc Am Thorac Soc2006,3:339-344.
28. Rosas IO, Kaminski N:When it comes to genes–IPF or NSIP, familial or sporadic–they’re all the same.Am J Respir Crit Care Med2007,175:5-6. 29. Boon K, Bailey NW, Yang J, Steel MP, Groshong S, Kervitsky D, Brown KK,
Schwarz MI, Schwartz DA:Molecular phenotypes distinguish patients with relatively stable from progressive idiopathic pulmonary fibrosis (IPF).
PLoS One2009,4:e5134.
30. Selman M, Carrillo G, Estrada A, Mejia M, Becerril C, Cisneros J, Gaxiola M, Perez-Padilla R, Navarro C, Richards T,et al:Accelerated variant of idiopathic pulmonary fibrosis: clinical behavior and gene expression pattern.PLoS One2007,2:e482.
31. Selman M, Pardo A, Barrera L, Estrada A, Watson SR, Wilson K, Aziz N, Kaminski N, Zlotnik A:Gene expression profiles distinguish idiopathic pulmonary fibrosis from hypersensitivity pneumonitis.Am J Respir Crit Care Med2006,173:188-198.
Pre-publication history
The pre-publication history for this paper can be accessed here: http://www.biomedcentral.com/1755-8794/4/70/prepub
doi:10.1186/1755-8794-4-70
Cite this article as:Meltzeret al.:Bayesian probit regression model for the diagnosis of pulmonary fibrosis: proof-of-principle.BMC Medical Genomics20114:70.
Submit your next manuscript to BioMed Central and take full advantage of:
• Convenient online submission
• Thorough peer review
• No space constraints or color figure charges
• Immediate publication on acceptance
• Inclusion in PubMed, CAS, Scopus and Google Scholar
• Research which is freely available for redistribution
![Figure 5 Gene signaturesHeatmap and partial gene list for the. (A) A heatmap displays the normalized expression values of 151 genes that comprise the All IPF model, derivedfrom 6 normals and 11 IPF samples (rows = genes; columns [left to right] = 6 normals](https://thumb-us.123doks.com/thumbv2/123dok_us/8988261.1891764/9.595.59.538.87.600/signaturesheatmap-displays-normalized-expression-comprise-derivedfrom-samples-columns.webp)