R E S E A R C H
Open Access
Long noncoding RNA MALAT1 in exosomes
drives regenerative function and modulates
inflammation-linked networks following
traumatic brain injury
Niketa A. Patel
1,2*†, Lauren Daly Moss
3†, Jea-Young Lee
3†, Naoki Tajiri
3,4, Sandra Acosta
3, Charles Hudson
1,
Sajan Parag
2, Denise R. Cooper
1,2, Cesario V. Borlongan
3,5*and Paula C. Bickford
1,3,5*Abstract
Background:Neuroinflammation is a common therapeutic target for traumatic brain injury (TBI) due to its contribution to delayed secondary cell death and has the potential to occur for years after the initial insult. Exosomes from adipose-derived stem cells (hASCs) containing the long noncoding RNA MALAT1 are a novel, cell-free regenerative approach to long-term recovery after traumatic brain injury (TBI) that have the potential to modulate inflammation at the genomic level. The long noncoding RNA MALAT1 has been shown to be an important component of the secretome of hASCs.
Methods:We isolated exosomes from hASC containing or depleted of MALAT1. The hASC-derived exosomes were
then administered intravenously to rats following a mild controlled cortical impact (CCI). We followed the rats with behavior, in vivo imaging, histology, and RNA sequencing (RNA Seq).
Results:Using in vivo imaging, we show that exosomes migrate into the spleen within 1 h following
administration and enter the brain several hours later following TBI. Significant recovery of function on motor behavior as well as a reduction in cortical brain injury was observed after TBI in rats treated with exosomes. Treatment with either exosomes depleted of MALAT1 or conditioned media depleted of exosomes showed limited regenerative effects, demonstrating the importance of MALAT1 in exosome-mediated recovery. Analysis of the brain and spleen transcriptome using RNA Seq showed MALAT1-dependent modulation of inflammation-related
pathways, cell cycle, cell death, and regenerative molecular pathways. Importantly, our data demonstrates that MALAT1 regulates expression of other noncoding RNAs including snoRNAs.
Conclusion:We demonstrate that MALAT1 in hASC-derived exosomes modulates multiple therapeutic targets,
including inflammation, and has tremendous therapeutic potential for treatment of TBI.
* Correspondence:[email protected];[email protected]; [email protected];[email protected]
†Niketa A. Patel, Lauren Daly Moss and Jea-Young Lee contributed equally to
this work.
1James A Haley Veterans Hospital, Research Service, Tampa, FL, USA 3Department of Neurosurgery and Brain Repair, University of South Florida
Morsani College of Medicine, Tampa, FL, USA
Full list of author information is available at the end of the article
Background
Approximately two million Americans suffer from trau-matic brain injury (TBI) annually, accounting for 30% of all injury-related fatalities [1, 2]. Currently, treatment options for TBI consist predominantly of rehabilitation and symptom management. Thus, there is an urgent need for novel treatments to prevent or slow the pro-gression of secondary injury in TBI. Due to its contribu-tion to secondary cell death, which can occur years after the initial insult, neuroinflammation is a common target for prospective TBI therapeutics [3–8]. Recruitment of macrophages into the area of brain damage is an import-ant aspect of secondary injury, and numerous ap-proaches have been explored to intervene in this process [9–12]. One of the organs important in the flux of monocytes and T cells into the peripheral circulation fol-lowing injury is the spleen, and it has been demonstrated that the intact spleen is important for the neuroprotec-tive action of multipotent adult progenitor cells after several models of brain insult [13–16].
The neuroprotective capacity of mesenchymal stem cells (MSCs) derived from adipose tissue has garnered
great interest in regenerative medicine. Human
adipose-derived stem cells (hASCs) manifest a secretome that is capable of modulating the environment of the
host. Among these secreted molecules, small
membrane-bound vesicles known as exosomes have gained particular interest due to their diverse cargo in-cluding cellular proteins, mRNA, and noncoding RNAs, as well as their ability to evade immune rejection by the
host and modify immune responses [17]. Compelling
evidence suggests that exosomes play an important role in cell-to-cell communication, and rats or mice treated with exosomes have demonstrated improved functional recovery after models of stroke and TBI [18–20]. These MSC-derived extracellular vesicles are also thought to modulate immune function as part of their mechanism of prevention of injury following TBI [21].
Long noncoding RNA (lncRNA) are important regula-tors of gene expression and have been shown to mediate several pathways such as cell cycle, proliferation as well as apoptosis, and immune modulation. Additionally, they are involved in epigenetic regulation, transcription, and translation as well as alternative splicing of genes. Aber-rant expression of lncRNAs is associated with human diseases [22–25]. Of the cargo secreted in exosomes,
lncRNA metastasis-associated lung adenocarcinoma
transcript 1 (MALAT1) controls key biological processes such as cellular proliferation and differentiation and is thought to have a special role in regeneration after injury [26–28]. We previously used the secretome (collected as conditioned media) of hASC as treatment and showed that it promotes repair following TBI [26]. MALAT1 is part of the cargo secreted by hASC [29], and our in vitro
studies using the HT22 cell line demonstrated that MALAT1 promotes survival and proliferation [27]. Here, we sought to examine the use of hASC-derived exo-somes as a novel, cell-free regenerative approach to in-jury recovery in an in vivo model of TBI. We identify the cellular processes crucial to recovery that are specif-ically mediated by MALAT1. Importantly, we also eluci-date the genomic impact exosome treatment using RNA sequencing (RNA Seq) transcriptome analysis. Our re-sults show that MALAT1 in hASC-derived exosomes is therapeutically beneficial after TBI.
Methods
Exosome isolation and collection from ASCs
hASC (Zenbio, catalog #ASC-F) were trypsinized, and cell pellets were collected in 100 μL Nucleofector® kit (Lonza, catalog #VPE-1001) and combined with pMAX GFP (2 μg). The cell/DNA solution was transferred to a cuvette, and the program initiated (0.34 kV, 960 μF). Medium (500μL) was added immediately, and cells were gently transferred to 100-mm plates and allowed to grow for 48 h. To deplete MALAT from hASC exosomes, we used MALAT1 antisense oligonucleotide (ASO; ID 39524 ASO from Ionis Pharmaceuticals), validated for specificity and designed for efficient uptake by cells. The ASOs were added to hASC and incubated for 48 h. The expression levels of MALAT1 were verified in the exo-somes using human MALAT1 primers in qPCR. Exo-somes were isolated from conditioned media (CM) and verified that exosomes contain GFP as previously de-scribed by our lab [27, 29]. Briefly, CM derived from hASC was collected after 48 h and centrifuged at 3000g
for 15 min to remove dead cells. ExoQuick™ (System
Biosciences, Catalog #EXOTC-50A-1) reagent was
added to the CM and incubated overnight at 4 °C along with XenoLight 1,1-dioctadecyl-3,3,3,3-tetramethylindo-tricbocyanine iodide (DiR) (catalog #125964; Caliper Life Sciences). Following centrifugation at 1500g for 30 min, the pellet was further processed. ExoCap™(JSR Life Sci-ences, Catalog #EX-COM) composite reagent containing magnetic beads for CD9, CD63, and CD81 was used to purify exosomes. Exosomes were eluted from beads using 500μL of the manufacturer’s elution buffer. Buffer was then exchanged by Ambicon columns. Nanoparticle tracking analysis from NanoSight (NTA3.1, Build 3.1.46 RRID SCR-014239) was used to analyze peak diameter
and concentration of exosomes obtained from 106
hASC. Analysis showed exosome size to be 89 ± 7 nm.
Animal model and surgical procedures
and a 12-h light/dark cycle). All studies were performed by personnel blinded to the treatment condition.
A total of 79 Fisher 344 male rats were subjected to ei-ther TBI by controlled cortical impact or sham surgery. The rats were randomly distributed into the following
groups: surgery with no TBI (sham control C, N= 11),
TBI with unconditioned media as vehicle (T; N= 20),
TBI treated with exosomes (TE, N= 18), TBI treated
with exosomes depleted of MALAT1 (TEdM, N= 20),
and TBI with injection of conditioned media depleted of
exosomes (TdCM;N= 7). Deep anesthesia was
adminis-tered to all rats undergoing TBI surgery using 1–2% iso-flurane in nitrous oxide/oxygen (69%/30%) and was maintained using a gas mask. TBI-induced animals were fixed in a stereotaxic frame (David Kopf Instruments). The TBI procedure was performed as previously de-scribed [26]. Briefly, the skull was exposed by a midline incision, coordinates of + 0.2 mm anterior and + 0.2 mm lateral to the midline were found, and craniotomy was performed; the brain was then impacted at the fronto-parietal cortex with a velocity of 6.0 m/s reaching a depth of 0.5 mm (mild TBI) below the dura matter layer and a dwell time of 150 ms. Body temperature of the an-imals was maintained within normal limits by a computer-operated thermal pad and rectal thermometer. All animals were closely monitored postoperatively and analgesic ketoprofen was administered prior to surgery and as needed thereafter. Rats were maintained on regu-lar rodent diet throughout the experiment.
Intravenous administration of exosomes and CM
Three hours after TBI induction, rats were anesthetized
using 1–2% isoflurane in nitrous oxide/oxygen (69%/
30%) and were maintained using a gas mask. Intravenous injections through the jugular vein were then performed and divided as follows: TBI-Veh (T) received 500-μl un-conditioned media, TBI animals with exosomes depleted conditioned media (TdCM) received 500-μl conditioned media depleted of exosomes, TBI animals with exosomes (TE) received exosomes (100 μg in 500 μl of sterile sa-line), and TBI animals with exosomes depleted of
MALAT1 (TEdM) received exosomes (100μg in 500 μl
of sterile saline). Sham animals did not receive any injec-tion, and animals receiving unconditioned media were used as control groups. To evaluate the migration of the transplanted exosomes, exosomes were incubated with DiR during isolation.
XenoLight DiR for in vivo and ex vivo biodistribution imaging procedures
To visualize DiR fluorescence emitted from the injected
exosomes in vivo, animal’s abdomens were shaved to
avoid light scattering and anesthetized in a chamber with 3.0% isoflurane. Animals were then transferred from the
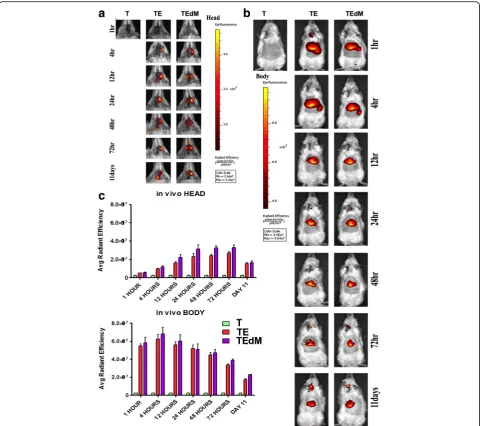
chamber to the IVIS Spectrum 200 Imaging System (Xenogen), and the isoflurane level was maintained at 1–2% throughout image acquisition. The biodistribution of DiR-labeled exosomes were monitored in vivo at 1, 4, 12, 24, 48, and 72 h and again at 11 days post-surgery and transplantation. Images were also obtained of ex vivo organs including the brain, liver, lungs, and spleen after 1, 3, 7, and 11 days post-surgery and transplant-ation. Full-body imaging was performed ventrally at all time points, and a second set of images were obtained for the head region using a higher magnification. The parameters used throughout the experiment were as fol-lows: exposure time = auto; lamp voltage = high; F/stop = 2; binning = 8; excitation filter = 745 nm; emission fil-ter = 800 nm; field of view = D (for whole body), C (for ex vivo organs), or B (for head region). All captured im-ages were analyzed using Living Image Software 4.0 (Xenogen RRID:SCR_014247). To analyze the change in DiR fluorescence intensity, identical regions of interest (ROIs) were placed on the abdomen and head area for all animals. The same ROI was also placed on the control animal as the background reference. Background effi-ciency was subtracted from each of the individual animal’s efficiency and presented as an average radiant efficiency (photons per second per square centimeter per steridian divided by microwatts per square centimeter).
Behavioral testing
Each rat was subjected to a series of behavioral tests to as-sess motor and neurological performance of animals, at baseline before surgery and post TBI at days 0, 3, and 7.
Elevated body swing test (EBST)
EBST is a measure of asymmetrical motor behavior that does not require animal training or drug injection [30]. The rats were held, in the vertical axis, 1 in. from the base of its tail and then elevated to an inch above the surface on which it has been resting. The frequency and direction of the swing behavior were recorded for 20 tail elevations. A swing was counted when the head of the rat moved 10° from the vertical axis to either side. A score of 10 indicates no bias. The higher number of swings made to one side was added per group and di-vided by the n, giving us the average number of biased swings per treatment group.
Forelimb akinesia
were tallied for each individual animal, and then, mean scores for treatment groups were used for analyses.
Paw grasp
Before and after TBI surgery, grip strength of rats from all groups was evaluated. An abnormal grip is indicative of impaired neuromuscular function. In this test, rats were held by their bodies against a pole. Both ipsilateral and contralateral paw grip strength were scored by two experimentally masked evaluators using the following grip strength scale. On a scale of 1 to 3, 1 is normal, 2 is impaired, and 3 is severely impaired. Scores were tallied for each individual animal, and then, mean scores for treatment groups were used for analyses.
Brain and organ harvesting, fixation, and sectioning
Under deep anesthesia, rats were sacrificed on days 1, 3, 7, and 11 following TBI for protein analysis, RNA se-quencing, and/or immunohistochemical investigations. Briefly, animals were perfused through the ascending aorta with 200 ml of cold PBS, followed by 200 ml of 4% paraformaldehyde in phosphate buffer (PB). The brains, spleen, lungs, and liver were removed and post-fixed in the same fixative for 24 h, followed by 30% sucrose in PB until completely sunk. Series of coronal sections were cut at a thickness of 40 um with a cryostat and stored at
−20 °C. Six coronal sections between the anterior edge and posterior edge of the impacted area were collected and processed for GFP expression in exosome-injected animals.
Measurement of impact and peri-impact area: Nissl staining analysis
Serial sections corresponding to the same group of ani-mals were stained with Nissl (Thermo Fisher Scientific
Cat# N21483 RRID:AB_2572212) for impact and
peri-impact calculations. Six coronal sections between the anterior edge and posterior edge of the impacted area were collected and processed for Nissl staining from each brain perfused at day 11 after TBI. Sections were cut at a thickness of 40μm by a cryostat. Coronal tissue sections were randomly selected for measurement of impact and peri-impact area. Brain sections were ex-amined using a light microscope (Olympus) and Keyence microscope. The impact area was outlined and measured
in each of the six slices and quantified by a
computer-assisted image analysis system (NIH Image RRID:SCR_003070). To measure the peri-impact area, we examined the same six sections through the impact zone and placed four 20× fields along the edge of the impact core. Each 20× image was then analyzed for the number of live neurons with Nissl staining (see Fig. 1f for example). Impact and peri-impact area was then
expressed as a percentage of the ipsilateral hemisphere compared with the contralateral hemisphere.
RNA sequencing: RNA quality control
RNA was isolated from the brains (area near impact site) and spleens of rats at day 7 following TBI in the sham surgery—control (C), TBI with vehicle (T), TBI treated
with exosomes (TE), and TBI treated with
MALAT1-depleted exosomes (TEdM) groups. Four rats from each group were randomly chosen and pooled to maximize biological diversity and sent for RNA Seq (Ocean Ridge Biosciences). Eight total RNA samples (four rat spleen tissue and four rat brain tissue) were submitted to Ocean Ridge Biosciences for RNA sequen-cing. RNA was quantified by O.D. measurement and assessed for quality on a 1% agarose–2% formaldehyde RNA quality control (QC) gel. The RNA was then digested with RNase-free DNase I (Epicentre; Part # D9905K) and re-purified on RNeasy MinElute columns (Qiagen; Part # 74204) using an alternative high ethanol protocol to preserve low molecular weight (LMW) RNAs. The newly purified RNA samples were then quantified by O.D. measurement.
Library preparation
Ribosomal RNA was depleted from 1μg of DNA-free total RNA using the Ribo-Zero Gold rRNA Removal Kit for Human/Mouse/Rat (Illumina, part number MRZG126). Template DNA molecules suitable for cluster generation were then prepared from the rRNA-depleted samples using the ScriptSeq V2 RNA-Seq Library Prep Kit (Illu-mina, part number SSV21124). The quality and size distri-bution of the amplified libraries were determined by chip-based capillary electrophoresis on an Agilent 2100 Bioanalyzer. Libraries were quantified using the KAPA Li-brary Quantification Kit (Kapa Biosystems, Boston, MA).
Sequencing
Alignment to genome
Sequence alignment was performed using TopHat v1.4.1 (RRID SCR-013035) with the following settings:
tophat -p 2 -o [OUTPUT FOLDER] –library-type
fr-secondstrand–r [Dx] –mate-std-dev [Ds] [rn5 BOW-TIE GENOME INDEX] [FASTQ 1] [FATSQ 2]
where Dx and Ds represent sample-specific values for the mean and standard deviation, respectively, of the
inner distance between reads, as determined by
non-gapped alignment to rat mRNA. rn5 BOWTIE GENOME INDEX was built from the soft-masked gen-ome sequence. In practice FASTQ files for each sample were split into multiple FASTQs having 4 million reads each in order to accelerate processing.
ncRNA counting and annotation
The number of reads aligning to each ncRNA feature were counted using BEDtools v2.16.2 (RRID SCR-006646) with
Fig. 1Treatment with exosomes (TE) significantly rescued the TBI-associated motor deficits relative to TBI-Veh (T) and controls (C). Graphs show motor assessment using EBST (a), forelimb akinesia (b), and paw grasp test (c). Two-way ANOVA showed significant effects as follows: EBST, treatment effectsF(4) = 27.04; forelimb akinesia treatment effectF(4) = 30.3; paw grasp treatment effectF(4) = 42.2. Post hoc Bonferroni multiple comparisons are reported for differences versus TBI vehicle (T).#
p< 0.01,##
p< 0.001. Treatment with exosomes depleted of MALAT1 (TEdM) did not improve motor performance on EBST and only improved forelimb akinesia and paw grasp at day 3. Treatment with conditioned media depleted of exosomes (TdCM) also showed no improvement on EBST and only improved scores at day 3 on the other two tasks. Groups: shamN
= 11; TBI vehicleN= 16; TBI exosomesN= 16; TBI exosomes depleted of MALAT1N= 16; TBI-conditioned media depleted of exosomesN= 7. Lesion assessment: treatment with exosomes derived from hASCs significantly reduces impact and peri-impact areas of rats after mild TBI. Nissl staining as shown infwas performed on day 11 to assess damage to cortical region post TBI. Graphsdandequantify the data from images.f The methods for quantifying the impact area and for choosing images for analysis of the peri-impact area. Data for impact area (d) showed significant reduction in cortical lesion area following treatment with exosomes in the TE group and no rescue by any other treatment. Representative images of sections used for quantifying impact area and peri-impact are shown (g). For the peri-impact area (e), there was a significant rescue in the TE group, whereas TEdM group displayed partial rescue of the peri-impact areas when compared with vehicle (T) and sham controls (C). Data in the bar graphs represent the mean ± SEM values. Impact areaF= 14.78; peri-impact areaF= 56.58. Data were analyzed by one-way ANOVA followed by Dunnet’s multiple comparison test. #p< 0.1,##
the following settings: bedtools multicov -bams
C80R4ANXX_s8illumina12index_4_SL134409.fastq_05.-bam -bed rnacentral_active_v3_rat-mouse-human.gff
C80R4ANXX_s8illumina12index_4_SL134409.fastq_05/ counts.txt.
In practice, FASTQ files for each sample were split into multiple FASTQs having 4 million reads each in order to accelerate processing. For each sample, the resulting BAM files were merged as well as the count files. For all ncRNAs having at least one read aligned,
annotations were added using RNAcentral’s RESTful
API. The RPKM values were filtered to retain a list of ncRNAs with an RPKM equivalent to 50 mapped reads in one or more samples. The threshold of 50 mapped reads per ncRNA is considered the Reliable Quantifica-tion Threshold, since the RPKM values for a ncRNA represented by 50 reads should be reproducible in tech-nical replicates. To avoid reporting large fold changes due to random variation of counts from low abundance ncRNA, RPKM values equivalent to a count of <= 10 reads per ncRNA were replaced in the following way. First, for each sample, the RPKM value equivalent to 10
reads/ncRNA was calculated (assuming a median
ncRNA length of 0.122 kb). These RPKMs were then av-eraged across all the samples in the experiment, and this average value was used for replacement.
Fold change calculations
The filtered RPKM data for 19,058 detectable rat genes (RPKM values > Reliable Quantification Threshold (RQT) in at least one sample) were used to calculate the fold changes for TBI exosome/TBI vehicle, TBI exosome MALAT1/TBI exosome, and TBI vehicle/no TBI inde-pendently for the spleen and brain samples. Fold changes are expressed as the negative reciprocal in tables and for additional analysis. The splicing index was calculated based on the following formula: exon RPKM/gene RPKM.
Hierarchical clustering
Similarly, the same RPKM data for all 19,058 detectable rat genes were used for hierarchical clustering analysis
by Cluster 3.0 software4 (RRID SCR-013505). Genes
were log-2 transformed and median centered prior to hierarchical clustering. Hierarchical clustering was con-ducted on genes and samples using centered correlation as the similarity metric and average linkage as the clus-tering method. The intensity scale shown is arbitrary.
Real-time qPCR using SYBR green
Total RNA as described above for RNA Seq was used for validation. One microliter of cDNA was amplified by real-time quantitative PCR using Maxima SYBR Green/ Rox qPCR master mix (Thermo Scientific) in an ABI
ViiA7 sequence detection system (PE Applied
Biosystems) to quantify the relative levels of the tran-scripts in the samples. The primers were GAPDH sense
primer 5′- TGACGTGCCGCCTGGAGAAAC -3′ and
antisense 5′- CCGGCATCGAAGGTGGAAGAG -3′;
human MALAT1 sense 5′ CTTCCCTAGGGGAT
TTCAGG 3′ and antisense 5′ GCCCACAGGAACAA
GTCCTA 3′; rat MALAT1 sense 5’ TGCAGTGTG
CCAATGTTTCG 3′ and antisense 5′ GGCCAGCTG
CAAACATTCAA 3′; U1snRNA sense 5′ TCCC
AGGGCGAGGCTTATCCATT 3′ and antisense 5′
GAACGCAGTCCCCCACTACCACAAAT 3′.
Real-time PCR was then performed in triplicate on samples. The plate setup included a no template control, no RNA control, no reverse transcriptase control, and no amplification control. After primer concentrations were optimized to give the desired standard curve and a single melt curve, relative quotient (RQ) was determined
using the ΔΔCT method with U6snRNA or GAPDH as
the endogenous control and no TBI sample as the cali-brator sample. Experiments were repeated four times.
For absolute quantification, a standard curve was gen-erated for each gene in every assay. Briefly, 100 to 0.4 ng of RNA were reverse transcribed as described above. The resulting cDNA was used to obtain a standard curve correlating the amounts with the threshold cycle num-ber (Ct values). A linear relationship (r2> 0.96) was
ob-tained for each gene. Real-time PCR was then performed on samples and standards in triplicates. The plate setup also included a standard series, no template control, no RNA control, no reverse transcriptase control, and no amplification control. The dissociation curve was ana-lyzed for each sample. Absolute quantification of mRNA expression levels for MALAT1 or GFP was calculated by normalizing the values to GAPDH.
Results
Exosome treatment improves motor impairment and reduces lesion volume in a MALAT1-dependent manner
Fisher 344 male rats were subjected to either TBI by controlled cortical impact (CCI) injury model or no TBI (sham surgery only, control group) and treated with hASC-derived exosomes 3 h after surgery. Surgery is de-scribed in the “Methods” section. The rats were ran-domly distributed into the following groups: surgery
with no TBI (sham control C,N= 11), TBI with
uncon-ditioned media as vehicle (T; N= 20), TBI treated with
exosomes (TE, N= 18), TBI treated with exosomes
de-pleted of MALAT1 (TEdM,N= 20), and TBI with
rat was subjected to a series of behavioral tests including elevated body swing test (EBST), forelimb akinesia, and paw grasp to reveal motor and neurological performance of animals, before injury and after TBI on days 0, 1, 3, and 7.
The EBST records the number of lateral swings to one side or the other and defines a swing bias to one side as a motor defect. A score of 10 equals no bias, and higher scores indicate asymmetry. EBST revealed that rats sub-jected to TBI exhibited heightened swing bias and there-fore significant asymmetry in motor activity after injury. TBI (T) animals displayed no recovery when tested on days 3 and 7, whereas significant recovery of motor sym-metry was detected in TBI exosome-treated rats (TE) (two-way ANOVA followed by Tukey’s post hoc,p< 0.01 versus TBI-Veh; Fig. 1a). Treatment with either condi-tioned media depleted of exosomes (TdCM) or exosomes depleted of MALAT1 (TEdM) did not affect recovery of the animals, and scores for these groups were not signifi-cantly different from the TBI-vehicle (T) group).
The forelimb akinesia test indicated an apparent loss of motor strength in TBI rats after injury when com-pared with sham controls. TBI-Veh (T) animals retained impairment through day 7 and did not display any sig-nificant amelioration of forelimb akinesia. TBI animals treated with exosomes (TE) recovered by day 3 (Fig.1b), whereas TBI animals treated with conditioned media de-pleted of exosomes (TdCM) had only modest recovery after day 3, but not day 7.
Assessment of paw grasp function is indicative of TBI-associated loss of strength and was apparent in all animals subjected to injury. After day 3 post TBI, TBI exosome-treated (TE) animals scored significantly better on the paw grasp test compared to TBI-vehicle-treated (T) animals. The animals in the conditioned media de-pleted of exosomes and the exosomes dede-pleted of MALAT1 groups again showed a modest improvement at day 3 that was not maintained at day 7 (Fig. 1c). Re-sults show only the cohort treated with exosomes main-tained this significant treatment effect on the paw grasp
assessment demonstrating continued recovery of
strength for the exosome-treated group compared to TBI sham treatment (two-way ANOVA followed by Tukey’s post hoc,p< 0.001).
We performed Nissl staining to quantify the lesion volumes and surrounding damage after TBI in the peri-impact area. Administration of exosomes was found to significantly reduce both the impact (Fig. 1d) and peri-impact (Fig.1e) area of TBI-associated injury in the ipsilateral hemisphere. Exosomes depleted of MALAT1 (TEdM) had moderate improvement in peri-impact measures, but not in impact area (Fig.1d, e). Treatment with conditioned media depleted of exosomes did not show recovery in either the impact or the peri-impact
area after TBI injury. Examples of images used for ana-lysis are shown in Fig.1g, as well as examples of images used to quantify the live neurons in the peri-impact area.
Imaging of exosomes in vivo shows distribution primarily to the abdomen and head regions
We determined the biodistribution of XenoLight
DiR-labeled exosomes in vivo in rats with CCI treated with exosomes and exosomes depleted of MALAT1. Exosomes were administered through the jugular vein of TBI animals 3 h after injury, and their biodistribution was tracked at time points 1, 4, 12, 24, 48, and 72 h and 11 days after surgery (Fig. 2). Minimal DiR signal was detected in both the head and body regions of the sham control animals as expected which provided a reference value throughout the analysis. Within the first hour of transplantation, no noticeable signal was observed in the head region of either treatment groups, whereas a high level of fluorescent signal was present in the abdomen of both TBI groups treated with either exosomes (TE) or exosomes deleted of MALAT1 (TEdM) animals. Fluores-cent signal slightly increased after 4 h for both groups in both the head and abdomen regions of the animals. At the 12-h time point, the signal in the head region had in-creased from the previous time points and continued to increase at 24 h where it seemed to plateau through 48 and 72 h until decreasing on day 11 after transplantation. The abdomen region instead displayed the opposite trend and showed a gradually decreasing DiR signal after 4 h that continued to decline at the 12-, 24-, 48-, and 72-h time points with the lowest radiant efficiency observed on day 11. Quantitative analysis confirmed these observa-tions, as shown in Fig. 2a, b. Throughout all the data points, the group treated with exosomes depleted of MALAT1 showed a slightly higher average radiant effi-ciency while following the same trend as exosome-treated animals, but this did not achieve significance.
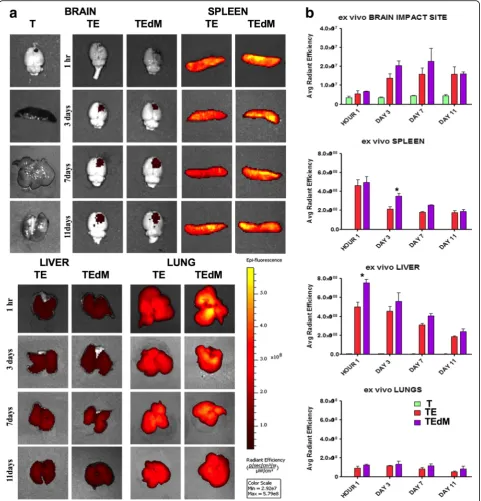
Imaging of exosomes ex vivo in organs shows localization primarily to the spleen and brain
clearance initially. At day 3, a reduction in signal was observed in the spleen and liver and this continued over time. Signal intensity in the brain, however, increased on day 3 and continued to increase through day 7.
RNA sequencing transcriptome analysis identifies cellular processes crucial to recovery that are specifically mediated by MALAT1
To gain insight into genomic changes following CCI and its treatment with hASC-derived exosomes, we performed RNA sequencing. Transcriptome analysis provides valuable knowledge of genomic changes
following brain injury and the response to treatment with exosomes. We isolated RNA from the brains, specifically an area near the impact site, and the spleens of rats at day 7 following TBI in the sham
surgery—control (C), TBI with vehicle (T), TBI
treated with exosomes (TE), and TBI treated with MALAT1-depleted exosomes (TEdM) groups. Four rats of each group were randomly chosen and pooled to maximize biological diversity and sent for RNA Seq (Ocean Ridge Biosciences). The percent of mapped reads to total genome over total read across all sequencing was 96 ± 0.7%.
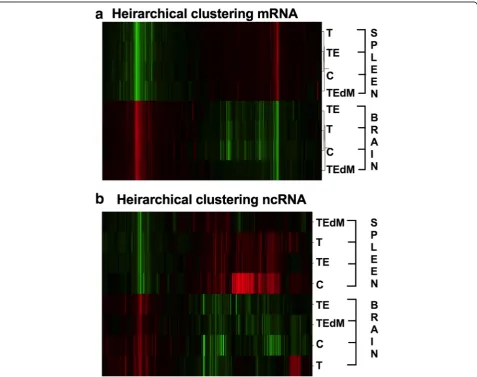
We performed hierarchical clustering of the entire RNA Seq transcriptome data in order to evaluate the re-lationship between gene expression profiles in the brain or spleen with respect to the different treatments, i.e.,
no TBI sham surgery control (C), TBI treated with ve-hicle (T), TBI treated with exosomes (TE), and TBI treated with exosomes depleted of MALAT1 (TEdM). The same RPKM data for all 19,058 detectable genes
were used for hierarchical clustering analysis by Cluster 3.0 software. Genes were log-2 transformed and median centered prior to hierarchical clustering. Hierarchical clustering (Fig.4a) was conducted on genes and samples using centered correlation as the similarity metric and
average linkage as the clustering method. Figure 4b
shows the hierarchical clustering conducted for ncRNAs as described above for gene expression. Each color-bar unit in both hierarchical clustering represents a differ-ence of one log 2 unit in RPKM value. Zero (0) is the median RPKM value across all samples. Heat maps with row dendograms are shown to visualize the result of the hierarchical clustering calculation. This depicts the dis-tance or similarity between rows and which nodes in each row belongs to, as a result of clustering. For both the brain and spleen, the results of the clustering heat
map show groups of genes or ncRNAs whose expression is affected by TBI and the exosome treatments. Principal component analysis showed similar distinction between groups (data not shown).
RNA Seq of the brain and spleen transcriptome identifies genes affected by TBI and treatment with exosomes
We further analyzed the highly enriched genes for the spleen and brain. The results (above Fig.4a, b) indicated specific sets of genes that were affected by TBI that were distinct between the spleen and brain as expected based on cell type and cell-specific markers. Based on fold changes, the top genes affected by TBI and treatment with exosomes in the spleen were enzymes such as
pran-creatic α-amylase, prancreatic α-amylase precursor,
phospholipase A2, caroxypeptidase B precursor, bile
salt-activated lipase precursor, chymotrypsinogen B pre-cursor, carboxypeptidase A2 prepre-cursor, and anionic tryp-sin 1 which were elevated after TBI and reduced with exosome treatment. Further, in the spleen, genes that were upregulated following TBI were related to GO cat-egories of enzyme inhibitor activity, defense response, platelet alpha granule lumen, and protein-DNA com-plexes. In the brain, our RNA Seq data revealed previ-ously undescribed transcripts ENSRNOG00000047520, ENSRNOG00000049727, ENSRNOG00000050024, and ENSRNOG00000046742 whose levels changed with TBI and exosome treatment. Additionally, genes in the brain that were upregulated following TBI were related to im-mune responses, cellular response to stress, aging, and DNA damage. The splicing index of genes in the spleen that were predominantly changed with TBI and exosome treatment were Tbcd, Chmp1a, Cnst, Lphn1, Zfp560, Mrpl23, Emc4, Zfp329. The splicing index of genes in the brain that were predominantly changed with TBI and exosomes treatment were Rps6ka3, Nrtk3, Nap1l1, Eif4g1,Fsd1,Trim44,Dst,Rps15,Fkbp2,Rabgap1l.
Gene expression patterns following treatment with hASC exosomes
Of most interest to this study are gene changes that fit the pattern observed with both behavioral testing and le-sion area analysis. This expresle-sion pattern changes shown following TBI are lessened with exosome treat-ment but not by treattreat-ment with exosomes depleted of MALAT1. The genes that fit this pattern of gene expres-sion responses were labeled (+ 1; up with TBI (T), down with TBI + exosomes (TE), and up with TBI +
MALAT--depleted exosomes (TEdM)) or the opposite pattern (−
1; down with TBI (T), up with TBI+ exosomes (TE), and down with TBI + MALAT-depleted exosomes (TEdM)). The data was further filtered for a minimum of twofold gene expression change compared with TBI and ana-lyzed using Ingenuity Pathway Analysis (IPA) for both the brain and the spleen separately. The IPA bioinfor-matics package identifies regulatory nodes (upstream regulators) based upon the fold change values of dataset to predict a relationship of these nodes to drive the de-tected changes in gene expression. In this manner, the top upstream regulators that fit the pattern + 1 and −1
are listed for the brain and spleen in Table 1. Only
values with a significant -log (p value) were included in the tables and if the Z score indicates a predicted signifi-cant up- or downregulation within each pattern than it is also noted in the table. Canonical pathways identified as significant are listed in Table2.
Brain mRNA changes
For the pattern + 1, several of the predominant predicted upstream nodal regulators from the IPA analysis are
related to inflammatory pathways, IL1β, IFNG, etc.
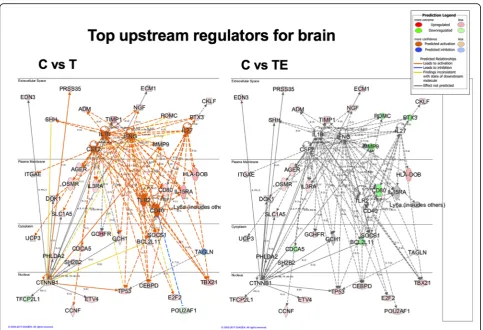
which is in agreement with the literature on TBI alone. To illustrate this graphically, Fig.5 shows top upstream regulatory networks in the C vs. T comparison. There is a strong predicted upstream activation of inflammatory
regulators such as IL1β, IFNG, TLR2, IL27, and CD40
(indicated in orange). Also illustrated in this figure are the actual gene expression changes driving the predic-tions, which show significant overlap in the nodal net-works depicted. Furthermore, CTF1 was also predicted to be an upstream regulator by this analysis, which is consistent with its role in other brain injury models and inflammation. In addition, there were changes in CTNNB1: the gene for beta catenin which is an import-ant regulator for the WNT pathway, WNT is known to be involved in neural repair pathways and neurogenesis, and is also related to SOX15 which is discussed further below. This pathway is downregulated with TBI, and the extent of down regulation is lessened following treat-ment with exosomes as reflected in the color of the regulator moving from a darker orange to a lighter color. The right side of the figure illustrates the overlay of the pattern of gene expression and predictions for the nodal regulation in the TBI treated with exosomes group. All of the inflammatory nodes such as IL1ß, IFNG, CD40, and IL27 show no predicted upregulation from control which is indicated by the lack of color, and demonstrates
that the exosomes significantly lower the
pro-inflammatory gene expression patterns observed with injury. This is driven by decreased gene expression of pro-inflammatory genes PTX3, MMP9, POMC, and CD80 in this dataset which is shown by the green color. Not shown in this figure is the network of these up-stream regulators for the third aspect of this pattern which is C vs. TdM comparison; when exosomes de-pleted in MALAT1 are given after TBI, the network of gene expression and predicted upstream regulators is an almost identical pattern to the C vs. T network shown here. This is in agreement with the pattern of behavioral and histological changes presented above.
The predicted upstream regulators for the pattern −1 with (gene expression going down with TBI) are related to transcription regulators such as SOX15, RFX3, and TCF7L1 as well as ubiquitin and HSP70 (Table 1, different func-tional groups depicted by colors). This suggests that there is a decline in transcriptional activation in regenerative pathways as illustrated by changes in SOX15 expression, which is part of the WNT/β-catenin pathway involved in cellular proliferation and stem cell proliferation.
Table 1Upstream regulators
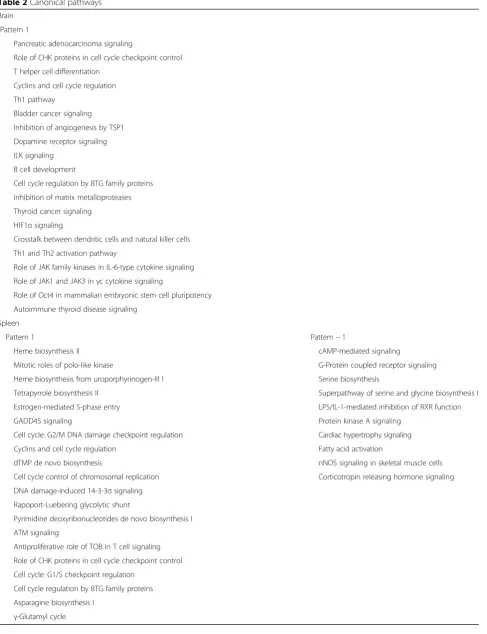
Table 2Canonical pathways
Brain
Pattern 1
Pancreatic adenocarcinoma signaling
Role of CHK proteins in cell cycle checkpoint control
T helper cell differentiation
Cyclins and cell cycle regulation
Th1 pathway
Bladder cancer signaling
Inhibition of angiogenesis by TSP1
Dopamine receptor signaling
ILK signaling
B cell development
Cell cycle regulation by BTG family proteins
Inhibition of matrix metalloproteases
Thyroid cancer signaling
HIF1αsignaling
Crosstalk between dendritic cells and natural killer cells
Th1 and Th2 activation pathway
Role of JAK family kinases in IL-6-type cytokine signaling
Role of JAK1 and JAK3 inγc cytokine signaling
Role of Oct4 in mammalian embryonic stem cell pluripotency
Autoimmune thyroid disease signaling
Spleen
Pattern 1 Pattern−1
Heme biosynthesis II cAMP-mediated signaling
Mitotic roles of polo-like kinase G-Protein coupled receptor signaling
Heme biosynthesis from uroporphyrinogen-III I Serine biosynthesis
Tetrapyrrole biosynthesis II Superpathway of serine and glycine biosynthesis I
Estrogen-mediated S-phase entry LPS/IL-1-mediated inhibition of RXR function
GADD45 signaling Protein kinase A signaling
Cell cycle: G2/M DNA damage checkpoint regulation Cardiac hypertrophy signaling
Cyclins and cell cycle regulation Fatty acid activation
dTMP de novo biosynthesis nNOS signaling in skeletal muscle cells
Cell cycle control of chromosomal replication Corticotropin releasing hormone signaling
DNA damage-induced 14-3-3σsignaling
Rapoport-Luebering glycolytic shunt
Pyrimidine deoxyribonucleotides de novo biosynthesis I
ATM signaling
Antiproliferative role of TOB in T cell signaling
Role of CHK proteins in cell cycle checkpoint control
Cell cycle: G1/S checkpoint regulation
Cell cycle regulation by BTG family proteins
inflammatory pathways. Cell cycle and cancer-related pathways are further noted, most likely changing due to cell death and injury caused by CCI (Table2).
Spleen mRNA expression
We also examined gene expression in the spleen as our data shows predominant localization of exosomes to the spleen. This finding was important, as a significant body of literature has demonstrated that intravenous ments with exogenous cell therapies and other treat-ments such as conditioned media from stem cells involve the spleen. Our data presented here shows the presence of exosomes in the spleen at an early time point following injection, prior to the exosomes being
observed in the brain. Table 1 shows the top ranking
predicted upstream regulators based upon p value of
overlap, and if there was a significant Z score for pre-dicted activation or inhibition. For the + 1 pattern of ex-pression that increases with TBI, there was a predicted inhibition of CDKN1A suggesting a decrease in cellular proliferation. This is supported by changes in other proliferation-related pathways like CCND1, which is a cell cycle regulator related to both AMPK and PTEN bioenergetics pathways as well as inflammation pathways like IL8 and ILK. Many of the predicted upstream regu-lators are nuclear transcription factors influencing many aspects of cellular function including cellular prolifera-tion, cell cycle control, and DNA damage. This again is likely a reflection of the response to the brain injury effecting other organ systems.
To explore the regulatory networks of genes affected in the spleen in response to the + 1 pattern of expres-sion, we merged two of the top networks identified in IPA and this is illustrated in Fig.6. The left panel shows these network changes along with predicted nodes in addition to relationships with canonical pathways. Again, as in the brain, a number of inflammation-related
path-ways including TGFβ and INFG are altered with TBI.
Also shown are a number of changes to pathways related to the transcriptional regulators MYC and NUPPR1. The predicted inhibition of NUPPR1 with TBI is mitigated with the exosome treatment as shown in the right panel and might be related to an increase in POLE2 in the exosome-treated group. Also of interest is a predicted regulation of these networks by beta-estradiol activation following TBI which is inhibited following exosome treatment (Fig. 6). A number of genes related to this pathway are involved in inflammatory responses and cel-lular stress, such as mir-322 which is responsive to hyp-oxia and oxidative stress [32]. Beta-estradiol is known to play a role in splenic response to injury [33–36] by
modulating macrophage and dendritic cell function, thus are consistent with effects of estradiol in other injury models. It is important to note that this does not neces-sarily mean that estradiol is driving this alteration in our dataset; it simply means that estradiol alters splenic in-flammatory markers in the same way as what is observed in our dataset. Several investigations have suggested that estradiol reduces MALAT1 [37–39]; thus, a predicted inhibition of estradiol by exosome treatment may reflect increased action of MALAT1. Further studies are needed to elucidate an interaction of exosome treatment with estradiol.
The expression of genes in the −1 pattern
demon-strated inhibition of several aspects of splenic function including the ephrins A2, 3, 4, and 5, which regulate interaction with hematopoiesis [40]. While these pro-cesses are more related to ephrin A1, for our study, ephrin A2 is of particular interest as it plays an im-portant role in monocyte adhesion and transendothe-lial migration via integrins. In a report by Konda et al.,
an increase in ephrin A2 stimulated monocyte
infiltration and sequestration into the red pulp of the spleen via an interaction with integrin and additional undetermined molecular pathways [41]. The release of monocytes from the red pulp of the spleen is a known consequence of injury [42]; therefore, we would pre-dict that inhibition of ephrin A2 would be consistent
with release of monocytes from the splenic red pulp into the bloodstream. As presented, this predicted loss of the inhibition of ephrins is seen following treatment with exosomes, but treatment with exosomes depleted of MALAT1 showed similar results to those observed for rats that received TBI with no treatment. This is a
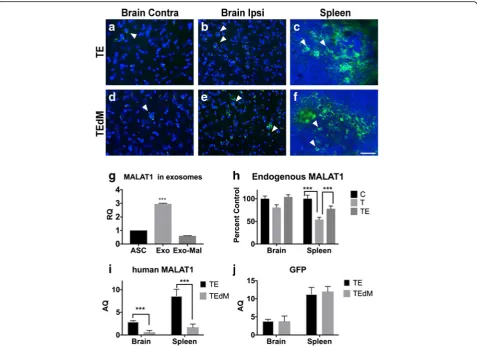
Fig. 7Localization of exosomes and validation of MALAT1 and GFP levels. Localization of exosomes and MALAT1 to the brain and spleen. Confocal imaging of exosome-positive expression of GFP in the brain and spleen of TBI rats. Images reveal migration of exosomes to both the contralateral and ipsilateral cortical region of the TBI-impacted brains near the impact site (a,b,d,e) and the spleen (c,f) of TE and TEdM rats as shown by detecting GFP expression (green) in cells with DAPI-positive staining (blue) 11 days after transplantation. White arrows indicate cells with exosomes. There was higher migration to the ipsilateral cortex near the impact site than that observed in the contralateral cortex which agrees with our ex vivo imaging data in Fig.3. Scale bar infequals 50μm.gMALAT1 expression was measured in hASC-isolated exosomes and isolated exosomes with MALAT1 knockdown. Relative to the MALAT1 level in hASC, there is an increase in MALAT1 in the secreted exosomes, and this was knocked down significantly with the antisense oligonucleotide treatment. The results were analyzed with two-tailed Student’sttest using PRISM4 statistical analysis software (GraphPad, San Diego, CA). A level ofp< 0.05 was considered statistically significant. ***p< 0.001.hEndogenous MALAT1 levels in rat brain and spleen decrease with TBI: Following TBI and treatment with hASC exosomes, the levels of MALAT1 within the rat brain and spleen were analyzed by PCR using rat-specific primers. RNA was extracted and samples were pooled from four rats each from the no TBI, TBI treated with vehicle, and TBI treated with exosomes. Graph represents percent control with no TBI group designated as 100%. The experiment was repeated five times. The results were analyzed with two-tailed Student’sttest using PRISM4 statistical analysis software (GraphPad, San Diego, CA). A level ofp< 0.05 was considered statistically significant. ***p< 0.001 highly significant between control (no TBI) and TBI with vehicle treatment and between TBI and TBI treated with hASC exosomes for MALAT1.iVerification that hASC exosomes were taken up by the brain and spleen: SYBR Green real-time qPCR using human MALAT1 primers andjGFP primers was performed for absolute quantification. GAPDH served as control. For absolute
potentially interesting finding, and although at this point we cannot make a direct correlation between this predicted change in ephrin A2 regulation follow-ing TBI and treatment with exosomes, it is consistent with the observed behavioral and histological improve-ment with the exosome treatimprove-ment. As previously dis-cussed, one possible role of the spleen in TBI and other brain insults is the release of monocytes into cir-culation, which participate in the secondary insult at the site of injury.
Validation of RNA Seq results of gene expression
Confocal microscopy confirmed positive localization of GFP-labeled exosomes within both the contralateral and ipsilateral brain regions as well as in the spleen (Fig.7a–f ). The GFP signal was more robust in the ipsilateral hemi-sphere compared to the contralateral and was located mainly in close proximity to the impacted area. This may be the result of a breakdown of the blood-brain barrier at the site of injury. To further validate that exosomes were taken up by the brain and spleen, RNA isolated from either the brain or the spleen was reverse transcribed to cDNA and used in quantitative SYBR Green
real-time qPCR using primers for rat and human MALAT1. Our results show that endogenous rat MALAT1 is depleted in the spleen and the cortex near the injury site following injury and increased with exosome treatment. Further, exosomes not de-pleted of MALAT1 were shown to deliver human
MALAT1 to the brain and spleen (Fig.7g, h). These
results show that exosomes are efficiently taken by the brain and spleen.
To validate our results from RNA Seq, we used quan-titative SYBR Green real-time qPCR to determine levels of the genes altered in both the spleen and the brain fol-lowing TBI with and without exosome treatment.
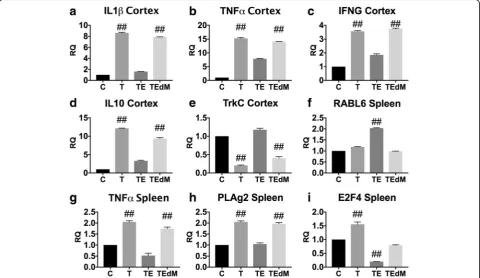
Fig-ure 8 shows validation of spleen expression of PLAg2,
TNFα, E2F4, and RABL6 and brain cortex expression of
IL1β, TNFa, IFNG, and IL10. These genes showed
sig-nificant fold changes in RNA Seq data and are compo-nents of the predicted networks. Although the pattern of expression for IL10 is not consistent with the overall predicted changes in inflammatory networks, it does replicate the data in the RNA Seq dataset. Our qPCR re-sults show expression of these genes that are in agree-ment with the RNA Seq data.
Fig. 8a–iValidation of RNA Seq data using qPCR. Real-time qPCR validation of representative genes identified by RNA Seq data in the cortex and spleen that are affected by TBI and treatment with exosomes. All assays were run in triplicate, and data is expressed as the mean ± SEM. Data for each gene was analyzed by one-way ANOVA followed by Dunnet’s multiple comparison test.##
p< 0.01 indicates that group was different from control. ANOVA for each graph are IL1ß cortex (F(3, 8) = 16,008); TNFαcortex (F(3, 8) = 5989); IFNG cortex (F(3, 8) = 1784); TrkC cortex (F(3, 8) = 814); IL10 cortex (F(3, 8) = 2980); RABL6 spleen (F(3, 8) = 4640); TNFαspleen (F(3, 8) = 286); E2F4 spleen (F(3, 8) = 516); PLAg2 spleen
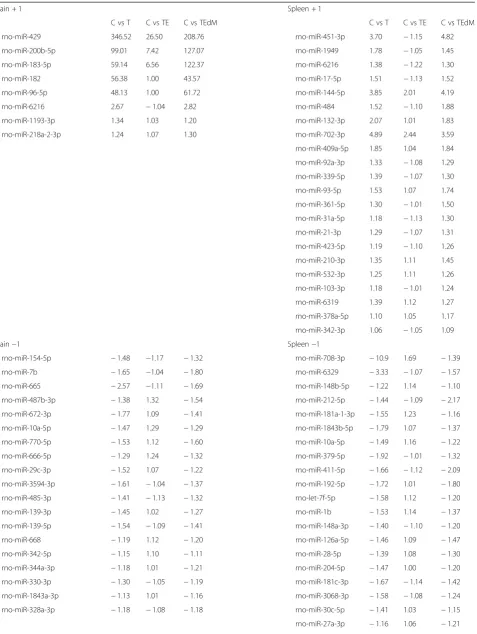
Table 3Changes in noncoding RNA miRNA
Brain + 1 Spleen + 1
C vs T C vs TE C vs TEdM C vs T C vs TE C vs TEdM
rno-miR-429 346.52 26.50 208.76 rno-miR-451-3p 3.70 −1.15 4.82
rno-miR-200b-5p 99.01 7.42 127.07 rno-miR-1949 1.78 −1.05 1.45
rno-miR-183-5p 59.14 6.56 122.37 rno-miR-6216 1.38 −1.22 1.30
rno-miR-182 56.38 1.00 43.57 rno-miR-17-5p 1.51 −1.13 1.52
rno-miR-96-5p 48.13 1.00 61.72 rno-miR-144-5p 3.85 2.01 4.19
rno-miR-6216 2.67 −1.04 2.82 rno-miR-484 1.52 −1.10 1.88
rno-miR-1193-3p 1.34 1.03 1.20 rno-miR-132-3p 2.07 1.01 1.83
rno-miR-218a-2-3p 1.24 1.07 1.30 rno-miR-702-3p 4.89 2.44 3.59
rno-miR-409a-5p 1.85 1.04 1.84
rno-miR-92a-3p 1.33 −1.08 1.29
rno-miR-339-5p 1.39 −1.07 1.30
rno-miR-93-5p 1.53 1.07 1.74
rno-miR-361-5p 1.30 −1.01 1.50
rno-miR-31a-5p 1.18 −1.13 1.30
rno-miR-21-3p 1.29 −1.07 1.31
rno-miR-423-5p 1.19 −1.10 1.26
rno-miR-210-3p 1.35 1.11 1.45
rno-miR-532-3p 1.25 1.11 1.26
rno-miR-103-3p 1.18 −1.01 1.24
rno-miR-6319 1.39 1.12 1.27
rno-miR-378a-5p 1.10 1.05 1.17
rno-miR-342-3p 1.06 −1.05 1.09
Brain−1 Spleen−1
rno-miR-154-5p −1.48 −1.17 −1.32 rno-miR-708-3p −10.9 1.69 −1.39
rno-miR-7b −1.65 −1.04 −1.80 rno-miR-6329 −3.33 −1.07 −1.57
rno-miR-665 −2.57 −1.11 −1.69 rno-miR-148b-5p −1.22 1.14 −1.10
rno-miR-487b-3p −1.38 1.32 −1.54 rno-miR-212-5p −1.44 −1.09 −2.17
rno-miR-672-3p −1.77 1.09 −1.41 rno-miR-181a-1-3p −1.55 1.23 −1.16
rno-miR-10a-5p −1.47 1.29 −1.29 rno-miR-1843b-5p −1.79 1.07 −1.37
rno-miR-770-5p −1.53 1.12 −1.60 rno-miR-10a-5p −1.49 1.16 −1.22
rno-miR-666-5p −1.29 1.24 −1.32 rno-miR-379-5p −1.92 −1.01 −1.32
rno-miR-29c-3p −1.52 1.07 −1.22 rno-miR-411-5p −1.66 −1.12 −2.09
rno-miR-3594-3p −1.61 −1.04 −1.37 rno-miR-192-5p −1.72 1.01 −1.80
rno-miR-485-3p −1.41 −1.13 −1.32 rno-let-7f-5p −1.58 1.12 −1.20
rno-miR-139-3p −1.45 1.02 −1.27 rno-miR-1b −1.53 1.14 −1.37
rno-miR-139-5p −1.54 −1.09 −1.41 rno-miR-148a-3p −1.40 −1.10 −1.20
rno-miR-668 −1.19 1.12 −1.20 rno-miR-126a-5p −1.46 1.09 −1.47
rno-miR-342-5p −1.15 1.10 −1.11 rno-miR-28-5p −1.39 1.08 −1.30
rno-miR-344a-3p −1.18 1.01 −1.21 rno-miR-204-5p −1.47 1.00 −1.20
rno-miR-330-3p −1.30 −1.05 −1.19 rno-miR-181c-3p −1.67 −1.14 −1.42
rno-miR-1843a-3p −1.13 1.01 −1.16 rno-miR-3068-3p −1.58 −1.08 −1.24
rno-miR-328a-3p −1.18 −1.08 −1.18 rno-miR-30c-5p −1.41 1.03 −1.15
Noncoding RNA levels change with injury and exosome treatment in a MALAT1-dependent manner
Long noncoding RNAs promote epigenetic modifica-tions and regulate gene expression by direct interaction with pre-mRNA of genes or by acting as scaffolding to tether a complex of micro RNAs to promote transcrip-tion of genes. There is an emerging appreciatranscrip-tion for its ability to not only interact with other noncoding RNAs but also promote transcription of these noncoding RNAs. Among the noncoding RNAs (ncRNAs) detected in the brain and spleen, a large number are associated with tRNA, rRNA, and small nuclear RNAs (snRNAs) whose function is constitutive in transcription and trans-lation processes. Our study points to two primary classes of ncRNAs that are directly affected by the exosomes containing MALAT1: the microRNAs (miR) and the small nucleolar RNAs (snoRNAs).
miRNAs regulate gene expression by directly binding to their target mRNA. Our RNA Seq data identified
miR-200b, miR-200a, miR-183, miR-182, miR-96, and miR-451a as being significantly upregulated four- to eightfold in the brain with TBI (Table3). These miRNAs were previously shown to regulate apoptosis in various dis-eases [43–52]. Significantly, treatment with exosomes down-regulated their expression; however, MALAT1-depleted exosomes did not have a significant effect on the expression of these miRNAs. When the RNA Seq data of the brain is sorted and analyzed by the + 1 pattern described above, we note that miR-96-5p, miR-182, miR-183-5p, miR-200b-5p, miR-429, mir-6216, miR-1193-3p, and miR-218a-2-3p in-crease following TBI, dein-creased by exosome treatment, and the reversal is not seen with MALAT1-deficient exosomes. miR200b-3p and miR-182-5p are increased following TBI in the brain, the latter of which is directly modulated by MALAT1. Both of these miRNAs also show a reduction fol-lowing treatment with exosomes, but not exosomes depleted of MALAT1, opening the possibility that MALAT1 in exo-somes may be responsible for the shift in pattern. A second Table 3Changes in noncoding RNA miRNA(Continued)
rno-miR-139-5p −1.33 −1.07 −1.24
rno-miR-140-5p −1.30 1.06 −1.25
rno-miR-337-5p −1.42 −1.05 −1.34
rno-miR-30a-5p −1.16 1.03 −1.08
rno-miR-150-5p −1.29 −1.10 −1.16
rno-miR-147 −1.12 1.04 −1.09
rno-miR-30e-5p −1.24 −1.08 −1.14
ncRNA including snoRNA, snRNA
Brain + 1 Brain−1
C vsT C vs TE C vs TEdM C vsT C vs TE C vs TEdM
snRNA U6 1.57 1.00 1.37 snoRNA SNORD42 −1.90 −1.24 −1.82
snoRNA SNORD24 1.28 1.11 1.38 lncRNA PVT1 3 −1.98 −1.34 −2.18
snoRNA SNORD60 1.25 1.00 1.22 snoRNA SNORA28 −1.29 −1.07 −1.97
snRNA U6 1.09 1.00 1.06 rRNA Rnr2 −1.25 −1.07 −1.23
snoRNA ACEA U3 1.64 1.05 1.59 rRNA Rnr2 −1.09 −1.10 −1.29
snoRNA SNORA62 1.51 −1.04 1.27 lncRNA RMST 2 −1.19 −1.06 −1.13
snoRNA SNORA73 1.39 −1.24 1.30
snoRNA SNORD62 1.76 −1.21 1.32
snoRNA SNORD15 3.17 1.38 3.12
snoRNA SNORA38 1.06 −1.00 1.06
Spleen + 1 Spleen−1
snoRNA SNORD74 1.85 −1.39 1.52 snoRNA SNORA41 −3.84 −1.14 −1.85
snRNA U6 1.67 −1.27 1.67 snoRNA SNORD33 −3.68 −1.64 −3.91
snoRNA SNORD75 1.68 −1.03 1.50 snoRNA SNORA54 −3.49 1.06 −1.98
scRNA 1.32 −1.23 1.14 snoRNA SNORD21 −3.48 −1.48 −3.88
lncRNA LOC100909539 1.37 −1.06 1.48 snoRNA SNORA71 −2.94 −1.55 −3.67
misc_RNA 1.31 1.10 1.42 vault_RNA Vault −2.93 −1.49 −5.34
set of miRNAs include miR-487b-3p, miR-672-3p,
miR-10a-5p, miR-770-5p, miR-666-5p, miR-29c-3p,
miR-139-3p, miR-668, miR-344a-3p, and miR1843a-3p that follow the−1 pattern such that they decrease following TBI, increased by exosome treatment, and the reversal is not seen with MALAT1-deficient exosomes. Of the miRNAs whose expression changes with injury and exosome treatment, miR10a-5p follows the −1 pattern in the brain and the spleen. miR10a-5p is extensively studied for its role in the
development and regulation of TOP mRNAs [53].
miR10a-5p promotes expression of ribosomal proteins, elongation factors, and other proteins associated with trans-lation apparatus, thereby influencing global protein synthe-sis. miR10a-5p expression is increased in stem cells and in our experiments, making it possible that miR10a-5p is part of the exosomal cargo, which is transferred both to the brain and spleen, and has a predominant role in enhancing the re-sponse to injury and aiding the recovery upon treatment with exosomes.
SnoRNAs function as sequence-specific guides to dir-ect site-specific nucleoside modifications for other non-coding RNAs such as rRNA and snRNA. A select few snoRNAs are shown to interact with mRNA and regu-late its splicing [54–56]. Recent breakthroughs have pre-dicted the interaction of lncRNAs with snoRNAs [57]; however, their association are not shown in vivo. SnoR-NAs are transcribed as nuclease products from genes. Our data shows, for the first time, that a long noncoding RNA MALAT1 regulates the expression of snoRNAs in the brain. Notably, SNORA31, SNORD33, SNORD64,
SNORA18, SNORA17, SNORD44, SNORD47,
SNORD28, SNORD113, SNORD62, SNORA29, and SNORD2 were upregulated two- to fourfold with some treatment following TBI; MALAT1-depleted exo-somes did not increase the levels of these snoRNAs
(Table 3). Brain-specific snoRNAs in mice MBI48 and
MBI52 were shown to promote memory and learning [58, 59]. While lncRNAs are known to have a role in pre-mRNA splicing, mRNA editing, and mRNA stability control, this is the first evidence showing that lncRNA MALAT1 regulates the expression and transcription of brain snoRNAs.
Discussion
In summary, we have demonstrated that exosomes se-creted from hASCs have a beneficial role in modulating pathology following mild TBI, particularly those contain-ing MALAT1. Our results have shown an attenuation in TBI-induced motor deficits as well as decreased cortical damage at both the impact and peri-impact level after ad-ministration of exosome treatment that is dependent on MALAT1. Our previous in vitro study using HT22 cells demonstrated that MALAT1 has a role in neuroprotection in vitro. Indeed, we showed that hASC-derived exosomes
increase neuronal survival and proliferation in vitro in the context of several models of injury and this activity is lost when the exosomes are depleted of MALAT1 [27]. These results suggest that intravenous administration of exo-somes generated from hASCs may represent a novel therapeutic approach for treatment of TBI. This is consist-ent with the report that MALAT1 regulates pathology fol-lowing ischemic injuries [28]. To distinguish the actions of subcomponents of conditioned media, we treated rats with CM that did not contain exosomes and found it had a reduced effect on most measures when compared to exosome treatment. However, there was still some effect seen from CM depleted of exosomes. The difference be-tween the exosome treatment and the CM depleted of exosomes suggests the cargo found within the exosome is important for providing significant neuroprotection and promoting regeneration after injury. Secondly, the effect shown with CM treatment, even depleted of exosomes, suggests the possibility that the CM maintains valuable se-creted factors.
Exosomes are known to hold a plethora of biological molecules in its complex cargo including proteins, lipids, mRNAs, and miRNAs capable of interacting with sur-rounding cells in order to modify the host environment
[60]. Exosomes generated from MSCs have been shown
to significantly increase brain angiogenesis and neuro-genesis as well as reduce neuroinflammation; however, the specific molecular constituents driving regeneration were not identified in most studies [20]. It is thought that RNA cargo plays an important role in the
cell-to-cell communication driving neuroprotection,
making it a key component in promoting the recovery seen following injury. Our study demonstrates that lncRNA MALAT1 is a critical component of the hASC exosomes and drives the recovery process. Many single molecular pathway approaches have shown little or no promise in clinical trials [61], and this emphasizes a need for combination therapies to tackle the complexity of secondary neurological injury post TBI. Treatment with exosomes is considered to be a multi-targeted approach as they are able to seek and modulate multiple targets and enforce a neuroprotective environment, providing further promise for their use as a therapeutic approach.
In this study, we demonstrate for the first time the in
vivo and ex vivo biodistribution of intravenous
migration to the liver probably serves as a filtering and elimination process, the migration of the exosomes to the spleen implicates a probable immune interaction. It has been shown that injury induces the release of im-mune cells from the spleen with consequent infiltration into the brain [62] and that this is a significant aspect of the secondary insult following TBI as discussed in the introduction. It has been shown that blocking entry of inflammatory monocytes into the brain can significantly reduce the observed damage and offers recovery of cog-nitive function [9]. The spleen is one source of periph-eral macrophages and monocytes, and it is possible that treatment with exosomes inhibits the release of these immune cells into circulation. This in turn lessens the infiltration into the brain through the disrupted BBB and prevents the contribution of peripheral immune cells to the secondary injury. This was supported by the observed inhibition of ephrin family gene expression fol-lowing TBI as a predicted upstream regulator in the spleen following injury. This inhibition was modulated by exosome treatment but not by treatment with exo-somes depleted of MALAT1. Ephrins are regulators of transendothelial migration of monocyte/macrophages and have been shown to play a role in monocyte adhe-sion in the red pulp of the spleen [41]. Thus, a decrease with TBI could be reflective of a migration of monocytes into the circulation. Therefore, the observed migration of the exosomes to the spleen immediately after admin-istration could be an important aspect of the mechanism of action that elicits the improvement in both cellular and functional recovery as seen here post TBI. Future studies can look deeper into this potential mechanism of action and the role of MALAT1 at the level of the spleen.
Exosomes were also observed in the brain, albeit with a much lower degree of signal and with a different time course than that observed for the spleen. Exosomes were primarily observed around the site of injury. The BBB is known to be disrupted by TBI [63] peaking at 4–6 h and 2–3 days after injury [64] and therefore may explain one factor for the observed delayed localization of exosomes. Alternatively, it is also possible that there is expression of chemokine or signaling molecules that would attract the exosomes to the area of injury. At this time, we do not know if the primary site for the therapeutic effect of the exosomes is at the level of the spleen or the brain, and it is likely that both play some role. It has been shown that hASC-derived exosomes like those studied here have direct neuroprotective effect on neuronal cells [27] and this is another area of future investigation.
RNA Seq is a robust method to evaluate the effect of TBI at the genomic level. We have identified genes and pathways that are affected by TBI as well as the genomic influences of exosome treatment. Our study has
demon-strated that treatment with exosomes post TBI
significantly improves the outcome by modulating gene networks. The knowledge of specific genes and pathways as well as the influence of noncoding RNA in exosome treatment post TBI is crucial to develop an understanding of the multitude of events that occur simultaneously to promote healing. Our data indicates that not only genes involved in survival are affected but also those genes that are involved in the inflammatory and immune response to injury. The cargo carried by the exosomes is pivotal in cell-cell communication and influences the response to in-jury and recovery. Exosomes from hASC contain not only lncRNA MALAT1 but also additional lncRNAs and pro-teins [29]. Our study specifically focused on the role of MALAT1; however, as shown in the data, other ncRNAs or proteins carried in the exosomes may also aid in the re-covery process. Further studies are being undertaken to delineate additional players and the complex interactions between lncRNAs and other RNA and proteins.
The above results demonstrate that the lncRNA MALAT1 regulates expression of mRNA and ncRNA in-volved in the inflammatory response, apoptosis and cell survival, signal transduction by MAPK pathways, and transcription of genes. There is also an emerging appre-ciation for the ability of lncRNA to not only interact with other ncRNAs but also promote transcription of these ncRNAs. Our data demonstrates for the first time that a lncRNA promotes expression of snoRNAs. Our dataset contains a tremendous amount of information on novel and known genes in the brain and spleen that were not previously recognized. This RNA Seq data pro-vides a valuable tool to elucidate additional genes and ncRNAs in the brain and spleen and provides a robust biological system to validate its findings.
Conclusions
Taken together, our data demonstrate that hASC-derived exosomes containing MALAT1 have a beneficial effect on function and pathology following a CCI injury. Import-antly, we show that the lncRNA MALAT1 affects not only mRNA expression but also expression of noncoding RNA. Thus, the action of the exosomes is multifold and impacts a number of cell survival, inflammatory, and regulatory pathways in both the spleen and the brain. As exosomes show tremendous promise as therapeutics, understanding the importance of the cargo of the exosomes is critical for understanding their mechanism of action as well as deter-mining how to identify the exosomes with the most po-tential for benefit.
Abbreviations