R E S E A R C H
Open Access
A fast and high performance multiple data
integration algorithm for identifying human
disease genes
Bolin Chen
1, Min Li
2, Jianxin Wang
2, Xuequn Shang
1, Fang-Xiang Wu
3,4*From
IEEE International Conference on Bioinformatics and Biomedicine (BIBM 2014)
Belfast, UK. 2-5 November 2014
Abstract
Background:Integrating multiple data sources is indispensable in improving disease gene identification. It is not only due to the fact that disease genes associated with similar genetic diseases tend to lie close with each other in various biological networks, but also due to the fact that gene-disease associations are complex. Although various algorithms have been proposed to identify disease genes, their prediction performances and the computational time still should be further improved.
Results:In this study, we propose a fast and high performance multiple data integration algorithm for identifying human disease genes. A posterior probability of each candidate gene associated with individual diseases is calculated by using a Bayesian analysis method and a binary logistic regression model. Two prior probability estimation strategies and two feature vector construction methods are developed to test the performance of the proposed algorithm.
Conclusions:The proposed algorithm is not only generated predictions with high AUC scores, but also runs very fast. When only a single PPI network is employed, the AUC score is 0.769 by usingF2 as feature vectors. The average running time for each leave-one-out experiment is only around 1.5 seconds. When three biological networks are integrated, the AUC score usingF3as feature vectors increases to 0.830, and the average running time for each leave-one-out experiment takes only about 12.54 seconds. It is better than many existing algorithms.
Background
The term disease broadly refers to any condition that impairs normal conditions of part or all of an organism. Among various diseases, genetic disorders are those related to disfunction of one or multiple genes in the human genome. A genetic disorder may arise from or lead to mutations of one or more genes, or associate with over-/under expression of one or more genes [1]. This phenomenon is also a reflection of the module characteristic of real biological systems [2], where genes, proteins or other molecules often interact with each other to perform majority cellular processes [3-5]. Even
disfunction of a single kind of gene may lead to disas-sembling some protein complexes or disturb a whole normal cellular pathway, thereby resulting in genetic disorders.
The issue of disease gene identification is to find those genetic disorder related genes, or called disease genes for short, for each specific genetic disease. Various kinds of evidence have shown that disease genes are not ran-domly distributed, but rather tend to lie close to each other in many biological networks if they are associated the same or similar diseases [1,2,6,7].
Various kinds of biological data sources have shown their power for identifying disease genes. Oti et al. [2] use several sets of protein-protein interaction (PPI) data to predict disease genes. They argue that the use of PPI data can greatly increase the prediction performance for
* Correspondence: [email protected] 3
Division of Biomedical Engineering, University of Saskatchewan, 57 Campus Dr., S7N 5A9, Saskatoon, Canada
Full list of author information is available at the end of the article
disease gene identifications. Fraser et al. [8] investigate both yeast and human functional genomic data and argue that protein complexes contain valuable informa-tion which is helpful for detecting disease genes. Li et al. [9] investigate genetic diseases from a pathway based point of view. They find that individual pathways often enrich genes related to the same or similar diseases. Ma et al. [10] propose a combining gene expression and protein interaction (CGI) method to prioritize genes associated with a specific phenotype or trait. Ganegoda et al. [11] and Li et al. [12] use tissue-specific data together with PPI information to predict disease genes within individual tissues. Li et al. [13] also use Gene Ontology (GO) annotations to identify disease genes by combining topological features of PPI networks.
Besides different data sources, many different computa-tional methods have also been employed for identifying disease genes. Lage et al. [14] propose a Bayesian method to analyze a phenome-interactome network. Wu et al. [7] use a linear regression method to calculate the concor-dance score between a PPI network and a phenotype net-work. A tool called CIPHER is developed to predict disease genes based on those concordance scores. Vanunu et al. [15] formulate a smoothness-related priori-tization function in a PPI network, which predicts not only disease genes but also disease associated protein complexes. Zhang et al. [16] develop a Bayesian regres-sion approach to explain similarities of disease pheno-types by using diffusion kernels of one or several PPI networks. Köhler et al. [17] propose a random walk with restart (RWR) algorithm to detect disease genes by using a global network distance measure and random walk analysis.
Among those algorithms, the RWR algorithm [17] often yields better performance than other algorithms in terms of the prediction accuracy and the running time. However, the RWR algorithm can only take a single network as the input. When multiple kinds of biological networks need to be integrated, the RWR algorithm can only simply merge them into a mixed network as the input. Although this strategy can integrate useful information from different data sources, it integrates noises from them as well. Predictions of the RWR algorithm from a mixed network do not always perform better than those from individual networks. To improve the data integration method, Chen et al. [18] define a data integration rank (DIR) score to select the most informative evidence among a set of data sources. Chen et al. [19,20] recently propose two improved Markov random field (MRF) algorithms, which can auto-matically assign weights to different data sources by using Gibbs sampling processes. They often yield better perfor-mance than those using only single data source, and the MRF algorithms are even more better than the the DIR method in terms of the prediction accuracy. However, the
DIR algorithm is too time-consuming due to the calculat-ing of a normalized similarity measure for all gene pairs, while the MRF algorithms spend more time to maintain a long Markov chain for every gene during the Gibbs sampling processes.
In paper [21], we have proposed a logistic regression based algorithm to reduce the computational time of the MRF algorithm. It directly formulates the issue of disease gene identification as a binary logistic regression problem by using similar feature vectors as the MRF algorithm. No Markov chains need to be maintained for all genes, which makes the algorithm runs very fast. However, the logistic regression based algorithm in [21] is only a single network based algorithm, and the feature vector con-struction method is limited to using information of only direct neighbors. In this paper, we propose a fast and high performance multiple data integration algorithm to generalize the logistic regression based algorithm in [21]. Two aspects of generalization are proposed: (1) the gen-eralization of the feature vector construction method; and (2) the extension of the application scope for using multiple data integrations. To be more specific, we first theoretically introduce how binary logistic regression model is used to formulate the disease gene identification issue. Then, the feature vector construction method is generalized by using not only direct neighbors but also higher-order neighborhood information in a network. After that, the logistic regression based algorithm is extended to the multiple data integration case, where the parameters (weights) of different data sources can be tuned automatically. A prior probability estimation method is also proposed by using protein complex infor-mation, together with a validation method and evaluation criteria. The numerical experiments show that the pro-posed algorithm not only achieves high AUC score, but also runs very fast even in the multiple data integration case. It outperforms many existing algorithms for identi-fying human disease genes.
Methods and materials Problem formulation
Let Hbe a bipartite graph consisting of two disjoint sets of vertices, where one set represents all known human genes {g1, g2, . . . , gN}, while the other set represents all
known genetic diseases{d1, d2, . . . , dr}. The
associa-tions between those genes and genetic diseases can be obtained from either the Online Mendelian Inheritance in Man (OMIM) database [22] or similar databases.
Although a disease dkmay associate with one or
a set of given gene-disease associations, where gn+1,
gn+2, . . . , gn+mare genes associated with at lease one
known disease (disease genes), andg1, g2, . . . , gnare
others. Here N = n + m, and n is the number of all genes that are not known to associate with any dis-eases and they are called unknown genes in this paper.
For a specific disease dk, the issue of disease gene
identification is to find a set of candidate genes which may have associations with dk. To achieve this, let
xk=
xk1,xk2, ...,xkn+m
be a vector of binary class labels
(i.e. taking the value zero or one) defined on all genes, where xki = 1represents gene gibeing a disease gene of dk, andxki = 0otherwise. Since we have to address each
genetic disease one by one, we takedkfor example, and
ignore the superscriptkin the vectorxkfor simplicity as
x= (x1,x2, . . . ,xn+m), hereafter. Therefore, the
identifi-cation of disease genes is equivalent to find labels of xi
for all unknown genes. Identification of disease genes for other diseases can be similarly conducted by chan-gingdkto another disease.
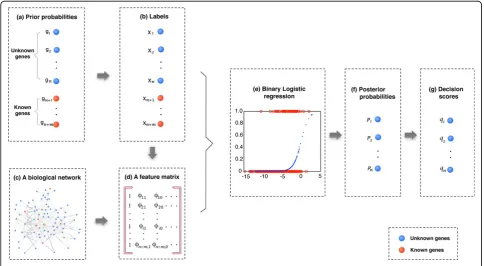
In this paper, the issue of disease gene identification is formulated as a two-class classification problem by using Bayesian analysis and logistic regression. The con-ditional probabilityp(xi= 1|F) for each unknown gene
is first calculated in an inference stage, and a decision score is then obtained according to this probability in a decision stage [23]. Here F represents the information used to make the inference, such as a vector of prior labels ofx, the connectivity of the bipartite graph H, the neighborhood relationships of g1, g2, . . . , gN , and
the similarity relationship between d1, d2, . . . , dr . The
flow diagram of the proposed algorithm is depicted in Figure 1.
Prior label estimation
The logistic regression based algorithm needs a vector of prior labels forx. For those known disease genes, one can directly assign 1 or 0 according to the known gene-disease associations. For those unknown gene-disease genes, a prior probability of each gene get the label 1 should be first estimated.
The simplest way is to assign the prior probability as 0 for all unknown genes. The prediction results in this case is denoted asP0hereafter.
However, one can make it better by using additional prior information, such as protein complex data, to esti-mate prior probabilities for unknown genes. This is not only due to the fact that they are naturally available from various databases, but also due to their capability
to describe the module characteristic of disease genes. If a disease is resulted from the disfunction of a protein complex, then any component of the complex should associate with the disease with a high probability.
Similar to the method used in [19,20], if a gene gi
encodes a protein in a complex, then let
pi=
A
B (1)
be its prior probability, whereAis the number of dis-ease genes of the specific disdis-ease in the complex, andB
is the number of all disease genes in the complex. Ifgi
appears in multiple protein complexes, we use the maxi-mum value as its prior probability. Ifgidoes not belong
to any protein complex, let
pi=
C
D (2)
be its prior probability, where Cis the number of all currently known disease genes of the specific disease, andDis the total number of genes in human genome.
Once a prior probabilitypiis estimated forgi, its prior
label ofxican be obtained as follows. First, generate a random number following the standard uniform distri-bution. If the value of the random number is large than pi, then assign 0 as the prior label for gi. Otherwise,
assign 1 as the prior label forgi. Repeat this step for all
unknown genes, one can obtain prior labels for all of them. The prediction results generated by using those prior labels is denoted asPchereafter.
Logistic regression
For a two-class classification problem, each gene is labelled with either 1 or 0. A vector of all binary values ofxis called aconfiguration. In the previous MRF algo-rithm [19,20], the configuration x is formulated as an MRF which follows a Gibbs distribution. However, the Markovianity characteristic of the MRF model makes it only considering direct neighbors to construct feature vectors, which limits the capability of the method to use other topological attributes in a biological network. It is also very time consuming to maintain Markov chains for all unknown genes. In [21], we have introduced a logistic regression based algorithm to directly estimate the configuration by using the same feature vectors. However, the application of the logistic regression based algorithm is still limited to single biological network. A multiple data integration method should be further investigated. To generalize the formulation of feature vectors by using other topological attributes and extend its applicability to multiple data integration, we propose an improved logistic regression based algorithm in this study as follows.
Let C1 be a set of genes with label 1 andC0 be a set of genes with label 0. Suppose the following four kinds of probabilities are given: the class-conditional densities
p(x|C1) andp(x|C0), which indicate the probability of the configurationx conditional on C1 and C0, respec-tively, and the class prior densities p(C1) and p(C0), which indicate the prior probability of genes inC1 and
C0being labelled with 1 and 0, respectively.
According to the Bayes’ rule, the posterior probabil-ities of those genes inC1that are labelled with 1 can be described as a logistic sigmoid function [23,24]
p(C1|x)=
p(x|C1)p(C1)
p(x|C1)p(C1)+p(x|C0)p(C0) = e
t
et+ 1 (3) and the posterior probabilities of those genes in C0 that are labelled with 0 can be similarly written as
p(C0|x)=
p(x|C0)p(C0)
p(x|C1)p(C1)+p(x|C0)p(C0)
= 1
et+ 1 (4) where the variabletis defined as
t= lnp(x|C1)p(C1)
p(x|C0)p(C0)
, (5)
which is related to the four kinds of probabilities. Although t is often unavailable for a real problem, under general assumptions [23],tcan be formulated as a function of different featurest=f (·) associated with the integrated networks. To be more specific, letx be a prior configuration of all human genes and fbe a func-tion. For any given gene gi, letji be the feature vector
of gi that is related to the prior configurationx. The
posterior probability that the specific genegihas label 1
and 0 are
pxi= 1|φi,f
= exp
f(φi)
expf(φi)
+ 1, (6)
and
pxi= 0|φi,f
= 1
expf(φi)
+ 1. (7)
respectively. Note that the sum of these two probabil-ities (6) and (7) must equal to 1 in this two-class classi-fication problem. A linear function f(ji) = wT jiwith
variables (feature vectors) ji and coefficients
(para-meters) w is the most commonly used function to ensure the calculation of the posterior probability not too complex.
the feature vector for each gene. Takegifor example, its
feature vector can be written as
φi=(1,φi1,φi0)T, (8)
where ji1 andji0are the number of direct neighbors of gi that connected to vertices with labels 1 and 0,
respectively. It is a three dimensional vector, where the first element represents the constant term. All feature vectors of individual genes together form a feature matrix as
F1=
⎡ ⎢ ⎢ ⎢ ⎣
1φ11 φ10 1φ21 φ20 ..
. ... ... 1φN1φN0
⎤ ⎥ ⎥ ⎥ ⎦
N×3
(9)
whereNis the number of all human genes. The corre-sponding parameters arew = (w0, w1, w2)T. Predictions
generated by using (9) are denoted asF1hereafter. In this study, two extended feature vector construction methods are proposed as follows. Firstly, in a single bio-logical network, not only the number of direct neighbors ofgi, but also the number of its second order neighbors
are employed to construct the feature vector as
φi=
1,φi1,φi0,φi1,φi0
T
(10)
whereji1andji0are the numbers of direct neighbors of gi connected to vertices with labels 1 and 0,
respec-tively, and φi1and φi0are the numbers of the second order neighbors ofgiconnected to vertices with labels 1
and 0, respectively. The contribution of those indirect neighbors has been investigated for predicting disease genes in [20,25,26]. The feature matrix in this situation can be written as
F2=
⎡ ⎢ ⎢ ⎢ ⎣
1φ11 φ10 φ11 φ10 1φ21 φ20 φ21 φ20 ..
. ... ... ... ... 1φN1φN0φN1φN0
⎤ ⎥ ⎥ ⎥ ⎦ N×5. (11)
The corresponding parameter vectorw = (w0, w1, w2,
w3, w4)Tis a five dimensional vector. Predictions gener-ated by using (11) are denoted asF2 hereafter.
Secondly, in the multiple data integration situation, suppose there arel biological networks. Let φij1,φij0 be the number of direct neighbors ofgiconnected to
ver-tices with labels 1 and 0 in thejth network, respectively. The feature vector obtained from thoselnetworks
φi=
1,φi11,φ1i0, ...,φil1,φil0T (12)
is a 2l + 1 dimensional vector. All those feature vectors together form a feature matrix as
F3=
⎡ ⎢ ⎢ ⎢ ⎣
1φ111 φ101 · · · φ11l φl10 1φ1
21 φ201 · · · φ21l φl20 ..
. ... ... · · · ... ... 1φ1
N1φN10· · · φNl1φlN0
⎤ ⎥ ⎥ ⎥ ⎦
N×(2l+1).
(13)
The corresponding parameter vectorw= (w0, w1, w2,. . . ,
w2l−1, w2l)Tis a 2l+ 1 dimensional vector, andNis the
number of all human genes. Predictions generated from (13) by integrating multiple networks is denoted asF3 hereafter.
Parameter estimation
Parameter estimation can be conducted on a training set consists of known disease genes, where known genes associated with dkare labelled with 1 and known genes
associated with other diseases are labelled with 0. How-ever, as we discussed in [19,21], the exclusion of most unknown genes reduces the number of vertices with label 0 significantly, thereby making the estimation of parameters inaccurate. Predictions from those inaccurate parameters are unreliable in disease gene identification.
It is noteworthy that the majority of human genes should not be disease genes associated withdk. Hence,
the inclusion of all unknown genes with prior labels as the training set will make the training set more reason-able, where the number of vertices with label 0 is signifi-cantly increased, while the number of vertices with label 1 does not change too much. Such a training set, which consists of both known genes and unknown genes, has proved its powerful and efficient to estimate meaningful parameters in [19-21].
Given a prior configuration xˆ for all vertices, a maxi-mum-likelihood estimation (MLE) method can be employed to estimate the parameter vectorw. The likeli-hood function can be written as
L(w;x1,x2, ...,xN)= N
i=1
pxi|φi,f
. (14)
wherexiis the label ofgi,jiis its feature vector that is
calculated according toxˆ,fis a linear function of jiwith
the form asf (ji) = wT ji, and N is the number of all
human genes. The log likelihood of (14) is ln L (w;x1, x2, . . . , xN)
=
N
i=1
xiwTφi−ln(1 + exp(wTφi))
. (15)
by solving a convex optimization problem. In this study, the standard MATLAB functionfminunc() is employed to find a numerical solution of (15) (by calculating the minimum of −ln L (w;x1, x2, . . . , xN)). The the initial
value of w is simply set as zero for the fminunc() function.
Decision score and evaluation methods
The logistic regression based algorithm returns a set of posterior probabilities during the inference stage. One can directly use those probabilities to make decisions in the following decision stage. However, the posterior probabilities do not always work well due to the hard-ness to set a threshold for a genetic disease. Inspired by the DIR method [18], we propose to use a percentage value of a posterior probability as the decision score for each gene. The decision score is calculated as follows
qi=
|j|pi≥pj
|
n ,i= 1, 2, ...,n (16)
where{p1, p2, . . . , pn}is the posterior probabilities of
individual unknown genes, andqi is the top percentage
value of pi among all those posterior probabilities. A
candidate gene is more likely to be associated withdk, if
its decision score is larger than majority of others. To evaluate the performance of the proposed algo-rithm, the leave-one-out cross validation paradigm is employed by using above decision scores. The receiver operating characteristic (ROC) curve is employed as one of the evaluation criteria, which shows the relationship between the true positive rate (TPR) and the false posi-tive rate (FPR) by varying a threshold for determining positives. The area under the ROC curve (AUC) is employed to show the overall performance of algorithms.
The positive control genes are those known disease genes associated with dk. For those negative control
genes, although they are indispensable to calculate false positives and true negatives, it is generally hard to obtain a true negative dataset [28]. In this study, the negative control genes are randomly selected from known disease genes that do not associate withdk. Since
those genes have been widely studied as disease genes for other genetic diseases, it is less likely for them to be disease genes for a different specific disease. If there are
sknown disease genes associated withdk, we randomly
select s
2
such genes as a negative control set. Each
gene belonging to the negative control set is also vali-dated by using the leave-one-out cross validation paradigm.
The proposed algorithm is compared with four pre-vious algorithms: (1) the initial logistic regression based algorithm proposed in [21]; (2) the RWR algorithm pro-posed in [17]; (3) the MRF algorithm propro-posed in [19];
and (4) the DIR algorithm proposed in [18]. The first algorithm is applicable to a single network. The second and the third algorithms are applicable to both single network and multiple data integration. The fourth algo-rithm works only for multiple data integration. All those algorithms identify disease genes with high prediction performance and they work better than many previous methods [17-19,21].
Algorithm
The step-by-step description of the proposed logistic regression based algorithm is given as follows.
Input:The vector of all human genes (g1, . . . ,gn+m),
where (g1, . . . , gn) are unknown genes, and (gn+1, . . . ,
gn+m) are known genes;l integrated biological networks G1, G2, . . . , Gl; a set of protein complexes; and a set of
gene-disease associations.
Output: The vector of decision score for each unknown gene for each disease.
1: For a specific diseasedk, calculate prior
probabil-ities for all human genes, where the prior probability of unknown genespˆ1, ...,pˆnare calculated according to (1) and (2).
2: For each known genegn+i,i = 1, . . . , m, ifgn+iis
known to be associated withdk , letpˆn+i= 1. Other-wise, letpˆn+i= 0.
3: Assign prior labelsxˆ=xˆ1,xˆ2, ...,xˆn,xˆn+1, ...,xˆn+m
for all genes according to the prior probabilities ˆ
p1, ...,pˆn+m
,respectively.
4: Calculate the feature vectorjifor eachgi
accord-ing to the integrated biological networks andxˆ. 5: Estimate parameters wˆ by maximizing the log likelihood ln L(w;x1,x2, ...,xN) in (15) based onxˆ andji, i = 1, . . . , n+m. A binary logistic
regres-sion is performed here by taking the vectorxˆ as the categorical dependent variables and those label-related feature vectors ji as predictor variables.
Herei= 1, . . . , N.
6: Calculate the posterior probabilityp1, . . . , pnfor
each unknown gene according to (6) by usingwˆ and ji.
7: Calculate the decision scoresq1, . . . , qnaccording
to (16).
8: Repeat all the steps for another disease until every disease is checked.
Results and discussion Data sources
(OMIM) [22]. Since a disease generally only associates with a few disease genes, it is hard to perform a logistic regression based on such small amount of positive sam-ples. Hence, merging similar diseases into a disease class, and identifying disease genes associated with the disease class can circumvent this problem to some extent. Goh et al. [1] manually classify all diseases in OMIM into 22 primary disease classes. The dataset con-tains 1284 genetic diseases and 1777 disease genes. In this study, we use twelve disease classes that consist of 815 genes to test the performance of the proposed algorithm.
The PPI dataset is derived from the database of HPRD (Release 9) [29]. Duplicated edges between the same pair of vertices and self-loop edges are deleted. The final PPI network consists of 9465 vertices and 37039 edges. Two another PPI datasets are derived from the database of BioGrid (Release 3.2.108) [30] and the database of IntAct (downloaded on Jan 26, 2014) [31], respectively, which are used to select edges of biological networks.
The pathway datasets are obtained from the database of KEGG [32], Reactome [33], PharmGKB [34], and PIN [35]. There are 280, 1469, 99 and 2679 pathways in those datasets, respectively. The total number of pro-teins/genes consisting of those pathways is 8614. A pathway co-existing network is constructed by taking individual proteins/genes as vertices. Edges are con-structed between two vertices, if they co-exist in any pathway.
The human gene expression profiles are obtained from BioGPS (GSE1133) [36,37], which contains 79 human tissues in duplicates, measured using the Affymetrix U133A array. Pairwise Pearson correlation coefficients (PCC) are calculated. A pair of genes are linked by an edge if the PCC value is large than 0.5, similar to the method used in [1,18] to construct the gene co-expres-sion network.
The human protein complexes are collected from the database of CORUM [38] and PCDq [39]. There are 1677 and 1103 protein complexes in datasets with at least two proteins, respectively. There are in total 3881 proteins in those protein complexes.
In summary, three kinds of biological networks are constructed and all protein (or gene) IDs are mapped onto the form of gene symbol. In order to test the per-formance of multiple data integration of our method, we selected those vertices that appear at least four times in all five biological networks (three PPI networks, a pathway co-existing network and a gene co-expression network). The final datasets consist of 7311 human genes, 815 out of which are known associated with 12 disease classes. The details of those datasets used in this study can be found in the “Availability of supporting data”section.
Comparisons between different priors
If there is no prior information available for the applica-tion of the proposed algorithm, zero priorP0 still works in most situations. However, if there is general prior information available in practice (such as the protein complex information), the proposed algorithm should work better than that usingP0.
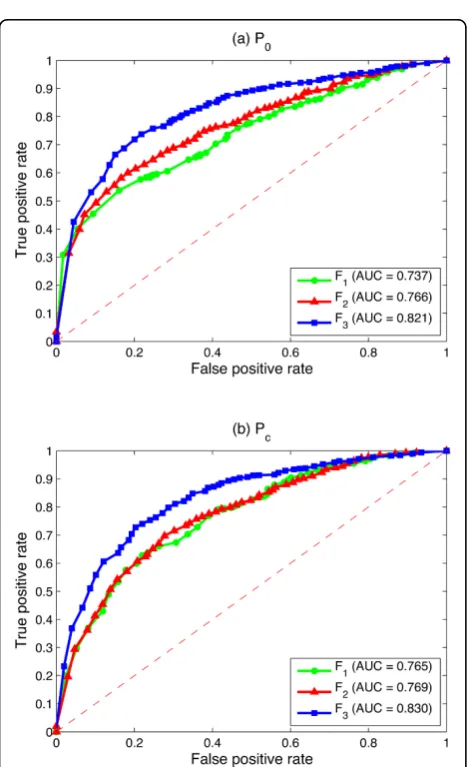
Figure 2 compares the logistic regression based algo-rithm by using either the zero prior P0 or the protein complex prior Pc. We can see from Figure 2 that Pc
always works better than P0 in all three kinds of feature vectors in terms of the AUC score. The highest improvement is achieved when F1 is employed, where the AUC score increases from 0.737 to 0.765. There is only slight improvement whenF3 is employed in multi-ple data integration, where the AUC score increases from 0.821 to 0.830. This may due to the fact that F1 usingP0 achieves the lowest prediction AUC score for identifying disease genes. It has the highest potential to be improved. While F3 using P0 in the multiple data integration already achieves a very high AUC score. There is only a little room for it to be further improved by using additional prior information.
Although the improvement of the protein complex information is not so significant for F2 and F3, the increased AUC score still indicates that additional knowl-edge is helpful for improving the prediction performance. This characteristic makes the proposed algorithm very promising, since it is flexible in terms of the usage of dif-ferent prior information. Any prior knowledge related to gene-disease associations can be employed to estimate the prior labels.
Comparisons between different feature vectors
Figure 3 compares the logistic regression based algo-rithm by using different feature vectors. F1 andF2 are tested on the single HPRD PPI network, andF3is tested by integrating the following three biological networks: (1) the HPRD PPI network, (2) the pathway co-existing network and (3) the gene co-expression network. They are the same experimental results as Figure 2 shows, but from a different point of view.
We can see from Figure 3 that F3 achieves the highest AUC score in both P0 and Pc, whileF1 always obtains the lowest AUC score. In the zero prior situationP0,F1 reaches the AUC score at only 0.737, F2 on the same single PPI network reaches that at 0.766, while F3 by integrating three networks achieves the AUC score at 0.821. In the protein complex prior situation Pc, the
AUC score ofF1 is 0.765. It increases to 0.769 by using
Comparing with previous algorithms
To test the efficiency of the proposed algorithm, four previous algorithms are employed as comparison in either single network or multiple data integration. The initial logistic regression works only in single network, while the DIR algorithm works only in multiple data integration.
The comparison is first conducted in terms of the computational time. All those tests are conducted on a Windows 7 professional computer (Inter(R) Core(TM) i7 CPU, 3.07 GHz, 8.0 GB RAM, 64-bit OS). The MATLAB version is 7.10.0.499 (R2010a), 64-bit (win 64). Each algo-rithm is evaluated by using the leave-one-out cross vali-dation paradigm, where each known gene is left out once. The probabilities of all unknown genes (include the left out one) are calculated by using each algorithm. All algorithms are conducted on the same datasets and the same computational conditions. Figure 4 illustrates the average computational time for each leave-one-out experiment among different algorithms.
We can see from Figure 4 that the MRF algorithm is the slowest algorithm. A leave-one-out experiment spends around 95.72 seconds for the single network, and it increases to about 273.77 seconds when three biological networks are integrated. The initial logistic regression based algorithm F1 runs very fast. It only spends approximately 0.54 seconds in the single net-work. The improved logistic regression based algorithms
F2 and F3 also runs very fast. It only takes around 1.5 seconds whenF2is used, and it increases to about 12.54 seconds when three biological networks are integrated by usingF3, which is almost the same as the DIR algo-rithm (11.52 seconds). The RWR algoalgo-rithm also runs very fast, and it does not vary too much in both situa-tions. It is due to the fact that the RWR algorithm uses
Figure 2Comparisons between different priors of the logistic regression based algorithm by using three kinds of feature vectors. (a) The ROC curve of the proposed algorithm by usingF1on the single HPRD PPI network. (b) The ROC curve of the proposed algorithm by usingF2on the single HPRD PPI network. (c) The ROC curve of the proposed algorithm by usingF3by integrating three biological networks: the HPRD PPI network, the pathway co-existing network and the gene co-expression network. AUC values are listed in parentheses.
the mixed network as input. No matter how many net-works are integrated, it combines them together as a single mixed network. Hence, the number of integrated networks does not affect the computational time significantly.
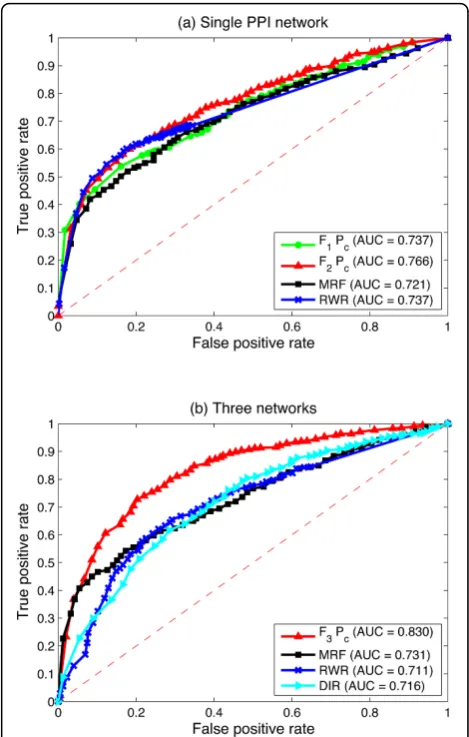
The comparison is then conducted in terms of the AUC scores. When only the single HPRD PPI network is employed, as illustrated in Figure 5(a), the proposed logistic regression based algorithm usingF2works better than all of the previous single network based algorithms. The AUC score is 0.766, which achieves 2.9%, 4.5% and 2.9% improvements compared with the initial logistic regression based algorithm usingF1, the MRF algorithm and the RWR algorithm, respectively. When three biolo-gical networks are employed, as illustrated in Figure 5(b), the proposed logistic regression based algorithm usingF3 achieves the highest AUC score among all these multiple data integration algorithms. The AUC score is 0.830 when protein complex priorPcis used, which is 9.9%,
11.9% and 11.4% improvements compared with the MRF algorithm, the RWR algorithm and the DIR algorithm under the same situation, respectively.
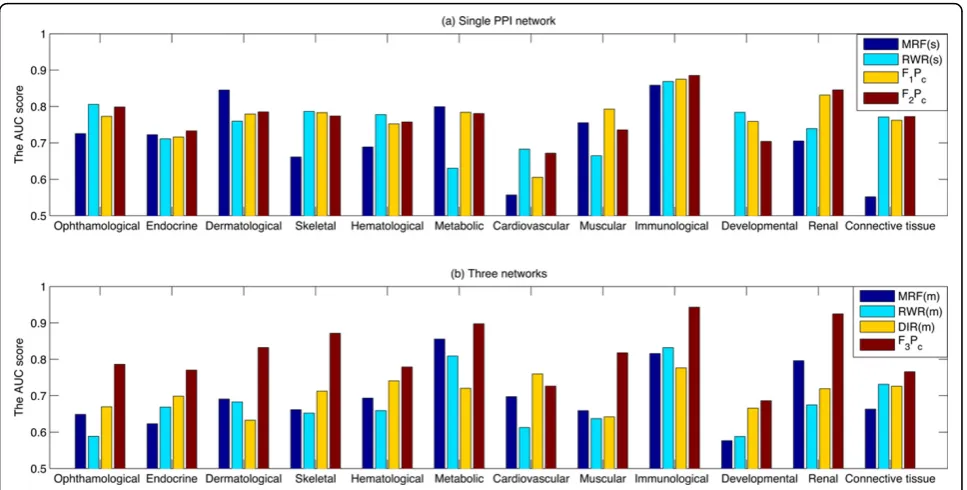
The comparison is finally conducted in terms of the AUC scores for each of the 12 disease classes. It can be seen from the Figure 6(a) that the proposed logistic regression based algorithm (F2Pc) is the most stable
algo-rithm in the single network. Its AUC score is larger than the other three algorithms in many cases. When three biological networks are integrated, the proposed logistic regression based algorithm (F3Pc) achieves the highest
AUC score in all cases, which makes the algorithm very promising in terms of multiple data integration.
Conclusions
In this paper, we have proposed an improved logistic regression based algorithm to identify disease genes by using either a single network or multiple networks. A Bayesian analysis method is first used to formulated the disease gene identification issue as a two-class classifica-tion problem. A binary logistic regression model is then employed to calculate the posterior probability of each unknown gene obtained the label 1. Parameters of the model are estimated based on the whole gene set, and the final decision scores are obtained by using the percentage values of individual posterior probabilities.
Figure 4 Comparison of the computational time among different algorithms. The grey bars illustrate the average time of different algorithms that work on the single HPRD PPI network. From left to right, they are the average computational time of the MRF algorithm, the RWR algorithm, the initial proposed algorithm by using theF1Pcand the proposed logistic regression based algorithm by usingF2Pc, respectively. The blue bars illustrate the average time of different algorithms by integrating three biological networks. From left to right, they are the average computational time of the MRF algorithm, the RWR algorithm, the proposed logistic regression based algorithm by using theF3Pcand the DIR algorithm, respectively. The number above each bar gives the average time (by second) for each leave-one-out experiment.
Compared with previous algorithms, the proposed logistic regression based algorithm not only runs fast, but also generates predictions with high AUC scores. It only takes around 1.50 seconds in the single PPI network, and the AUC score is larger than all of the three single net-work based competing algorithms. Although the running time for the multiple networks is a little longer than the RWR algorithm and the DIR algorithm, it is still compar-able, and the AUC score of the proposed algorithm is much better than those two algorithms. Compared with the MRF algorithm, the computational time has been sig-nificantly reduced, while the predictive performance becomes much better in terms of the AUC score. The best AUC score of the proposed algorithm is 0.766 in the single network, and it increases to 0.830 if three net-works are integrated. The high prediction performance and the short computation time make the proposed algo-rithm very promising for identifying human disease genes.
Availability of supporting data
The Matlab code of the proposed algorithm with data can be found inhttps://www.dropbox.com/s/bs0ekmu718u4 sea/Package15.zip
List of abbreviations
AUC, area under the ROC curve; CGI, combining gene expression and protein interaction; DIR, data integration rank; FPR, false positive rate; MRF, Markov random field; OMIM, online Mendelian inheritance in man; PCC,
Pearson correlation coefficient; PPI, protein-protein interaction; ROC, receiver operating characteristic; RWR, random walk with restart; TPR, true positive rate.
Competing interests
The authors declare that they have no competing interests.
Authors’contributions
FXW initiated this study, FXW and BC designed algorithms and experiments. BC performed the experiments, analyzed the results, and drafted the manuscript. FXW, ML, JW and XS revised the manuscript. All authors have read and approved the final manuscript.
Declarations
The publication costs for this article were supported by the Natural Sciences and Engineering Research Council of Canada (NSERC), the National Natural Science Foundation of China (Grant No. 61332014 and 61370024), and the fundamental research program of the Northwestern Polytechnical University (Grant No. G2015KY0104 and G2015KY0302).
This article has been published as part of BMCMedical GenomicsVolume 8 Supplement 3, 2015: Selected articles from the IEE International Conference on Bioinformatics and Biomedicine (BIBM 2014): Medical Genomics. The full contents of the supplement are available online at http://www.
biomedcentral.com/bmcmedgenomics/supplements/8/S3.
Authors’details
1School of Computer Science, Northwestern Polytechnical University, 127 Youyi West Road, 710072, Xi’an, P.R. China.2School of Information Science and Engineering, Central South University, 410083, Changsha, P.R.China. 3Division of Biomedical Engineering, University of Saskatchewan, 57 Campus Dr., S7N 5A9, Saskatoon, Canada.4Department of Mechanical Engineering, University of Saskatchewan, 57 Campus Dr., S7N 5A9, Saskatoon, Canada.
Published: 23 September 2015
References
2. Oti M, Brunner HG:The modular nature of genetic diseases.Clin Genet
2007,71(1):1-11.
3. Snel B, Bork P, Huynen MA:The identification of functional modules from the genomic association of genes.Proc Natl Acad Sci USA2002,
99(9):5890-5895.
4. Barabási AL, Oltvai ZN:Network biology: understanding the cell’s functional organization.Nat Rev Genet2004,5(2):101-113. 5. Chen B, Fan W, Liu J, Wu FX:Identifying protein complexes and
functional modules from static PPI networks to dynamic PPI networks.
Brief Bioinform2014,15(2):177-194.
6. Oti M, Snel B, Huynen MA, Brunner HG:Predicting disease genes using protein-protein interactions.J Med Genet2006,43(8):691-698.
7. Wu X, Jiang R, Zhang MQ, Li S:Network-based global inference of human disease genes.Mol Syst Biol2008,4:189.
8. Fraser HB, Plotkin JB:Using protein complexes to predict phenotypic effects of gene mutation.Genome Biol2007,8(11):R252.
9. Li Y, Agarwal P:A Pathway-Based View of Human Diseases and Disease Relationships.PLoS One2009,4(2):e4346.
10. Ma X, Lee H, Wang L, Sun F:CGI: a new approach for prioritizing genes by combining gene expression and protein-protein interaction data.
Bioinformatics2007,23(2):215-221.
11. Ganegoda G, Wang J, Wu FX, Li M:Prediction of disease genes using tissue-specified gene-gene network.BMC Syst Biol2014,8(Suppl 3):S3. 12. Li M, Zhang J, Liu Q, Wang J, Wu FX:Prediction of disease-related genes
based on weighted tissue-specific networks by using DNA methylation.
BMC Med Genomics2014,7(Suppl 2):S4.
13. Li M, Li Q, Ganegoda G, Wang J, Wu FX, Pan Y:Prioritization of orphan disease-causing genes using topological feature and GO similarity between proteins in interaction networks.Sci China Life Sci2014,
57(11):1064-1071.
14. Lage K, Karlberg EO, Størling ZM, Olason PI, Pedersen AG, Rigina O,et al:A human phenome-interactome network of protein complexes implicated in genetic disorders.Nat Biotechnol2007,25(3):309-316.
15. Vanunu O, Magger O, Ruppin E, Shlomi T, Sharan R:Associating genes and protein complexes with disease via network propagation.PLoS Comput Biol2010,6(1):e1000641.
16. Zhang W, Sun F, Jiang R:Integrating multiple protein-protein interaction networks to prioritize disease genes: a Bayesian regression approach.
BMC Bioinformatics2011,12(Suppl 1):S11.
17. Köhler S, Bauer S, Horn D, Robinson PN:Walking the interactome for prioritization of candidate disease genes.Am J Hum Genet2008,
82(4):949-958.
18. Chen Y, Wang W, Zhou Y, Shields R, Chanda SK, Elston RC,et al:In silico gene prioritization by integrating multiple data sources.PLoS One2011,
6(6):e21137.
19. Chen B, Wang J, Li M, Wu FX:Identifying disease genes by integrating multiple data sources.BMC Medical Genomics2014,7(Suppl 2):S2. 20. Chen B, Li M, Wang J, Wu FX:Disease gene identification by using graph
kernels and Markov random fields.Sci China Life Sci2014,
57(11):1054-1063.
21. Chen B, Li M, Wang J, Wu FX:A logistic regression based algorithm for identifying human disease genes.In2014 IEEE International Conference on
Bioinformatics and Biomedicine (BIBM). Volume 2014.Belfast. IEEE;
2014:197-200, 2-5 Nov..
22. McKsick VA:Mendelian Inheritance in Man and its online version, OMIM.
Am J Hum Genet2007,80(4):588-604.
23. Bishop CM:Pattern Recognition and Machine Learning.Singapore: Springer; 2006.
24. Shi J, Chen B, Wu FX:Unifying protein inference and peptide identification with feedback to update consistency between peptides.
Proteomics2013,13(2):239-247.
25. Lee H, Tu Z, Deng M, Sun F, Chen T:Diffusion kernel based logistic regression models for protein function prediction.OMICS2006,
10(1):40-55.
26. Li SZ:Markov Random Field Modeling in Image Analysis.London: Springer; 2009.
27. Boyd SP, Vandenberghe L:Convex optimization.New York: Cambridge University Press; 2004.
28. Mackay JP, Sunde M, Lowry JA, Crossley M, Matthews JM:Response to Chatr-aryamontri et al.: Protein interactions: to believe or not to believe?
Trends Biochem Sci2008,33(6):242-243.
29. Keshava Prasad TS, Goel R, Kandasamy K, Keerthikumar S, Kumar S, Mathivanan S,et al:Human Protein Reference Database - 2009 update.
Nucleic Acids Res2009,37(Database):D767-D772.
30. Stark C, Breitkreutz BJ, Reguly T, Boucher L, Breitkreutz A, Tyers M:BioGRID: a general repository for interaction datasets.Nucleic Acids Res2006,
34(Database):D535-539.
31. Kerrien S, Alam-Faruque Y, Aranda B, Bancarz I, Bridge A, Derow C,et al:
IntAct - open source resource for molecular interaction data.Nucleic
Acids Res2007,35(Database):D561-D565.
32. Kanehisa M, Goto S:KEGG: Kyoto Encyclopedia of Genes and Genomes.
Nucleic Acids Res2000,28(1):27-30.
33. Vastrik I, D’Eustachio P, Schmidt E, Gopinath G, Croft D, de Bono B,et al:
Reactome: a knowledge base of biologic pathways and processes.
Genome Biol2007,8(3):R39.
34. Whirl-Carrillo M, McDonagh EM, Hebert JM, Gong L, Sangkuhl K, Thorn CF,
et al:Pharmacogenomics knowledge for personalized medicine.Clin
Pharmacol Ther2012,92(4):414-417.
35. Schaefer CF, Anthony K, Krupa S, Buchoff J, Day M, Hannay T,et al:PID: the Pathway Interaction Database.Nucleic Acids Res2009,37(Database): D674-D679.
36. Wu C, Orozco C, Boyer J, Leglise M, Goodale J, Batalov S,et al:BioGPS: an extensible and customizable portal for querying and organizing gene annotation resources.Genome Biol2009,10(11):R130.
37. Su AI, Wiltshire T, Batalov S, Lapp H, Ching KA, Block D,et al:A gene atlas of the mouse and human protein-encoding transcriptomes.Proc Natl
Acad Sci USA2004,101(16):6062-6067.
38. Ruepp A, Waegele B, Lechner M, Brauner B, Dunger-Kaltenbach I, Fobo G,
et al:CORUM: the comprehensive resource of mammalian protein
complexes - 2009.Nucleic Acids Res2010,38(Database):D497-D501. 39. Kikugawa S, Nishikata K, Murakami K, Sato Y, Suzuki M, Altaf-Ul-Amin M,
et al:PCDq: human protein complex database with quality index which
summarizes different levels of evidences of protein complexes predicted from h-invitational protein-protein interactions integrative dataset.BMC
Syst Biol2012,6(Suppl 2):S7.
doi:10.1186/1755-8794-8-S3-S2
Cite this article as:Chenet al.:A fast and high performance multiple
data integration algorithm for identifying human disease genes.BMC Medical Genomics20158(Suppl 3):S2.
Submit your next manuscript to BioMed Central and take full advantage of:
• Convenient online submission
• Thorough peer review
• No space constraints or color figure charges
• Immediate publication on acceptance
• Inclusion in PubMed, CAS, Scopus and Google Scholar
• Research which is freely available for redistribution