www.geosci-model-dev.net/9/3671/2016/ doi:10.5194/gmd-9-3671-2016
© Author(s) 2016. CC Attribution 3.0 License.
Computationally efficient air quality forecasting tool:
implementation of STOPS v1.5 model into CMAQ
v5.0.2 for a prediction of Asian dust
Wonbae Jeon1, Yunsoo Choi1, Peter Percell1, Amir Hossein Souri1, Chang-Keun Song2, Soon-Tae Kim3, and Jhoon Kim4
1Department of Earth and Atmospheric Sciences, University of Houston, 312 Science & Research Building 1,
Houston, TX 77204, USA
2National Institute of Environmental Research, Incheon, Republic of Korea
3Division of Environmental Engineering, Ajou University, Suwon, Republic of Korea 4Department of Atmosphere Sciences, Yonsei University, Seoul, Republic of Korea
Correspondence to:Yunsoo Choi ([email protected])
Received: 10 July 2016 – Published in Geosci. Model Dev. Discuss.: 21 July 2016
Revised: 20 September 2016 – Accepted: 26 September 2016 – Published: 17 October 2016
Abstract. This study suggests a new modeling framework using a hybrid Eulerian–Lagrangian-based modeling tool (the Screening Trajectory Ozone Prediction System, STOPS) for a prediction of an Asian dust event in Korea. The new version of STOPS (v1.5) has been implemented into the Community Multi-scale Air Quality (CMAQ) model ver-sion 5.0.2. The STOPS modeling system is a moving nest (Lagrangian approach) between the source and the receptor inside the host Eulerian CMAQ model. The proposed model generates simulation results that are relatively consistent with those of CMAQ but within a comparatively shorter computa-tional time period. We find that standard CMAQ generally underestimates PM10 concentrations during the simulation
period (February 2015) and fails to capture PM10peaks
dur-ing Asian dust events (22–24 February 2015). The underes-timation in PM10 concentration is very likely due to
miss-ing dust emissions in CMAQ rather than incorrectly sim-ulated meteorology, as the model meteorology agrees well with the observations. To improve the underestimated PM10
results from CMAQ, we used the STOPS model with con-strained PM concentrations based on aerosol optical depth (AOD) data from the Geostationary Ocean Color Imager (GOCI), reflecting real-time initial and boundary conditions of dust particles near the Korean Peninsula. The simulated PM10 from the STOPS simulations were improved
signifi-cantly and closely matched the surface observations. With
additional verification of the capabilities of the methodol-ogy on emission estimations and more STOPS simulations for various time periods, the STOPS model could prove to be a useful tool not just for the predictions of Asian dust but also for other unexpected events such as wildfires and oil spills.
1 Introduction
A number of modeling studies have shown the important role of meteorology in PM (Pai et al., 2000; Otte, 2008a, b), and some have suggested a variety of optimization tech-niques for enhancing the accuracy of meteorology (Ngan et al., 2012; S.-H. Lee et al., 2011; Choi et al., 2012; Jeon et al., 2014, 2015; Li et al., 2016). Additionally, accurate and up-dated emission inventories are essential to more accurate PM forecasting. Several studies have used anthropogenic emis-sions inventories for the Asia domain, such as the Interna-tional Chemical Transport Experiment – Phase B (INTEX-B) emissions inventory in 2006 and a mosaic Asian an-thropogenic emissions inventory in 2010 (MIX) for reliable model performance (Zhang et al., 2009; Zhao et al., 2012; Li et al., 2015). However, the use of the optimized meteorol-ogy and the most recent emissions inventory as input data for PM simulations can provide accurate forecasting results for only “normal” time periods, not “upset” events such as Asian dust. This problem is further exacerbated because of the high uncertainty in dust emissions.
To address this issue, the intent of this study is to intro-duce a modeling tool for PM simulation that can be used in conjunction with the Community Multi-scale Air Quality (CMAQ) model (Byun and Schere, 2006) to more accurately predict PM concentrations, using an Asian dust storm event as a case study. We apply a hybrid Eulerian–Lagrangian model, the Screening Trajectory Ozone Prediction System (STOPS), to simulate PM in the east Asia region. The model setup includes a moving nest domain between the source and the receptor inside the host CMAQ structure. STOPS pro-vides simulation results similar to those of CMAQ, but does it so much faster than the full CMAQ modeling system. Ad-ditional details of the original version of STOPS (v1.0) and its effectiveness for regional air quality simulations are ex-plained by Czader et al. (2015). However, since STOPS v1.0 was based on CMAQ v4.4, it is incompatible for recent PM simulations due to outdated modules and chemical mecha-nisms. Hence, we have implemented a new version of STOPS (v1.5) into CMAQ v5.0.2, which can be utilized with recent emissions inventories, improved chemical mechanisms and useful analyzing tools for the better simulation of Asian dust events.
The primary purpose of this study is to characterize under-estimated PM concentrations by standard CMAQ and to de-termine the primary reason why CMAQ does not accurately
observations to investigate whether the constrained PM con-centrations produce accurate PM simulations. We ultimately conclude by proposing the STOPS forecasting/modeling sys-tem as an effective tool for capturing severe dust events over east Asia, particularly in Korea.
2 Methodology 2.1 STOPS
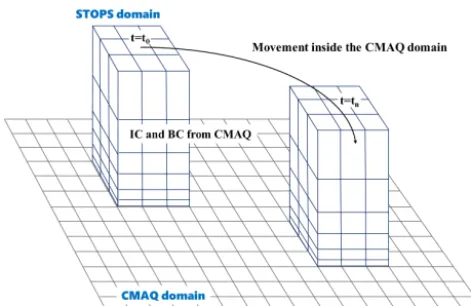
Figure 1. Conceptual diagram showing the basic structure and movement of the STOPS domain inside the CMAQ domain.
¯
u= 1
PBLH
P
L=1
1σF(L)
PBLH
X
L=1
uL·1σF(L) (1)
¯
v= 1
PBLH
P
L=1
1σF(L)
PBLH
X
L=1
vL·1σF(L), (2)
whereσF=1−σandσ is the scaled air pressure in a sigma
coordinate system (dimensionless) defined as
σ = (p−pt) (ps−pt)
, (3)
wherep,pt, andps denote air pressure at the current level
and the top and surface levels of the model, respectively. Czader et al. (2015) present more details on the model and its applications. The first version of STOPS (v1.0) was based on CMAQ v4.4 (Czader et al., 2015), but in this study, it has been updated to v1.5, and implemented in CMAQ v5.0.2. 2.2 Modeling system
In this study, we configured the CMAQ (v5.0.2) model do-main with a grid resolution of 27 km (174×128) cover-ing the northeastern part of Asia (Fig. 2) and 27 vertical layers extending from the surface to 100 hPa. This CMAQ domain, which is slightly larger than standard domain for east Asia study suggested by the Clean Air Policy Model-ing System (CAPMOS) (http://capmos.nier.go.kr/guideline/ guide_line.pdf) of the National Institute of Environmental Research (NIER) in Korea, covers more areas of the Gobi Desert, which is a major source of Asian dust.
Anthropogenic emissions for the CMAQ domain were ob-tained from the MIX emission inventory in 2010 (Li et al., 2015). This inventory contains gridded (0.25◦×0.25◦) emis-sion information for black carbon (BC), carbon monoxide
(CO), carbon dioxide (CO2), nitrogen oxides (NOx),
ammo-nia (NH3), organic carbon (OC), fine and coarse particulate
matter (PM2.5 and PM10), sulfur dioxide (SO2), and
non-methane volatile organic compounds (NMVOCs). To acquire high-resolution (1 km×1 km) anthropogenic emissions in Korea, this study also used the Clean Air Policy Support System (CAPSS) emissions inventory in 2011 from NIER (D. G. Lee et al., 2011). The CAPSS inventory contains area, line, and point sources of CO, NH3, NOx, sulfur oxides
(SOx), total suspended particles (TSPs), PM10, and VOCs.
The emissions for the CMAQ simulations were prepared by the Sparse Matrix Operator Kernel Emissions (SMOKE) model (Houyoux et al., 2000). The carbon bond chemical mechanism (CB05) (Yarwood et al., 2005) and the AERO6 aerosol module (Nolte et al., 2015) were used for gas-phase and aerosol chemical mechanisms, respectively. The initial and boundary conditions were obtained from the standard CMAQ profile.
We simulated meteorological fields using the Weather Re-search and Forecast (WRF, v3.7) model (Skamarock et al., 2008) and used the 1◦×1◦ Final Operational Global Anal-ysis (FNL) data of the National Centers for Environmental Prediction (NCEP) to determine the initial and boundary con-ditions. To improve the accuracy of meteorological fields, we adopted the optimized grid analysis nudging options sug-gested by Jeon et al. (2015) for the east Asia simulations.
The WRF-CMAQ simulations were conducted for the pe-riod of 21 January to 28 February in 2015, which included the first 10 days for spin-up. Evaluations applied to the month of February and the 3-day Asian dust event which occurred dur-ing 22–24 February 2015 (Table 1). Durdur-ing the event days, massive plumes of dust over the Gobi Desert and Mongo-lia region were transported to the Korean Peninsula. This happened due to the southeastward wind resulting from high pressure over the Mongolia region and low pressure over the northeastern part of China (Fig. S1 in the Supplement). The detailed options used for WRF and CMAQ simulations are listed in Tables S1 and S2 in the Supplement.
The configuration of the CMAQ subdomain for the STOPS simulation consists of 61×61 horizontal grid cells that cover a portion of the Korean Peninsula and the Yellow Sea. The initial position was near the northern part of the Yellow Sea (40◦N, 121◦E) (Fig. 2), which was the primary trans-port pathway of Asian dust. The simulated PM10
Figure 2.Domains for the WRF, CMAQ, and STOPS modeling. The right panel shows the location of the air quality monitoring stations (AQMS) and automatic weather system (AWS) sites used in this study.
Table 1. Observed PM10 and PM2.5 concentrations (µg m−3)
recorded on each day of an Asian dust event in February 2015. The values are averaged of the 20 AQMS sites shown in Fig. 2. D_Max denotes daily maximum concentrations and D_Mean daily mean concentrations.
PM10 PM2.5
D_Max D_Mean D_Max D_Mean
22 Feb 345.47 111.52 28.75 18.85 23 Feb 472.47 341.63 72.67 43.61 24 Feb 175.88 111.86 37.78 23.46
2.3 In situ and satellite measurements
This study used surface observational data from the Air Qual-ity Monitoring Station (AQMS) network operated by NIER. The network measures real-time air pollutant concentrations and provides hourly concentrations for CO, NO2, O3, PM2.5,
PM10, and SO2. We gathered the measured PM2.5and PM10
data in 2015 from the AQMS network, and the meteorolog-ical data were obtained from the Automatic Weather Sys-tem (AWS) network operated by the Korea Meteorological Administration (KMA). The following statistical parameters were used for the evaluation of the performance of WRF and CMAQ simulations: index of agreement (IOA), mean bias er-ror (MBE), and root mean square erer-ror (RMSE). These are
defined as
IOA=1−
PN
i=1(Pi−Oi)2
PN
i=1
Pi− ¯O
+
Oi− ¯O
2
MBE=
N
P
i=1
(Pi−Oi)
N
RMSE=
v u u u t
N
P
i=1
(Pi−Oi)2
N ,
whereN is number of data points and Pi and Oi denote
CMAQ-simulated and observed concentrations, respectively. We also employed the aerosol optical depth (AOD), measured by a GOCI sensor from the geostationary or-bit onboard the Communication Ocean and Meteorolog-ical Satellite (COMS). The GOCI level 1B (L1B) data provide hourly daylight spectral images (09:30–16:30 LST, 8 times a day) for east Asia. The spatial coverage extends to 2500 km×2500 km centered at 36◦N, 130◦E (Lee et al., 2010; Choi et al., 2016). The AOD at 550 nm with a 6 km resolution were obtained from GOCI L1B data using a retrieval algorithm introduced by Choi et al. (2016). The GOCI-derived AOD data were used for constraining of PM concentrations and the model evaluation. For the evaluation of CMAQ-simulated PM10, we converted the concentration
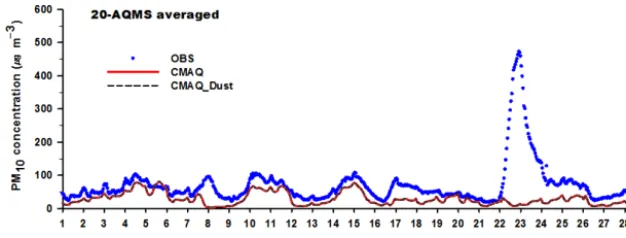
Figure 3.Time series of observed (OBS: blue dots) and simulated (CMAQ: red line, CMAQ_Dust: black dashed line) PM10concentrations
in February 2015. The values are averaged values for 20 AQMS sites: CMAQ_Dust is closely coupled with the standard CMAQ modeling results (red line).
(Song et al., 2008; Park et al., 2011):
AODCMAQ=
N
X
i=1
(σsp+σap)i1Zi (4)
σsp=(0.003) ft(RH)NH+4 +SO−4 +NO−3
+(0.004)[OM]+(0.001)[FS]+(0.0006)[CM] (5)
σap=(0.01)[LAC], (6)
where i is the vertical layer number, 1Z is the layer thickness, and the brackets indicate mass concentrations in mg m−3 units. The OM, FS, CM, and LAC denote mass concentrations of organic species, fine soil, coarse particles, and light-absorbing carbon, respectively. The specific scat-tering coefficients in the equations (i.e., 0.003, 0.004, 0.001, 0.0006, and 0.001) are represented in units of m2mg−1. The ft(RH), calculated by the method described by Song
et al. (2008), denotes relative humidity based on the aerosol growth factor.
3 PM10simulation results from standard CMAQ
3.1 Comparison with surface measurement
We simulated PM10concentrations by standard CMAQ and
compared them with surface observational data obtained from the AQMS network of NIER in Korea. For this com-parison, we selected 20 AQMS sites, evenly distributed in Korea (Fig. 2), and calculated mean PM10 concentrations at
all of the sites. We do not present the results for PM2.5
be-cause the simulated PM2.5 exhibited almost the same
tem-poral variation and lower concentrations to those of PM10.
In addition, the coarse particles comprise a major portion of the total PM during the Asian dust period, as described by Chun et al. (2001). From the comparison shown in Fig. 3, the concentration of CMAQ-simulated PM10was slightly
un-derestimated, but its temporal variation showed reasonably close agreement with observations except for the Asian dust episode (22–24 February 2015). The CMAQ failed to capture
the high peaks of PM10 in the episode caused by the
trans-port of the massive dust from the Gobi Desert and Mongolia region.
As shown in Table 2, the performance of CMAQ simula-tion for the entire period (February 2015) was poor. For ex-ample, the high value of RMSE (78.03 µg m−3), low value of IOA (0.36), and negative value of MBE (−39.94 mug m−3) indicate that CMAQ underestimated PM10 and its
tempo-ral variation did not agree well with the observations. The calculated statistics for the period excluding the Asian dust episodes was much better than those for the entire period, as indicated in Table 2. The large differences in these findings clearly reveal that the performance of CMAQ is relatively ac-curate for the regular simulation period, but it is not for the Asian dust period. As shown in Fig. 4 and Table S3, mete-orological fields such as temperature and wind speed in the receptor regions (Korea) showed close agreement with obser-vations, even during the Asian dust period. It suggests that the underestimated PM10 concentrations were likely due to
the uncertainty in meteorology in the source regions (China and Mongolia) and/or faulty estimation of dust emissions for the CMAQ simulation. We attributed the main reason for the PM10underestimation to poorly estimated dust emission
because CMAQ showed poor performance only during the Asian dust period.
To enhance the performance of CMAQ for PM10
simula-tions during the Asian dust period, we employed the in-line windblown dust module in CMAQ v5.0.2. The module calcu-lates the vertical dust emission flux (F) by following formula described by Fu et al. (2014):
F =
M
X
i=1
N
X
j=1
K×A×ρ
g×Si×SEP×u∗ ×(u2∗−u2∗
t i,j), (7)
Figure 4.Time series of observed (OBS: blue dots) and WRF-simulated (WRF: red line)(a)temperature and(b)wind speed in Febru-ary 2015. The values are averaged values for 20 AQMS sites.
Table 2.Statistical parameters of PM10concentrations at 20 AQMS sites in Korea for the simulations without the dust module (CMAQ),
with the in-line dust module (CMAQ_Dust).
Entire period Without dust events
RMSE IOA MBE RMSE IOA MBE
CMAQ 78.03 0.36 −39.94 28.56 0.81 −22.83 CMAQ_Dust 78.03 0.36 −39.94 28.56 0.81 −22.83
soil erodible potential,u∗is the friction velocity, andu∗t i,j denotes the threshold friction velocity.
Interestingly, the employment of the in-line windblown dust module in CMAQ simulations did not provide dis-cernible enhancement in PM10concentrations (Table 2)
be-cause of lower friction velocity than the threshold in the mod-ule during the simulation period (February 2015) (Table S4 in the Supplement). Several studies have reported that the threshold friction velocity plays a key role in the calculation of dust emission flux because the threshold can determine the probability of the lifting of dust particles (Choi and Fer-nando, 2008; Fu et al., 2014). This research also implies that more studies that enhance the capability of dust modules dur-ing the winter period should be performed.
3.2 Comparison with satellite-based observation
Figure 5 presents a comparison of time-averaged AOD de-rived from GOCI and CMAQ. For an unbiased comparison of AOD, we removed grid cells from GOCI data consisting of fewer than 15 pixels (i.e., bad pixels) because of cloud contamination; we also did not include the corresponding grid cells in CMAQ for our comparison. The GOCI-derived AOD shows several blank areas in the northern part of the Korean Peninsula, near the northeastern region of China, and in most regions of Japan because of the significantly high fraction of clouds over these areas. The horizontal fea-tures of the CMAQ-derived AOD were similar to those of the GOCI-derived AOD, but CMAQ overestimated the AOD near the southeastern part of China. On the other hand, com-pared to the GOCI-derived AOD, the CMAQ underestimated the AOD over the Yellow Sea and Korea. As mentioned in Sect. 3.1, CMAQ underestimated surface PM10
Figure 5.The(a)GOCI- and(b)CMAQ-derived AOD (550 nm) during the entire time period of simulations. The values are averaged for February 2015.
underestimated compared to GOCI-derived AOD, consistent with the surface measurements. These comparisons using the satellite and surface measurements indicated that the CMAQ was unable to capture the high levels of PM in Korea during the simulation period in this study (February 2015). Hence, the discrepancy between CMAQ- and GOCI-derived AOD is likely due to uncertainty in emissions of PM precursors such SO2, NOx, and NH3(Jeon et al., 2015) and meteorology over
source regions as discussed in Sect. 3.1.
Compared to the GOCI-derived AOD, the CMAQ-derived AOD near the northern regions of the Korean Peninsula was underestimated. This underestimation may have resulted from the failure of CMAQ to simulate the Asian dust emis-sions and their transport to the Korean Peninsula on 22– 24 February 2015. The CMAQ-derived AOD was underes-timated primarily in the moving pathway of the Asian dust (i.e., between the Gobi Desert (source area) and the Korean Peninsula (receptor area)). As addressed in Sect. 3.1, the in-line windblown dust module in CMAQ failed to accurately estimate the dust emissions during the Asian dust period and it caused the model to underestimate AOD near the northern regions of the Korean Peninsula.
To further investigate the issue of underestimation of CMAQ during the period of Asian dust (22–24 Febru-ary 2015), we compared the GOCI- and CMAQ-derived AODs on each event day. Unfortunately, the comparison was available only on 22 February since the GOCI-derived AOD included a significantly high number of blank pix-els on the other event days because of the high fraction of cloud cover. Figure 6 shows GOCI- and CMAQ-derived daily mean (09:30–16:30 LST) AODs on 22 February. The GOCI-derived AOD clearly showed massive amounts of dust near the northwestern regions of the Korean Peninsula and the eastern part of China and densely distributed dust particles over the Yellow Sea that were transported from the Gobi Desert. In contrast, CMAQ did not reproduce the high dust concentrations near the Korean Peninsula because of the fail-ure in the estimation of dust emissions.
We concluded that CMAQ clearly underestimated PM10
concentrations during the simulation period and failed to
cap-ture peaks during the Asian dust period starting on 22 Febru-ary. Thus, we attempted to use STOPS for capturing the dust enhanced PM10in Korea (receptor region). We used the dust
storm data temporarily detected by satellite measurements between the source and receptor regions as an input for the STOPS modeling. The following sections describe the details of how STOPS was used for PM10forecasting.
4 Application of STOPS for PM10forecasting
Assuming the CMAQ PM10 simulation results in this study
were used for forecasting purposes, the severe dust events starting on 22 February 2015 could not be predicted. Thus, to accurately forecast the transport of the massive dust storm, we must take into account the most recent and accurate ini-tial and boundary conditions and emissions. Figure 7 shows the GOCI-derived AOD on 21–22 February, when a dust storm was approaching Korea (receptor region). The mas-sive dust storm was not evident from the GOCI-derived AOD on 21 February, but a center of the dust storm in the north-western region of the Korean Peninsula was first seen at 10:30 LST on 22 February. Upon observation of the mas-sive dust concentrations from the GOCI-derived AOD at 10:30 LST on 22 February, a new PM10 forecasting using
STOPS with real-time AOD data can be performed in a short time (i.e., a few minutes). The current forecasting results can then be replaced by the results from the STOPS. For the new PM10 forecasting using STOPS, we intended to use
the GOCI-derived AOD as a new initial condition for PM10
species. However, the approach does not fully consider con-tinuous transport of dust from the source regions because the impact of the changed initial condition on the STOPS results would be diminished within a few hours. Thus, we used the GOCI-derived AOD as PM emissions for the STOPS fore-casting to make the best use of the AOD data.
4.1 Satellite-adjusted PM concentrations
For the new PM10 forecasting using STOPS, we first
concentra-Figure 6.The(a)GOCI- and(b)CMAQ-derived AODs (550 nm) on 22 February 2015. The values are averaged from 09:30 to 16:30 LST.
Figure 7.The GOCI-derived AOD (550 nm) from 13:30 LST on 21 February to 12:30 LST on 22 February 2015. The white-colored areas represent missing pixels.
tions and directly add them to the simulated PM concentra-tions by STOPS. However, the sudden and rapid changes in PM concentration made the STOPS simulation unstable and they sometimes caused unexpected termination of STOPS runs due to overflow error. To resolve this problem, we re-garded the GOCI-derived AOD as PM emissions and indi-rectly constrained the original PM concentrations by using the alternative emissions. In short, the GOCI-derived AOD was converted to emissions and used for the STOPS fore-casting. We should note that the alternative emissions are not real, but are rather the enhanced dust concentrations which are taking the form of emissions. We concluded this methodology could be an effective way to reflect the satellite-measured AOD to STOPS simulation without possible com-putational error.
As indicated in Fig. 7, the massive dust storm was first cap-tured by the GOCI-derived AOD at 10:30 LST on 22 Febru-ary 2015, so we adjusted the standard emissions at a
corre-sponding time based on the GOCI-derived AOD and used them for the STOPS forecasting. We should note that the AOD and the emission rate are expressed in different units; the AOD is a unitless value, while the emission rate is ex-pressed in units of grams per second (particles) or moles per second (gas-phase species); therefore, we employed a scaling factor to convert the AOD to the emission rate. To find a rea-sonable scaling factor, we regridded the domain of the GOCI-derived AOD data so that they corresponded with the CMAQ domain and compared the AOD in each grid cell with cor-responding emission rates of total PM in the MIX inventory (e.g., PM10). We used only the grid cells with valid AODs (no
ex-plain the relationship between AOD and emissions. Because the relationship is valid for only a particular domain (Fig. 2) and time (10:30 LST on 22 February 2015), the ratio for each case should be recalculated.
For the unit conversion from AOD to the emissions rate of total PM, we used the estimated ratio as a scaling factor and calculated the total PM emissions by the following equation (Eq. 8):
PMTi,j =AODi,j×SF, (8)
where PMTi,j and AODi,j represent the emission rates of
total PM and GOCI-derived AOD in each grid cell, respec-tively. SF is the calculated scaling factor (1884.49 g s−1), which indicates the relationship between the AOD and the emission rate.
For the STOPS simulation, we split the calculated PMTi,j
into several specific species, including coarse and fine par-ticles, used for the CB05–AERO6 chemical mechanism. In order to calculate the species distribution, we estimated the mass fractions of each PM species during the Asian dust events based on the findings in Kim et al. (2005) and Stone et al. (2011), which described the composition of measured PM during the Asian dust periods (Table 3). More than half of the PMTi,j was allocated to coarse particles (PMC)
be-cause they comprise a major percentage of Asian dust, as re-ported in several studies (Kim et al., 2003; Kim et al., 2005; Lee et al., 2004; Stone et al., 2011). The speciated PM emis-sions were injected into standard PM emisemis-sions in each grid cell. Based on the findings by Kim et al. (2010), the amounts of the alternative emissions were assumed to be distributed below the altitude of 3 km (1 to 11 vertical layers). The en-tire procedures of the new PM forecasting by STOPS using GOCI-derived AOD are briefly depicted in Fig. S3.
4.2 Enhanced PM10forecasting using STOPS
We conducted a new PM10 forecasting run using STOPS
with the constrained PM concentrations (by using alternative emissions) and examined the improvement in its accuracy over that of the standard CMAQ model. The STOPS fore-casting covers 1 day (24 h), which began at 11:00 LST on 22 February 2015, immediately following the massive dust were first observed in the GOCI-derived AOD between the source and receptor regions.
Figure 8 shows the comparison of the PM10
concentra-tion from CMAQ using standard emissions and STOPS us-ing alternative emissions. The PM10 from standard CMAQ
exhibited high concentrations over the eastern part of China, central Yellow Sea, and northwestern part of the Korean Peninsula. By contrast, the constrained PM10 by the
alter-native emissions (Fig. S4 in the Supplement) exhibited sig-nificantly increased concentrations, particularly in the north-western part of the Korean Peninsula (Fig. 8). The con-strained PM10concentration showed similar features as those
of the GOCI-derived AOD, shown in Fig. 6a, implying that
the dense dust attributed by Asian dust was accurately re-flected in the STOPS forecasting.
We should note that the duration of the release of alterna-tive emissions strongly affected the simulated PM10. Hence,
it plays an important role in the STOPS forecasting, so we conducted four forecasting runs with different release dura-tions (3, 6, 12, and 24 h) as shown in Fig. 9. The results from the four STOPS runs were then compared with those from standard CMAQ and available PM10 surface measurements.
Figure 9 exhibits clear differences in the temporal variation of PM10resulting from the impact of the release durations.
As addressed in Sect. 3.1, the standard CMAQ run failed to capture the drastic increase in PM10 concentrations on
22 February 2015 because of the poor dust emission mod-eling in CMAQ. However, the STOPS forecasting showed significantly improved PM10 results compared to standard
CMAQ. The results indicated higher PM10 concentrations
than those of CMAQ, and they were much closer to obser-vations.
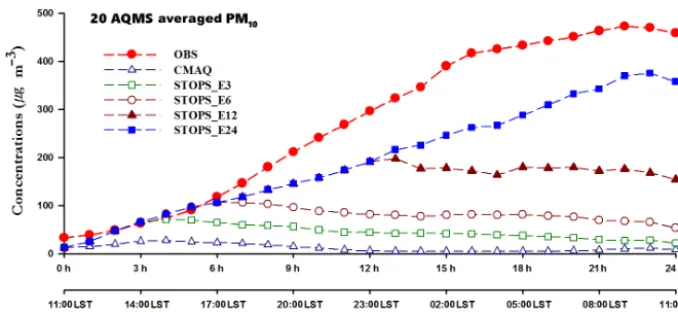
Interestingly, Fig. 9 shows that predicted PM10by STOPS
with a duration of release of 3 h (STOPS_E3) closely agreed with observations during the first 3 h. However, the simu-lated PM10 began to decrease immediately after the third
hour, and the agreement with observations gradually wors-ened with time. The results of the other STOPS runs with different durations of release of 6, 12, and 24 h (STOPS_E6, STOPS_E12 and STOPS_E24, respectively) were almost the same as those of STOPS_E3. In other words, the impact of the alternative emissions on the PM10 prediction highly
depends on the durations of emission release and the im-pact was gone after the release ended. STOPS_E24 repre-sented the closest agreement with observations, implying that STOPS_E24 produced the greatest improvement in 1-day PM10 forecasting because of continuous emissions during
the entire forecasting time (24 h).
Despite its positive performance in 1-day PM10
forecast-ing, STOPS_E24 did not perfectly capture the high PM10
concentrations during the Asian dust event. In fact, it un-derestimated the peak of observed PM10, which may have
resulted from uncertainty inherent in the methodology using AOD estimation. Direct conversion from the AOD to the al-ternative emissions rate using a scaling factor is challenging because it has not yet been proven reliable by existing stud-ies. Hence, the uncertainty inherent in unit conversion might have contributed to the inaccuracy of the emissions rate. In addition, the GOCI-derived AOD data contained missing data due to the cloud cover over the study area during the event on 22 February and, as a consequence, it did not ac-curately represent the distribution of transported Asian dust. The most probable reason for the underestimated PM10
alter-Figure 8.Difference of the simulated PM10concentrations (µg m−3)between the standard CMAQ run (left) and STOPS forecasting run
with alternative emissions estimated according to GOCI-derived AOD (right) inside the STOPS domain at 12:00 LST on 22 February 2015.
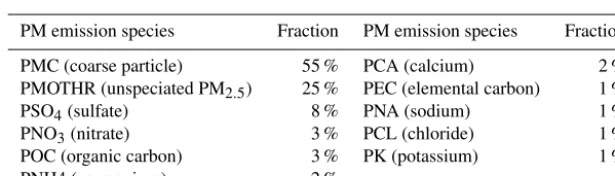
Table 3.Specific fractions (%) for the splitting of total PM emission into specific PM species in the CB05–AERO6 chemical mechanism used in this study.
PM emission species Fraction PM emission species Fraction
PMC (coarse particle) 55 % PCA (calcium) 2 % PMOTHR (unspeciated PM2.5) 25 % PEC (elemental carbon) 1 %
PSO4(sulfate) 8 % PNA (sodium) 1 % PNO3(nitrate) 3 % PCL (chloride) 1 %
POC (organic carbon) 3 % PK (potassium) 1 % PNH4 (ammonium) 2 %
native emissions in the first time step did not accurately rep-resent the varied dust distribution in the next time step. The uncertainty with regard to the alternative emissions increases with time. The STOPS_E24-predicted PM10 concentrations
showed close agreement with observations during the first 6 h (Fig. 9), but error gradually widened with time. However, as observation in later hours cannot be reflected at the begin-ning of forecasting, such a problem is inevitable in a fore-casting mode. Thus, repeated forefore-casting for short time pe-riods (e.g., 6 h) with the variable alternative emissions could possibly provide more accurate PM10 results for the Asian
dust events. STOPS would be very useful for repeated PM10
forecasting because of its remarkably short simulation time (a few minutes).
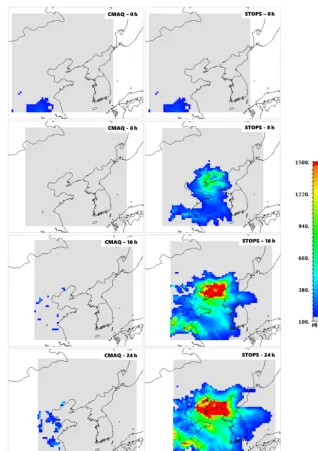
To verify the horizontal distribution of PM10 resulting
from the effect of constrained PM, we compared the sim-ulated surface PM10 concentrations from the STOPS
fore-casting to those from standard CMAQ. Figure 10 shows the horizontal distribution of surface PM10 concentrations
in-side the STOPS domain simulated by standard CMAQ and STOPS_E24, which indicates the most accurate 1-day fore-casting results of all the STOPS simulations (from Fig. 9). The location of the STOPS domain moved slightly toward the southeast according to the changed mean wind in the do-main. In the first time step (0 h, 11:00 LST, 22 February), STOPS_E24 showed the same PM10distribution as standard
CMAQ because the initial condition for the STOPS simu-lation was provided by the standard CMAQ. After 8 h, the
PM10 concentration from STOPS_E24 differed from that
of the standard CMAQ due to the effect of the alterna-tive emissions by the GOCI-derived AOD. After 16 and 24 h, the difference became more pronounced. Results of standard CMAQ did not show a high level of PM10, but
those of STOPS_E24 showed a PM10 concentration of at
least 100 µg m−3 near the Korean Peninsula. Specifically, they showed extremely high PM10 concentrations of over
1500 µg m−3in the northwestern part of the Korean Penin-sula. Figure 7 (10:30 LST on 22 February) indicates massive dust over that area from the GOCI-derived AOD consistent with the enhanced PM10 concentrations. The massive dust
over the region was transported to Korea and led to signifi-cantly enhanced levels of PM10. The horizontal distributions
of PM10at higher vertical levels up to 3 km showed similar
features at the surface layer because the alternative emissions were evenly distributed below that level.
Overall, even with the uncertainties addressed above, the massive dust storm near the Korean Peninsula on an Asian dust day was reasonably reproduced by the STOPS forecast-ing by usforecast-ing PM emissions constrained by GOCI-derived AOD. These results indicate that the STOPS could possibly be used for PM10 forecasting with real-time constraints of
Figure 9. Comparison of observed, CMAQ-simulated, and STOPS-simulated PM10 concentrations during the 24 h from 10:00 LST on
22 February 2015.
5 Summary
This study introduced a revised modeling framework using a hybrid Eulerian–Lagrangian model (called STOPS) that showed almost the same performance as CMAQ, but used a shorter simulation runtime. STOPS v1.5 has been imple-mented into CMAQ v5.0.2 for PM10 simulations over the
east Asia during Asian dust events and we investigated the possibility of using STOPS to enhance the accuracy of PM10
forecasting. During the entire simulation period (Febru-ary 2015), the standard CMAQ underestimated PM10
con-centrations compared to surface observations and failed to capture the PM10 peaks of Asian dust events (22–24
Febru-ary 2015). With reasonable meteorological input, the under-prediction of PM10concentration was mainly due to the
inac-curate estimation of dust emissions during this period used in CMAQ. We also evaluated the horizontal feature of CMAQ-simulated PM10 using satellite-observed data (GOCI). The
PM10 results from the standard CMAQ run were compared
to those of the GOCI-derived AOD and the results indicated that the standard CMAQ barely captured the transported dust from the Gobi Desert to the Korean Peninsula during the Asian dust events.
For more accurate PM10 prediction, we used the STOPS
model and conducted several simulations using constrained PM concentrations (by using alternative emissions) based on the GOCI-derived AOD, which reflected the most recent ini-tial and boundary conditions near the Korean Peninsula. The STOPS simulations showed higher PM10concentrations than
the standard CMAQ and indicated clear dependence on the duration of the alternative emission release. The STOPS sim-ulations showed reasonable PM10concentrations close to
ob-servational data, but they did not capture the peak during the Asian dust events because of uncertainty in the methodology used for the constraining PM concentrations. The direct con-version from AOD to emissions using a scaling factor was challenging because it has not yet been proven reliable by
ex-isting studies. In addition, the GOCI-derived AOD data were missing many values because of the high fraction of cloud cover during the event and consequently, it did not accurately reflect the massive dust storm on the Asian dust day.
Overall, STOPS reasonably reproduced the high level of PM10over the Korean Peninsula during the Asian dust event
with constrained PM concentrations using satellite measure-ments. Although STOPS indicated significantly high PM10
enhancement for the episode, it still requires improvement before its results can be generalized. Thus, we should direct our study toward additional verification of the methodology regarding unit conversion (e.g., possible nonlinearities) and numerous sensitivity simulations for different cases to deter-mine the optimal duration of the release of the alternative emissions. The results of this study are an ideal starting point for such studies.
The ultimate goal of this study was to suggest an effective tool for successive PM10forecasting and modeling over east
Asia. The results clearly showed the reliability and various advantages of STOPS modeling. Therefore, because of its reliable performance with remarkably high computation effi-ciency, the STOPS model could prove to be a highly useful tool for enhancing dust forecasting/modeling performance over east Asia. Further, the benefit of STOPS modeling could be generalized to the forecasting and modeling of unexpected events such as wildfires and oil spills.
6 Code availability
The STOPS v1.5 source code can be obtained by contacting the corresponding author at [email protected].
Figure 10.Horizontal distributions of standard CMAQ- and STOPS_E24-simulated surface PM10concentrations inside the STOPS domain.
The concentrations were recorded at 8 h intervals after the beginning of the simulation (11:00 LST on 22 February 2015).
Acknowledgements. This study was partially supported by funding from the Ministry of Environment of Korea (NIER-1900-1946-302-210). We thank the team members of GOCI and AQMS for the preparation of the remote sensing data and PM measurement data, respectively.
Edited by: A. B. Guenther
Reviewed by: two anonymous referees
References
Byun, D. and Schere, K. L.: Review of the governing equations, computational algorithms, and other components of the
Models-3 Community Multiscale Air Quality (CMAQ) modeling system, Appl. Mech. Rev., 59, 51–77, doi:10.1115/1.2128636, 2006. Choi, H.-J., Lee, H. W., Jeon, W.-B., and Lee, S.-H.: The
numeri-cal modeling the sensitivity of coastal wind and ozone concen-tration to different SST forcing, Atmos. Environ., 46, 554–567, doi:10.1016/j.atmosenv.2011.06.068, 2012.
Choi, M., Kim, J., Lee, J., Kim, M., Park, Y.-J., Jeong, U., Kim, W., Hong, H., Holben, B., Eck, T. F., Song, C. H., Lim, J.-H., and Song, C.-K.: GOCI Yonsei Aerosol Retrieval (YAER) algo-rithm and validation during the DRAGON-NE Asia 2012 cam-paign, Atmos. Meas. Tech., 9, 1377–1398, doi:10.5194/amt-9-1377-2016, 2016.
episodic PM events in the US/Mexico border, Atmos. Environ., 42, 6039–6046, doi:10.1016/j.atmosenv.2008.03.038, 2008. Chun, Y., Boo, K.-O., Kim, J., Park, S.-U., and Lee, M.: Synopsis,
transport, and physical characteristics of Asian dust in Korea, J. Geophys. Res., 106, 18461–18469, doi:10.1029/2001JD900184, 2001.
Czader, B. H., Percell, P., Byun, D., Kim, S., and Choi, Y.: Develop-ment and evaluation of the Screening Trajectory Ozone Predic-tion System (STOPS, version 1.0), Geosci. Model Dev., 8, 1383– 1394, doi:10.5194/gmd-8-1383-2015, 2015.
Fu, X., Wang, S. X., Cheng, Z., Xing, J., Zhao, B., Wang, J. D., and Hao, J. M.: Source, transport and impacts of a heavy dust event in the Yangtze River Delta, China, in 2011, Atmos. Chem. Phys., 14, 1239–1254, doi:10.5194/acp-14-1239-2014, 2014.
Gelencser, A., May, B., Simpson, D., Sanchez-Ochoa, A., Kasper-Giebl, A., Puxbaum, H., Caseiro, A., Pio, C., and Legrand, M.: Source apportionment of PM2.5 organic aerosol
over Europe: Primary/secondary, natural/anthropogenic, and fossil/biogenic origin, J. Geophys. Res., 112, D23S04, doi:10.1029/2006JD008094, 2007.
Heo, J.-B., Hopke, P. K., and Yi, S.-M.: Source apportionment of PM2.5 in Seoul, Korea, Atmos. Chem. Phys., 9, 4957–4971,
doi:10.5194/acp-9-4957-2009, 2009.
Houyoux, M., Vukovich, J., and Brandmeyer, J.: Sparse Matrix Ker-nel EmissionsModeling System: SMOKE User Manual, MCNC-North Carolina Supercomputing Center, available at: http://www. cmascenter.org/ (last access: 12 October 2016), 2000.
Jeon, W.-B., Lee, S.-H., Lee, H., Park, C., Kim, D.-H., and Park, S.-Y.: A study on high ozone formation mech-anism associated with change of NOx/VOCs at a rural
area in the Korean Peninsula, Atmos. Environ., 89, 10–21, doi:10.1016/j.atmosenv.2014.02.005, 2014.
Jeon, W., Choi, Y., Lee, H. W., Lee, S.-H., Yoo, J.-W., Park, J., and Lee, H.-J.: A quantitative analysis of grid nudging effect on each process of PM2.5 production in the Korean Peninsula, Atmos. Environ., 122, 763–774, doi:10.1016/j.atmosenv.2015.10.050, 2015.
Kashima, S., Yorifujy, T., Bae, S., Honda, Yasushi, Lim, Y.-H., and Hong, Y.-C.: Asian dust effect on cause-specific mortality in five cities across South Korea and Japan, Atmos. Environ., 128, 20– 27, doi:10.1016/j.atmosenv.2015.12.063, 2016.
Kim, H. M., Kay, J. K., and Jung, B.-J.: Application of Adjoint-based forecast sensitivities to Asian dust transport events in Ko-rea, Water Air Soil Pollut., 195, 335–343, doi:10.1007/s11270-008-9750-8, 2008.
Kim, K.-H., Choi, G.-H., Kang, C.-H., Lee, J.-H., Kim, J. Y., Youn, Y. H., and Lee, S. R.: The chemical composition of fine and coarse particles in relation with the Asian Dust events, Atmos. Environ., 37, 753–765, doi:10.1016/S1352-2310(02)00954-8, 2003.
Kim, S.-W., Yoon, S.-C., Jefferson, A., Ogren, J. A., Dutton, E. G., Won, J.-G., Ghim, Y. S., Lee, B.-I., and Han, J.-S.: Aerosol op-tical, chemical and physical properties at Gosan, Korea during Asian dust and pollution episodes in 2001, Atmos. Environ., 39, 39–50, doi:10.1016/j.atmosenv.2004.09.056, 2005.
Kim, S.-W., Yoon, S.-C., Kim, J., Kang, J.-Y., and Sugimoto, N.: Asian dust event observed in Seoul, Korea, during 29–31 May 2008: Analysis of transport and vertical distribution of dust
par-ticles from lidar and surface measurements, Sci. Total Environ., 408, 1707–1718, doi:10.1016/j.scitotenv.2009.12.018, 2010. Kwon, H.-J., Cho, S.-H., Chun, Y., Lagarde, F., and Pershagen, G.:
Effects of the Asian Dust envents on daily mortality in Seoul, Ko-rea, Environ. Res., 90, 1–5, doi:10.1006/enrs.2002.4377, 2002. Lee, B.-K., Jun, N.-Y., and Lee, H. K.: Comparison of particulate
matter characteristics before, during, and after Asian dust events in Incheon and Ulsan, Korea, Atmos. Environ., 38, 1535–1545, doi:10.1016/j.atmosenv.2003.12.021, 2004.
Lee, D. G., Lee, Y.-M., Jang, K.-W., Yoo, C., Kang, K.-H., Lee, H., Jung, S.-W., Park, M., Lee, S.-B., Han, S., Hong, J.-H., and Lee, S.-J.: Korean national emissions inventory system and 2007 air pollutant emissions, Asian, J. Atmos. Environ., 5, 278–291, doi:10.5572/ajae.2011.5.4.278, 2011.
Lee, J., Kim, J., Song, C. H., Ryu, J.-H., Ahn, Y.-H., and Song, C. K.: Algorithm for retreval of aerosol optical properties over the ocean from the Geostationary Ocean Color Imager, Remote Sens. Environ., 114, 1077–1088, doi:10.1016/j.rse.2009.12.021, 2010.
Lee, S.-H., Lee, H. W., Kim, Y.-K., Jeon, W.-B., Choi, H.-J., and Kim, D.-H.: Impact of continuously varied SST on land-sea breezes and ozone concentration over south-western coast of Korea, Atmos. Environ., 45, 6439–6450, doi:10.1016/j.atmosenv.2011.07.059, 2011.
Li, M., Zhang, Q., Kurokawa, J., Woo, J.-H., He, K. B., Lu, Z., Ohara, T., Song, Y., Streets, D. G., Carmichael, G. R., Cheng, Y. F., Hong, C. P., Huo, H., Jiang, X. J., Kang, S. C., Liu, F., Su, H., and Zheng, B.: MIX: a mosaic Asian anthropogenic emis-sion inventory for the MICS-Asia and the HTAP projects, Atmos. Chem. Phys. Discuss., 15, 34813–34869, doi:10.5194/acpd-15-34813-2015, 2015.
Li, X., Choi, Y., Czader, B., Roy, A., Kim, H., Lefer, B., and Pan, S.: The impact of observation nudging on simulated me-teorology and ozone concentrations during DISCOVER-AQ 2013 Texas campaign, Atmos. Chem. Phys., 16, 3127–3144, doi:10.5194/acp-16-3127-2016, 2016.
Ngan, F., Byun, D., Kim, H., Lee, D., Rappengluck, B., and Pour-Biazar, A.: Performance assessment of retrospec-tive meteorological inputs for use in air quality model-ing durmodel-ing TexAQS 2006, Atmos. Environ., 54, 86–96, doi:10.1016/j.atmosenv.2012.01.035, 2012.
Nolte, C. G., Appel, K. W., Kelly, J. T., Bhave, P. V., Fahey, K. M., Collett Jr., J. L., Zhang, L., and Young, J. O.: Evaluation of the Community Multiscale Air Quality (CMAQ) model v5.0 against size-resolved measurements of inorganic particle com-position across sites in North America, Geosci. Model Dev., 8, 2877–2892, doi:10.5194/gmd-8-2877-2015, 2015.
Otte, T. L.: The impact of nudging in the meteorological model for retrospective air quality simulations. Part I: Evaluation against national observation networks, J. Appl. Meteorol. Clim., 47, 1853–1867, doi:10.1175/2007JAMC1790.1, 2008a.
Otte, T. L.: The impact of nudging in the meteorological model for retrospective air quality simulations. Part II: Evaluating collo-cated meteorological and air quality observations, J. Appl. Me-teorol. Clim., 47, 1868–1887, doi:10.1175/2007JAMC1791.1, 2008b.
us-doi:10.5194/acp-11-12275-2011, 2011.
Roy, B., Mathur, R., Gilliland, A. B., and Howard, S. C.: A com-parison of CMAQ-based aerosol properties with IMPROVE, MODIS, and AERONET data, J. Geophys. Res., 112, D14301, doi:10.1029/2006JD008085, 2007.
Skamarock, W., Klemp, J. B., Dudhia, J., Gill, D. O., Barker, D. M., Duda, M. G., Huang, X.-Y., Wang, W., and Powers, J. G.: A description of the advanced research WRF version 3, NCAR technical note NCAR/TN/u2013475, 2008.
Song, C. H., Park, M. E., Lee, K. H., Ahn, H. J., Lee, Y., Kim, J. Y., Han, K. M., Kim, J., Ghim, Y. S., and Kim, Y. J.: An investigation into seasonal and regional aerosol characteristics in East Asia us-ing model-predicted and remotely-sensed aerosol properties, At-mos. Chem. Phys., 8, 6627–6654, doi:10.5194/acp-8-6627-2008, 2008.
2016), 2005.
Zhang, Q., Streets, D. G., Carmichael, G. R., He, K. B., Huo, H., Kannari, A., Klimont, Z., Park, I. S., Reddy, S., Fu, J. S., Chen, D., Duan, L., Lei, Y., Wang, L. T., and Yao, Z. L.: Asian emis-sions in 2006 for the NASA INTEX-B mission, Atmos. Chem. Phys., 9, 5131–5153, doi:10.5194/acp-9-5131-2009, 2009. Zhao, B., Wang, P., Ma, J. Z., Zhu, S., Pozzer, A., and Li, W.: