M E T H O D O L O G Y
Open Access
Improved filtering of DNA methylation
microarray data by detection
p
values and
its impact on downstream analyses
Jonathan A. Heiss
*and Allan C. Just
Abstract
Background:DNA methylation microarrays are popular for epigenome-wide association studies (EWAS), but spurious values complicate downstream analysis and threaten replication. Conventional cut-offs for detectionpvalues for filtering out undetected probes were demonstrated in a single previous study as insufficient leading to many apparent methylation calls in samples from females in probes targeting the Y-chromosome. We present an alternative approach
to calculate more accurate detectionpvalues utilizing non-specific background fluorescence. We evaluate and
compare our proposed approach of filtering observations with conventional ones by assessing the detection of Y-chromosome probes among males and females in 2755 samples from 17 studies on the 450K microarray and masking of large outliers between technical replicates and their impact downstream via an EWAS reanalysis.
Results:In contrast to conventional approaches, ours marks most Y-chromosome probes in females as undetected while removing a median of only 0.14% of the data per sample, catches more (30% vs. 6%) of large outliers (more than 20 percentage point difference between technical replicates), and helps to identify strong associations previously obfuscated
by outliers between whole blood DNA methylation and chronological age in a well-powered EWAS (n= 729).
Conclusions:We provide guidance for filtering both 450K and EPIC microarrays as an essential preprocessing step to reduce spurious values. An implementation (including a function compatible with objects from the popularminfi package) was added toewastools, an R package for comprehensive quality control of DNA methylation microarrays. Scripts to reproduce all analyses are available atdoi.org/10.5281/zenodo.1443561.
Keywords:DNA methylation, Microarray analysis, Illumina 450K, Outlier detection, Data cleaning, EWAS
Introduction
The Illumina Infinium HumanMethylation450 (450K) and the more recent Infinium MethylationEPIC (EPIC) arrays are two widely popular platforms for epigenome-wide association studies (EWAS). Before beginning with downstream analyses, comprehensive quality control (QC) should be conducted to identify problematic sam-ples. But samples passing QC still contain individual probes with spurious values that do not represent the underlying methylation state, for example, when targeted loci are present in low quantities due to amplification ar-tifacts or are mutated and no longer match their intended complementary probe sequence. Affected
probes feature mostly background noise and should be excluded. This decision is based on detection p values intended to distinguish signal from noise with a single cut-off. Suggested pvalue cut-offs in the literature span several magnitudes from 0.05 to 1e−16 (the smallest possible floating point double precision number on the arithmetic scale), although 0.05 and 0.01 are most com-monly employed. Lehne et al. systematically evaluated detection p value cut-offs in a single large study based on the idea that probes targeting the Y-chromosome should be detected in samples from males but not fe-males [1]. Because of an implementation error in the software used by Lehne et al., we reexamined the choice of cut-off by applying their benchmark to a large set of publicly available DNA methylation microarray data from multiple studies and also examine outliers in tech-nical replicates as well as the impact on the findings of a * Correspondence:[email protected]
Department of Environmental Medicine and Public Health, Icahn School of Medicine at Mount Sinai, One Gustave L. Levy Place, Box 1057, New York, NY 10029, USA
well-powered EWAS. In addition to comparing a wide range of detectionpvalue cut-off choices, we demonstrate a modification to computing detectionpvalues based on fluorescence resulting from non-specific binding that re-flects the background noise distribution more accurately and thus further improves the sensitivity to aberrant values. We provide updated software and guidance for re-searchers conducting epigenome-wide association studies to easily incorporate this important preprocessing step in their analytical pipeline.
Methods
Treating DNA with bisulfite converts epigenetic modifi-cations into distinct base sequences. In combination with subsequent whole-genome amplification, the ratio of methylated/unmethylated CpG sites is translated into differences in abundance of these distinct sequences. These hybridize to complementary probes on the 450K and EPIC microarrays and are subsequently linked with fluorescent dyes. By comparing fluorescence intensities of the probes targeting the unmethylated (U) and meth-ylated (M) variant of a CpG site, its methylation level in the DNA input can be inferred. The Infinium Type I probe design includes separate beads for U and M, whereas the Infinium Type II design combinesUandM on the same beads but measured with different dyes/ color channels [2]. In the case of a completely unmethy-lated CpG site, the Uprobe features a very high inten-sity, whereas theMintensity is low, or vice versa, in the case of a completely methylated CpG site. Thus, the total fluorescence intensityT (the sum ofU and M) for a given site is—to a certain degree—independent of the methylation level itself. High intensities usually indicate good signal-to-noise ratio and such probes are hence deemeddetected, whereas low intensities consist mostly of background noise and thus are better classified as un-detectedprobes. Where to draw the line is based on the concept of detection pvalues: the parameters of a nor-mal background distributionBare estimated based on a set of probes thought to feature mainly background noise and apvalue is computed using aztest. If the ob-served value of T is unlikely to be generated by B (i.e., when the associatedpvalue is below the chosen signifi-cance level), a probe is considered detected, otherwise undetected. The previously recommended cut-off of 1e
−16 by Lehne et al. is based onminfiv1.2.0 [3] which mis-specified the parameters ofB(adding standard deviations instead of variances of theUandMcomponents ofT).
We explored two approaches to estimate B based on different subsets of probes on the 450K and EPIC micro-arrays, using either Illumina’s negative control probes specifically designed not to match the human genome, or the fluorescence resulting from non-specific binding observed at theUprobes for completely methylated and
M probes for completely unmethylated CpG sites, re-spectively. Completely (un)methylated CpG sites were identified by selecting the 1000 CpG sites with β values closest to each of the two peaks of the bimodal β value distribution (locations of peaks were determined as done forpeak-based correction[4], a within-array normalization method). We picked probes with β values close to the peaks instead of from the extremes of the distribution, as the latter would exhibit atypically low intensities of back-ground signal. This was done for both color channels sep-arately and including only probes of Infinium Type I design, as these are only used in a single color channel and thus do not suffer from fluorescence leaking from the other color channel measured at the same bead, i.e., so-called cross talk due to spectral overlap between the two fluorophores used on the 450K/EPIC chip. The mark-edly compressed dynamic range of Infinium Type II probes [4] is a result of this cross talk because the design relies upon the dye-linked targets binding to the same beads. Indeed, as evidence of cross talk where we would expect no difference in signal, we found across all datasets that for completely unmethylated Type I Red probes the green out-of-band intensities at the U beads were a me-dian of 2.7 times higher than those at the Mbeads, indi-cating that the high red fluorescence at the U beads is bleeding into the green color channel. Conversely, for completely methylated Type I Red probes, the green out-of-band intensities at theM beads were a median of 3.8 times higher than those at theUbeads. Robust estima-tors of location and spread were used with a corrected es-timation of the variance ofB.
Detection of Y-chromosome probes
Seventeen public 450K datasets comprising 2826 sam-ples representing a wide range of tissues were down-loaded from the Gene Expression Omnibus (GEO) repository. Two thousand seven hundred fifty-five sam-ples (described in Table 1) passed our comprehensive quality control pipeline including screening to exclude sex mismatches or failed assays according to any of the 17 performance metrics outlined in the Illumina BeadArray Controls Reporter Software Guide as imple-mented in the ewastools package [5]. Samples were grouped by sex (male/female = 1313/1442), and the number of detected Y-chromosome probes was counted for a range of p value cut-offs. A good cut-off should classify most Y-chromosome probes among females as undetected while retaining most of them among males.
Technical replicates
technical outliers that can severely impact downstream analyses. The absolute difference in methylation levels between paired measurements was compared across de-tected and undede-tected probes after QC and preprocess-ing [6]. Large outliers were defined as measurements from a pair of technical replicates with an absolute dif-ference larger than 20 percentage points, a substantial difference outside the confidence interval for the meas-urement precision of this technology [7].
EWAS setting
Finally, we evaluated the impact on downstream ana-lyses: a dataset of 732 peripheral blood samples with in-dividuals aged 14 to 94 years from a population-based cohort (GEO Accession GSE87571, [8]) was used to con-duct an EWAS with chronological age. Seven hundred twenty-nine samples passed QC. Raw fluorescence in-tensities were corrected for dye bias using the RELIC method [6], but no normalization was performed. Methylation levels of all autosomal CpG sites were regressed linearly on age, sex, leukocyte composition, and the assay performance metrics mentioned above. Methylation levels were expressed asβvalues because of their linear relation with cell proportions. Proportions of seven major leukocyte types were estimated using the al-gorithm developed by Houseman et al. [9] trained on the combination of two reference datasets of purified cell types [10, 11]. Information on the 96-well plate on which samples were allocated (and bisulfite converted) was not included as this important batch variable could not be reconstructed from GEO metadata alone.
Code to reproduce all analyses is available at doi.org/ 10.5281/zenodo.1443561, and a function to calculate de-tection p values based on non-specific fluorescence, in-cluding for minfi objects, can be found in the ewastools package (github.com/hhhh5/ewastools).
Results
Detection of Y-chromosome probes
When estimating B using Illumina’s built-in negative control probes (NEG), we evaluated potential cut-off choices ranging from 1e00 to 1e−80, and for the higher non-specific fluorescence (NSP) intensities, we evaluated cut-off choices from 1e00 to 1e−03 as they resulted in higher detection p values. Among the 416 total Y-chromosome probes on the 450K array, the conven-tional and most widely used NEG/0.01 filter resulted in a median of 172 probes (41%) called detected among samples from females, whereas a NSP/0.01 filter resulted in a much lower median of 55 probes (13%) per sample. Among samples from males, the median number de-tected was 416 (100%) and 415 (100%) for NEG/0.01 and NSP/0.01, respectively. Figure 1 shows the median number (and 2.5th and 97.5th percentiles) of detected Y-chromosome probes for all evaluated cut-offs.
Evaluating the proportion of times each Y-chromosome probe was detected (call rate) among all 1442 female sam-ples revealed very distinctive patterns depending on the chosen filter (Fig.2). When applying a more stringent fil-ter (including NSP/0.01), there was a separation between those probes called almost always detected or undetected, respectively. The former category probably represents
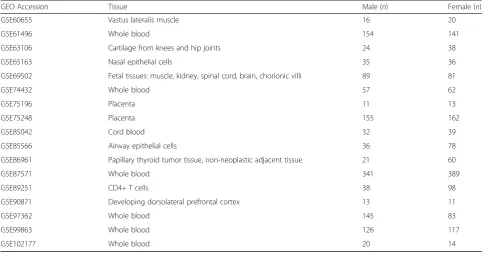
Table 1Overview of 450K Gene Expression Omnibus datasets used in the current study
GEO Accession Tissue Male (n) Female (n)
GSE60655 Vastus lateralis muscle 16 20
GSE61496 Whole blood 154 141
GSE63106 Cartilage from knees and hip joints 24 38
GSE65163 Nasal epithelial cells 35 36
GSE69502 Fetal tissues: muscle, kidney, spinal cord, brain, chorionic villi 89 81
GSE74432 Whole blood 57 62
GSE75196 Placenta 11 13
GSE75248 Placenta 155 162
GSE85042 Cord blood 32 39
GSE85566 Airway epithelial cells 36 78
GSE86961 Papillary thyroid tumor tissue, non-neoplastic adjacent tissue 21 60
GSE87571 Whole blood 341 389
GSE89251 CD4+ T cells 38 98
GSE90871 Developing dorsolateral prefrontal cortex 13 11
GSE97362 Whole blood 145 83
GSE99863 Whole blood 126 117
probes that are cross-reactive with autosomal loci, as 26 (87%) of the 30 probes with a call rate > 98% were listed by Chen et al. [12] as cross-reactive as determined by se-quence homology, whereas only 38 (14%) of the 275 probes with a call rate < 2% were. In contrast, with the
more permissive NEG/0.01 filter, only 6 of the Y-chromosome probes (none of them cross-reactive) had a call rate < 2% among females. To achieve results as strin-gent as the combination NSP/0.01 using negative control probes would require a cut-off around 1e−40, far below the previous recommendation and most stringent previ-ously considered value of 1e−16 by Lehne et al. [1]. Using more stringent criteria also led to discarding a larger pro-portion of observations among the remaining probes (evaluated in all 2755 samples): NEG/0.01 resulted in a median of 84 undetected probes per sample among all autosomal and X-chromosome probes. Switching to NSP/ 0.01 resulted in a median of 674 undetected probes per sample, approximately 0.14% of the data.
Technical replicates
Across 11 pairs of technical replicates, the median differ-ence in methylation was 1.8 pp (percentage points) among the probes deemed detected in both index sam-ple and replicate, and 9.5 pp (NEG/0.01) and 8.0 pp. (NSP/0.01) for all other pairs, respectively. Eleven thou-sand eight hundred seventy-seven probe pairs were large outliers with a difference > 20 pp, of which 743 (6%) (NEG/0.01) and 3602 (30%) (NSP/0.01) were classified as undetected in either sample, respectively.
EWAS setting
Testing the association of 473,864 autosomal CpG sites with chronological age resulted in 38,799 hits for NEG/ 0.01 and 38,847 hits for NSP/0.01, significant at the 5% level, respectively, after Bonferroni adjustment of pvalues for multiple comparisons. Forty-four hits were found only for NEG/0.01 and 92 hits were found only for NSP/0.01 while 38,755 were common to both. Importantly, both Fig. 1Choosing the right cut-off. Median number (with 2.5th and 97.5th percentiles) of detected Y-chromosome probes among 1313 male and 1442 female samples for a range of detectionpvalue cut-offs. Negative control probes were used to estimate the background noise distribution in the left panel, whereas non-specific fluorescence was used in the right panel. The cut-off 0.01 (corresponding to 2 in the left panel due to the transformedx-axis) is highlighted
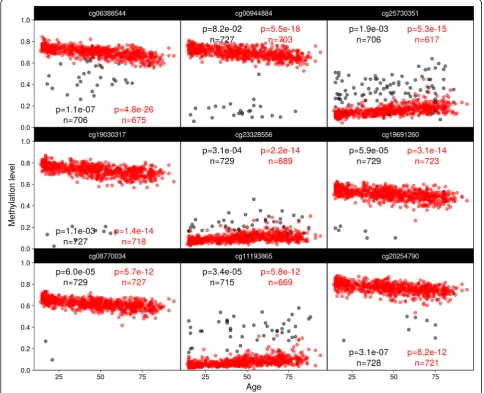
approaches only differ in which observations are deemed undetected whileβvalues of the retained observations are identical. Figure 3 shows the top nine out of the 92 hits reaching Bonferroni significance (uncorrected p values < 1.06e−07) only after applying NSP/0.01, demonstrating how even small numbers of spurious values included under current practices (NEG/0.01) contaminate the distribution of observed methylationβ values and can obfuscate even strong associations, as in some instances the statistical sig-nificance jumps many orders of magnitude (e.g., from 1.1e
−07 to 4.8e−26 for cg06388544 and from 8.2e−02 to 5.5e
−18 for cg00944884). The top nine of the 44 former hits, i.e., associations losing significance (uncorrectedpvalues < 1.06e−07 for NEG/0.01 but not NSP/0.01), are shown in Fig.4. It is unclear how many constitute either false posi-tives turned true negaposi-tives (which seems to apply to
ch.191079710R and cg24698536) or true positives turned false negatives (as it might be the case for cg08483768 or cg00193200). What is apparent however is that the change in significance is not as stark as for the opposite events.
Discussion
Background subtraction/correction is a common pre-processing step for 450K and EPIC data. Whereas some methods utilize negative control probes to estimate a background noise distribution, others employ so-called out-of-band intensities for this task [13]. Yet both show very distinct distributions: negative control probes are reportedly designed not to match the human genome (although their probe sequences are proprietary) and consequently feature very low intensities; in contrast, many probes possess some sequence similarity with
off-target loci resulting in non-specific or off-target binding, with the out-of-band intensities being on the lower side of the spectrum (yet higher than the nega-tive controls) and the set of cross-reacnega-tive probes being on the other. The argument for choosing out-of-band intensities over negative controls for background cor-rection is that the former better reflect background noise, as non-specific binding represents unwanted sig-nal as well. And indeed, while detection pvalues were so far based on a background noise distribution esti-mated from negative control probes, a recent paper proposes switching to out-of-band intensities [14]. Zhou et al. show that their approach increases preci-sion and protects against false-positive findings, e.g., genetic deletions in tumor samples being mistaken for epigenetic silencing.
Similarly to Zhou et al., we propose swapping out negative control probes for another set of probes better suited to estimate the background noise distribution. However, we recommend against using out-of-band in-tensities as these, even though of Infinium Type I design, may equally suffer from cross talk [15] just like the probes of Infinium Type II design: e.g., in the case of a completely methylated CpG site targeted with a probe of Type I design and designated to be measured in the red color channel, the high concentration of red dye (Cy5) bound to the bead targeting the methylated variant may leak into the green—here the out-of-band—color chan-nel, thereby inflating the observed intensity as we noted when comparing the out-of-band intensities of fully methylated and unmethylated probes. By restricting the set of probes used to estimate the background Fig. 4Associations losing significance. Results from a reanalysis of a previously published epigenome-wide association study. Top nine
distribution to those for which no high concentration of the opposite fluorophore is to be expected, we avoid overestimating the background fluorescence distribution due to cross talk. In addition to other implementation differences with Zhou et al., our EWAS reanalysis dem-onstrates that a more stringent filtering by detection p values can not only protect against false-positive find-ings, but against false-negative findings as well.
We recommend to utilize non-specific fluorescence to estimate the background distribution and a cut-off of 0.01 as this combination (NSP/0.01) classified most Y-chromosome probes in female samples as undetected while still calling almost all Y-chromosome probes among males. The fact that the conventional and widely used filter NEG/0.01 led to so many calls of Y-chromosome probes among females demonstrates that negative control probes do not faithfully reflect back-ground noise levels and that derived detection pvalues are therefore not accurate, which is why an extreme cut-off such as 1e−40 was necessary to achieve similarly stringent results as NSP/0.01. The NSP/0.01 filter also helped to exclude many more (30% vs. 6%) of the large outliers (> 20 pp) between technical replicates while dropping only a small fraction (0.14%) of the overall data. It has become common practice in the methylation microarray literature to drop probes and even entire samples if the number of measurements deemed un-detected exceeds a certain threshold on the grounds that such probes/samples are unreliable [16]. Such extreme measures might no longer be necessary with our pro-posed method as it provides a more stringent, but espe-cially also more accurate, assessment of detection.
Although our method improves the detection of large outliers among technical replicates, the majority of large outliers still remained: this may indicate that there are other unknown mechanisms that create such spurious values besides low fluorescence. Most probes deemed undetected showed deviations between replicates smaller than 20 pp although their median absolute difference was still much larger than among detected probes indi-cating that they should be removed as imprecise mea-sures. In our EWAS reanalysis, strong associations were revealed in probes which had a substantial proportion of observations dropped after filtering. Furthermore, with the exception of a few exposures such as smoking, effect sizes of epigenomic associations in whole blood are often very small and removing these least reliable data points may strengthen statistical power. DNA methylation microarray studies have found and validated associations with BMI [17], diabetes [18], and age, with the corre-sponding biomarkers showing effect sizes of a few per-centage points. Our reanalysis of a large EWAS of age shows that the choice of detection p value cut-off im-pacts statistical inference as unfiltered spurious values
can obfuscate even strong associations with the discov-ery of weak associations presumably being even more impeded, supporting the need for more stringent data preprocessing. It should be noted that this conclusion holds regardless of whether the associations with chronological age discovered here are genuine or the re-sult of residual confounding. However, the uncovering of new associations here comes with a tradeoff as a smaller number of sites lose significance. In some instances, this may include false positives previously driven by now dis-carded outliers, but other probes may decrease signifi-cance due to a reduced sample size. While our proposal represents an improvement and reasonable tradeoff over the current implementation of detection p values, there may be further room left to discriminate between reli-able and unrelireli-able observations.
Conclusions
A more stringent preprocessing of microarray DNA methylation data is required to filter out spurious values. We demonstrate that restricting to measurements that pass our new detection p value function greatly de-creases the prevalence of large outliers that can drive false-positive findings and can avoid false-negative find-ings. Our R package ewastools provides the necessary functions following our recommendations and is com-patible with raw .idat files orminfiprocessing pipelines.
Abbreviations
450K:Illumina Infinium HumanMethylation450 BeadChip; BMI: Body mass index; EPIC: Illumina Infinium MethylationEPIC BeadChip; EWAS: Epigenome-wide association study; GEO: Gene Expression Omnibus; NEG: Negative control probes; NSP: Non-specific fluorescence; QC: Quality control
Acknowledgements
Not applicable
Funding
This work was supported by NIH grants R00ES023450 and P30ES023515.
Availability of data and materials
Fully reproducible code is available atdoi.org/10.5281/zenodo.1443561. Only publicly available DNA methylation datasets were used.
Authors’contributions
JAH performed the analyses. Both authors wrote and approved the final manuscript.
Ethics approval and consent to participate
Not applicable
Consent for publication
Not applicable
Competing interests
The authors declare that they have no competing interests.
Publisher’s Note
Received: 5 October 2018 Accepted: 11 January 2019
References
1. Lehne B, Drong AW, Loh M, Zhang W, Scott WR, Tan S-T, et al. A coherent approach for analysis of the Illumina HumanMethylation450 BeadChip improves data quality and performance in epigenome-wide association studies. Genome Biol [Internet]. 2015;16 Available from:https://doi.org/10. 1186/s13059-015-0600-x.
2. Bibikova M, Barnes B, Tsan C, Ho V, Klotzle B, Le JM, et al. High density DNA methylation array with single CpG site resolution. Genomics. 2011;98:288–95. 3. Aryee MJ, Jaffe AE, Corrada-Bravo H, Ladd-Acosta C, Feinberg AP, Hansen
KD, et al. Minfi: a flexible and comprehensive Bioconductor package for the analysis of Infinium DNA methylation microarrays. Bioinformatics. 2014;30: 1363–9.
4. Dedeurwaerder S, Defrance M, Calonne E, Denis H, Sotiriou C, Fuks F. Evaluation of the Infinium Methylation 450K technology. Epigenomics. 2011; 3:771–84.
5. Heiss JA, Just AC. Identifying mislabeled and contaminated DNA methylation microarray data: an extended quality control toolset with examples from GEO. Clin Epigenetics. 2018;10:73.
6. Xu Z, Langie SAS, De Boever P, Taylor JA, Niu L. RELIC: a novel dye-bias correction method for Illumina Methylation BeadChip. BMC Genomics. 2017;18:4. 7. Bibikova M, Le J, Barnes B, Saedinia-Melnyk S, Zhou L, Shen R, et al.
Genome-wide DNA methylation profiling using Infinium® assay. Epigenomics. 2009;1:177–200.
8. Ahsan M, Ek WE, Rask-Andersen M, Karlsson T, Lind-Thomsen A, Enroth S, et al. The relative contribution of DNA methylation and genetic variants on protein biomarkers for human diseases. PLoS Genet. 2017;13:e1007005. 9. Houseman EA, Accomando WP, Koestler DC, Christensen BC, Marsit CJ, Nelson HH, et al. DNA methylation arrays as surrogate measures of cell mixture distribution. BMC Bioinformatics. 2012;13:86.
10. de Goede OM, Razzaghian HR, Price EM, Jones MJ, Kobor MS, Robinson WP, et al. Nucleated red blood cells impact DNA methylation and expression analyses of cord blood hematopoietic cells. Clin Epigenetics. 2015;7:95. 11. Bakulski KM, Feinberg JI, Andrews SV, Yang J, Brown S, L McKenney S, et al.
DNA methylation of cord blood cell types: applications for mixed cell birth studies. Epigenetics. 2016;11:354–62.
12. Chen Y-A, Lemire M, Choufani S, Butcher DT, Grafodatskaya D, Zanke BW, et al. Discovery of cross-reactive probes and polymorphic CpGs in the Illumina Infinium HumanMethylation450 microarray. Epigenetics. 2013;8:203–9. 13. Triche TJ, Weisenberger DJ, Van Den Berg D, Laird PW, Siegmund KD.
Low-level processing of Illumina Infinium DNA Methylation BeadArrays. Nucleic Acids Res. 2013;41:e90.
14. Zhou W, Triche TJ, Laird PW, Shen H. SeSAMe: reducing artifactual detection of DNA methylation by Infinium BeadChips in genomic deletions. Nucleic Acids Res [Internet]. 2018; Available from:https://doi.org/10.1093/nar/ gky691. [cited 11 Sept 2018].
15. Timlin JA. Scanning microarrays: current methods and future directions. Methods Enzymol. 2006;411:79–98. https://doi.org/10.1016/S0076-6879(06)11006-X
16. Felix JF, Joubert BR, Baccarelli AA, Sharp GC, Almqvist C, Annesi-Maesano I, et al. Cohort Profile: Pregnancy And Childhood Epigenetics (PACE) Consortium. Int J Epidemiol. 2018;47:22–3u.
17. Demerath EW, Guan W, Grove ML, Aslibekyan S, Mendelson M, Zhou Y-H, et al. Epigenome-wide association study (EWAS) of BMI, BMI change and waist circumference in African American adults identifies multiple replicated loci. Hum Mol Genet. 2015;24:4464–79.