ORIGINAL ARTICLE
Expression and clinical value
of programmed cell death-ligand 1 (PD-L1)
in diffuse large B cell lymphoma: a retrospective
study
Li‑Yang Hu
1,2,3†, Xiao‑Lu Xu
1,2†, Hui‑Lan Rao
1,4, Jie Chen
5,6, Ren‑Chun Lai
1,7, Hui‑Qiang Huang
1,2, Wen‑Qi Jiang
1,2,
Tong‑Yu Lin
1,2, Zhong‑Jun Xia
1,8and Qing‑Qing Cai
1,2*Abstract
Background: The programmed cell death‑1 (PD‑1)/programmed cell death‑ligand 1 (PD‑L1) pathway inhibits the activation of T cells and plays a crucial role in the negative regulation of cellular and humoral immune responses. Diffuse large B‑cell lymphoma (DLBCL) is the most common lymphoid malignancy in adults. In the present study, we aimed to detect the expression of PD‑L1 in DLBCL and to analyze its relationship with prognosis.
Methods: We reviewed medical records of 204 newly diagnosed DLBCL patients in Sun Yat‑sen University Cancer Center between October 2005 and August 2012. The expression of PD‑L1 in tumor tissues from these 204 patients was detected using immunohistochemical (IHC) assay. The expression of anaplastic lymphoma kinase (ALK), CD5, CD30, and C‑Myc in tumor specimens from 109 patients was detected using IHC, and Epstein–Barr virus (EBV)‑ encoded RNAs (EBERs) were detected using fluorescence in situ hybridization. The Spearman method was used for correlation analysis. The Kaplan–Meier method with log‑rank test was used for univariate analysis. Cox proportional hazards model was used for multivariate analysis.
Results: Of the 204 patients, 100 (49.0%) were PD‑L1‑positive in tumor cells and 44 (21.6%) were PD‑L1‑positive in tumor microenvironment. PD‑L1 expression in tumor cells and tumor microenvironment were more common in the non‑germinal center B‑cell‑like (GCB) subtype than in the GCB subtype (P= 0.02 and P= 0.04). Patients with PD‑L1 expression in tumor microenvironment were more likely to be resistant to first‑line chemotherapy when compared with the patients without PD‑L1 expression in tumor microenvironment (P= 0.03). PD‑L1 expression in tumor micro‑ environment was negatively correlated with C‑Myc expression (r=− 0.20, P= 0.04). No correlations were detected between PD‑L1 expression and the expression of ALK, CD5, and CD30 as well as EBERs. The 5‑year overall survival (OS) rates were 50.0% and 67.3% in patients with and without PD‑L1 expression in tumor cells (P= 0.02). PD‑L1 expression in tumor cells was an independent risk predictor for OS (P < 0.01).
Conclusions: PD‑L1 expression is more common in the non‑GCB subtype than in the GCB subtype. PD‑L1 expres‑ sion in tumor microenvironment has a negative correlation with C‑Myc. PD‑L1 positivity predicts short survival in DLBCL patients. For patients with PD‑L1 expression, more strategy such as anti‑PD‑L1 antibody treatment should be recommended.
© The Author(s) 2017. This article is distributed under the terms of the Creative Commons Attribution 4.0 International License (http://creativecommons.org/licenses/by/4.0/), which permits unrestricted use, distribution, and reproduction in any medium, provided you give appropriate credit to the original author(s) and the source, provide a link to the Creative Commons license, and indicate if changes were made. The Creative Commons Public Domain Dedication waiver (http://creativecommons.org/ publicdomain/zero/1.0/) applies to the data made available in this article, unless otherwise stated.
Open Access
*Correspondence: [email protected]
†Li‑Yang Hu and Xiao‑Lu Xu contributed equally to this work 1 State Key Laboratory of Oncology in South China, Collaborative
Innovation Center of Cancer Medicine, Sun Yat‑sen University Cancer Center, Guangzhou 510060, Guangdong, P. R. China
Background
Programmed cell death-ligand 1 (PD-L1), a member of the B7 family (also known has B7-H1), is an inhibi-tory ligand expressed on the surface of macrophages, dendritic cells, fibroblasts, and T cells [1, 2]. Binding of PD-L1 to its receptor, programmed cell death 1 (PD-1), inhibits cytokine production and cell cycle progression of T cells [3–5]. It functions as an important checkpoint in the regulation of cellular and humoral immune responses [6]. Adaptive immune responses that include PD-1/ PD-L1 expression are associated with cancer relapse [7]. PD-1/PD-L1 is an important axis that has important roles in the infiltration of various immune effectors and in the propensity to develop metastatic disease. Recent evidence suggests that activation of the PD-1/PD-L1 pathway represents one mechanism that allows tumors to elude the host immune system [8]. Previous studies have reported that PD-L1 is involved in the negative regula-tion of immune responses by binding to the PD-1 recep-tor and results in cancer cells evading the host immune surveillance and the promotion of metastasis [9].
Aberrant PD-L1 expression was reported in a number of human malignancies [1, 7, 10]. Evidence suggests that PD-L1 expression is associated with prognosis of cer-tain types of cancers [11–16]. The PD-1/PD-L1 axis has attracted wide attention in the treatment of cancers such as lymphoma [17–19]. It has been proposed that immu-notherapy can be combined with targeted therapy [4, 6]. Therapeutic PD-1/PD-L1 checkpoint inhibitors target the PD-1/PD-L1 immune checkpoint to restore the cancer cell-directed immune response [2, 20, 21]. Monoclonal antibodies directed against the PD-1/PD-L1 axis have shown clinical activity in several solid tumors including ovarian cancer [21], melanoma [22], renal cell carcinoma [23, 24], lung cancer [25], and colorectal cancer [26]. The use of a signaling inhibitor to reduce PD-L1 expression together with anti-PD-1 antibodies showed a promising durable effect against malignant diseases [27, 28].
As a group of heterogeneous diseases, diffuse large B-cell lymphoma (DLBCL) can be divided into different clinical and pathological subtypes as well as molecular and immunophenotypic subgroups [29, 30]. Anaplas-tic lymphoma kinase (ALK) [31], CD5 [32], CD30 [33], C-Myc [34], and Epstein–Barr virus (EBV)-encoded RNAs (EBERs) [35] are all important markers expressed in DLBCL that may predict prognosis. PD-L1 is also expressed on DLBCL tumor cells and tumor-infiltrating non-malignant cells, primarily macrophages [36]. Mac-rophages constitute a major source of PD-L1 expression
in the tumor microenvironment of lymphomas. Interac-tions between tumor cells and the immune system are critical in defining disease biology in B-cell lymphomas [37, 38].
It is suggested that coordinate regulation of PD-L1 among tumor cells and tumor-infiltrating macrophages may exist [36]. Research revealed that in B-cell malignan-cies, the tumor microenvironment releases survival and proliferation signals and contributes to disease progres-sion, drug resistance, and disease relapse [39]. The PD-1/ PD-L1 signaling axis plays a critical role in patients with a large amount of tumor-infiltrating macrophages and is related with an inferior clinical outcome through the sup-pression of anti-tumor immunity [36].
Several studies have reported the expression of PD-L1 in lymphoma and described its relationship with progno-sis [5, 40, 41]. However, similar studies on PD-L1 expres-sion in DLBCL in China are rare. The clinicopathological characteristics of PD-L1-positive DLBCL patients are still controversial. In the present study, we retrospectively assessed the expression of PD-L1 in DLBCL tissues and analyzed its association with clinicopathological features and prognosis of patients with DLBCL.
Patients and methods Patient selection
Clinical data were collected from the database of the Department of Medical Oncology, Sun Yat-sen Univer-sity Cancer Center (Guangzhou, China).
The inclusion criteria were as follows: (1) patients with newly diagnosed DLBCL treated at the Sun Yat-sen University Cancer Center between October 2005 and August 2012; (2) patients were diagnosed using biopsy according to the 2001 or 2008 World Health Organiza-tion classificaOrganiza-tion; (3) patients were 18 years of age or older; (4) patients had received first-line chemotherapy regimens, such as R-CHOP (rituximab, cyclophos-phamide, doxorubicin, vincristine, and prednisone) or R-CHOP-like regimen, CHOP (cyclophosphamide, doxorubicin, vincristine, and prednisone) or CHOP-like regimen, and MA regimen (high-dose methotrex-ate and cytarabine) with curative intent; (5) patients were not infected with human immunodeficiency virus and were not with immunodeficiency disease or second tumor; and (6) complete clinical information was avail-able, including follow-up data. The Ann-Arbor stag-ing system and the international prognostic index (IPI) were used for staging evaluation and risk stratification respectively.
Immunohistochemical assay
All tumor specimens were obtained by biopsy or primary tumor resection before chemotherapy, fixed in 10% buff-ered formaldehyde, and embedded in paraffin. The 5-μm thick, formalin-fixed, and paraffin-embedded sections were mounted on slides. Slides were deparaffinized in a microwave oven with xylene, then washed using alcohol washes of decreasing concentrations (e.g., 100%, 95%, 80%, 50%) and distilled water. A heat-induced antigen retrieval method was used with sodium citrate buffer solution (pH 8.0). Rabbit monoclonal antibody for PD-L1 (1:50 dilution) was from Cell Signaling Technology (Bos-ton, MA, USA). Mouse monoclonal antibody for other markers assessed in the present study, including ALK (1:50 dilution), CD5 (1:100 dilution), CD30 (1:50 dilu-tion), C-Myc (1:50 diludilu-tion), were from Zhongshan Jin-qiao Biotechnology (Beijing, China).
Slides were incubated with primary antibodies at 37 °C for 50 min, incubated with secondary antibody at 37 °C for 30 min, and counterstained with hematoxylin. Next, the slides were dehydrated and covered as per routine laboratory protocols. Two independent pathologists reviewed all specimens separately, and a common con-sensus was reached in all cases. Cases with any tumor cells expressing CD5 or ALK were considered CD5- or ALK-positive; cases with at least 30% of tumor cells expressing C-Myc were considered C-Myc-positive; cases with at least 20% of tumor cells expressing CD30 were considered CD30-positive. Cases with at least 5% of lymphoma cells showing distinct membranous and/ or cytoplasmic staining of L1 were considered PD-L1-positive in tumor cells. Cases with at least 20% of all cells (malignant and non-malignant cells) expressing PD-L1 were considered PD-L1-positive in tumor micro-environment. The results of BCL2 and BCL6 expression were collected from clinical records of the patients.
Fluorescence in situ hybridization
EBERs were detected using the peptide nucleic acid fluo-rescence in situ hybridization detection kit (Zhongshan Jinqiao) following the manufacturer’s protocol. When at least 10% of cells were stained in the nuclei, the case was defined as EBV-positive.
Follow‑up
After treatment, patients were followed up every 3 months in the first 3 years and every 6 months there-after. The final date of follow-up was March 31st, 2016. Routine examinations including physical examina-tion, standard laboratory tests, echocardiography, and a whole-body computed tomography (CT) scan or fluoro-deoxyglucose positron emission tomography (FDG-PET) were performed during follow-up. Overall survival (OS)
was defined as the duration from pathological diagnosis to death or the last follow-up. Progression-free survival (PFS) was defined as the duration from pathological diag-nosis to death, disease progression, or the last follow-up. Patients without any event at the last visit were censored.
Statistical analysis
Chi square test or Fisher’s exact test was used to analyze the relationship between PD-L1 expression in tumor cells/tumor microenvironment and clinicopathologi-cal characteristics of DLBCL patients. Pearson’s test was used to analyze the correlation between indexes. The Kaplan–Meier method was used to establish survival curves, and log-rank test was used for univariate analy-ses. The Cox proportional hazards model was used for multivariate analysis. All statistical analyses used 0.05 as the significance level (two-sided test) and were per-formed by using SPSS version 19.0 (IBM, Armonk, NY, USA).
Results
Patient characteristics
Clinical data of 204 patients with DLBCL were included in our analysis. The detailed baseline characteris-tics according to PD-L1 expression in tumor cells and tumor microenvironment are shown in Table 1. Among these patients, 115 (56.4%) were male, and 89 (43.6%) were female. The median age was 52 years (range 18–86 years). One hundred and one (49.5%) patients received R-CHOP/R-CHOP-like regimen as first-line treatment, 97 (47.5%) patients received CHOP/ CHOP-like regimen, and 6 (2.9%) patients with cen-tral nervous system involvement received high-dose methotrexate and cytarabine. The median number of chemotherapy cycles was 6 (range 1–9). Overall, 104 (51.0%) patients had advanced stage (stages III and IV) disease; 61 (29.9%) had GCB subtype, and 138 (67.6%) had non-GCB-subtype disease. There were 100 (49.0%) patients with PD-L1 expression in tumor cells and 44 (21.6%) with PD-L1 expression in tumor microenviron-ment. With a median follow-up of 52 months (range 1–114 months), 98 (48.0%) patients experienced disease progression or died.
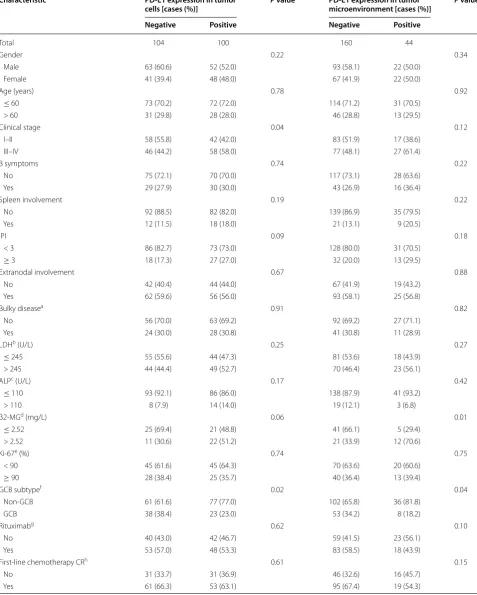
Table 1 Clinicopathological characteristics of 204 patients with diffuse large B-cell lymphoma (DLBCL) according to the expression of programmed cell death-ligand 1 (PD-L1) in tumor cells and tumor microenvironment
Characteristic PD‑L1 expression in tumor
cells [cases (%)] P value PD‑L1 expression in tumor microenvironment [cases (%)] P value
Negative Positive Negative Positive
Total 104 100 160 44
Gender 0.22 0.34
Male 63 (60.6) 52 (52.0) 93 (58.1) 22 (50.0)
Female 41 (39.4) 48 (48.0) 67 (41.9) 22 (50.0)
Age (years) 0.78 0.92
≤ 60 73 (70.2) 72 (72.0) 114 (71.2) 31 (70.5)
> 60 31 (29.8) 28 (28.0) 46 (28.8) 13 (29.5)
Clinical stage 0.04 0.12
I–II 58 (55.8) 42 (42.0) 83 (51.9) 17 (38.6)
III–IV 46 (44.2) 58 (58.0) 77 (48.1) 27 (61.4)
B symptoms 0.74 0.22
No 75 (72.1) 70 (70.0) 117 (73.1) 28 (63.6)
Yes 29 (27.9) 30 (30.0) 43 (26.9) 16 (36.4)
Spleen involvement 0.19 0.22
No 92 (88.5) 82 (82.0) 139 (86.9) 35 (79.5)
Yes 12 (11.5) 18 (18.0) 21 (13.1) 9 (20.5)
IPI 0.09 0.18
< 3 86 (82.7) 73 (73.0) 128 (80.0) 31 (70.5)
≥ 3 18 (17.3) 27 (27.0) 32 (20.0) 13 (29.5)
Extranodal involvement 0.67 0.88
No 42 (40.4) 44 (44.0) 67 (41.9) 19 (43.2)
Yes 62 (59.6) 56 (56.0) 93 (58.1) 25 (56.8)
Bulky diseasea 0.91 0.82
No 56 (70.0) 63 (69.2) 92 (69.2) 27 (71.1)
Yes 24 (30.0) 28 (30.8) 41 (30.8) 11 (28.9)
LDHb (U/L) 0.25 0.27
≤ 245 55 (55.6) 44 (47.3) 81 (53.6) 18 (43.9)
> 245 44 (44.4) 49 (52.7) 70 (46.4) 23 (56.1)
ALPc (U/L) 0.17 0.42
≤ 110 93 (92.1) 86 (86.0) 138 (87.9) 41 (93.2)
> 110 8 (7.9) 14 (14.0) 19 (12.1) 3 (6.8)
β2‑MGd (mg/L) 0.06 0.01
≤ 2.52 25 (69.4) 21 (48.8) 41 (66.1) 5 (29.4)
> 2.52 11 (30.6) 22 (51.2) 21 (33.9) 12 (70.6)
Ki‑67e (%) 0.74 0.75
< 90 45 (61.6) 45 (64.3) 70 (63.6) 20 (60.6)
≥ 90 28 (38.4) 25 (35.7) 40 (36.4) 13 (39.4)
GCB subtypef 0.02 0.04
Non‑GCB 61 (61.6) 77 (77.0) 102 (65.8) 36 (81.8)
GCB 38 (38.4) 23 (23.0) 53 (34.2) 8 (18.2)
Rituximabg 0.62 0.10
No 40 (43.0) 42 (46.7) 59 (41.5) 23 (56.1)
Yes 53 (57.0) 48 (53.3) 83 (58.5) 18 (43.9)
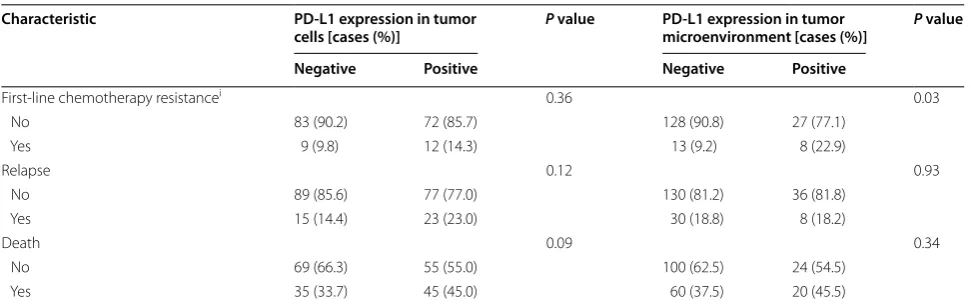
First‑line chemotherapy CRh 0.61 0.15
No 31 (33.7) 31 (36.9) 46 (32.6) 16 (45.7)
Relationship of PD‑L1 with clinicopathologic characteristics
PD-L1 expression in tumor cells was associated with the non-GCB subtype (P = 0.02). PD-L1 expression in tumor microenvironment was associated with the non-GCB subtype (P = 0.04), elevated β2-MG level (P = 0.01), and resistance to first-line chemotherapy (P = 0.03). The expression level of PD-L1 in tumor microenviron-ment had a negative correlation with that of C-Myc (r = − 0.20, P = 0.04). No correlation of the expression level of PD-L1 in tumor cells with that of C-Myc was observed. There was no significant association of PD-L1 expression in either tumor cells or microenvironment with CD5, CD30, C-Myc, and EBERs.
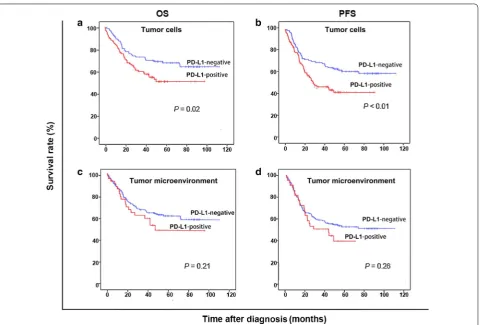
Survival analysis
The 5-year OS rate was 59.5%, and the 5-year PFS rate was 50.0% for the 204 DLBCL patients. Patients with PD-L1 expression in tumor cells had significantly lower 5-year OS rate (50.0% vs. 67.3%, P = 0.02) and 5-year PFS rate (39.6% vs. 59.6%, P = 0.01) than did patients without PD-L1 expression in tumor cells; the 5-year OS and PFS rates were similar between patients with and without PD-L1 expression in tumor microenvironment (Fig. 1).
Univariate analysis showed that age of older than 60, stage III–IV disease, with B symptoms, with spleen
involvement, IPI no less than 3, serum lactate dehydroge-nase (LDH) level higher than 245 U/L, failure to achieve complete remission (CR) after first-line chemotherapy, and PD-L1 expression in tumor cells were significantly associated with short OS and PFS; β2-MG level higher than 2.52 mg/L and lack of rituximab treatment were only significantly associated with short OS (Table 2). Factors that were significant in univariate analysis were included in the multivariate analysis.
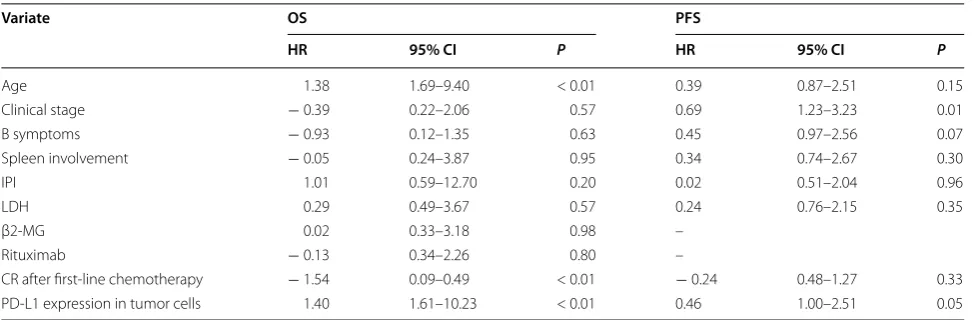
In multivariate analyses, age [hazard ratio (HR) 1.38; 95% confidence interval (CI) 1.69–9.40; P < 0.01], CR after first-line chemotherapy (HR − 1.54; 95% CI 0.09–
0.49; P < 0.01), and PD-L1 expression in tumor cells (HR 1.40; 95% CI 1.61–10.23; P < 0.01) were independ-ent risk factors for OS; stage (HR 0.69; 95% CI 1.23–3.23;
P = 0.01) was an independent predictor for PFS (Table 3).
Discussion
In the present study, we investigated the expression of PD-L1 in tumor cells and in tumor microenviron-ment in DLBCL patients. PD-L1 expression in tumor cells was significantly associated with poor prognosis. We also found that PD-L1 expression in tumor micro-environment was associated with resistance to first-line chemotherapy and the expression level of PD-L1 in tumor microenvironment was negatively correlated with that of C-Myc. Furthermore, the non-GCB subtype was
IPI international prognostic index, LDH lactate dehydrogenase, ALP anaplastic lymphoma kinase, β2-MG β2-microglobulin, GCB germinal center B-cell-like, CR
complete remission
a The data of 33 patients were missing b The data of 12 patients were missing c The data of 3 patients were missing d The data of 125 patients were missing e The data of 61 patients were missing f The data of 5 patients were missing g The data of 21 patients were missing h The data of 28 patients were missing i The data of 28 patients were missing
Table 1 continued
Characteristic PD‑L1 expression in tumor
cells [cases (%)] P value PD‑L1 expression in tumor microenvironment [cases (%)] P value
Negative Positive Negative Positive
First‑line chemotherapy resistancei 0.36 0.03
No 83 (90.2) 72 (85.7) 128 (90.8) 27 (77.1)
Yes 9 (9.8) 12 (14.3) 13 (9.2) 8 (22.9)
Relapse 0.12 0.93
No 89 (85.6) 77 (77.0) 130 (81.2) 36 (81.8)
Yes 15 (14.4) 23 (23.0) 30 (18.8) 8 (18.2)
Death 0.09 0.34
No 69 (66.3) 55 (55.0) 100 (62.5) 24 (54.5)
associated with PD-L1 expression in either tumor cells or tumor microenvironment.
PD-L1 expression in B-cell lymphomas is uncommon [15]. Generally, low-grade B-cell lymphoproliferative dis-orders are thought to rarely express PD-L1 [14]. Never-theless, it was also reported that follicular lymphoma and DLBCL involved several immune escape pathways, sug-gesting that escape from antitumor immunity was essen-tial in these aggressive lymphomas [42]. Efforts have been made to identify biomarkers of a response to immune checkpoint blockade, in order to identify the subsets of patients who are most likely to benefit from immune checkpoint blockade treatment. Currently, no biomarkers are generally recognized. In the present study, PD-L1 was found to be an independent predictor for OS and the non-GCB subtype was associated with PD-L1 expression in either tumor cells or tumor microenvironment. Besides, PD-L1 expression in tumor cells were associated with high β2-MG and advanced stage, demonstrating its role as an adverse prognostic factor in DLBCL. In another study,
cells and at least 20% of malignant and non-malignant cells with PD-L1 expression for PD-L1 positivity in tumor microenvironment, conforming to the cut-point used in a previous publication [14]. We observed that 49.0% of patients were PD-L1-positive in tumor cells and 21.6% were PD-L1-positive in tumor microenvironment, which were comparable with those observed in a previous study [42]. Several researchers analyzed the expression of PD-L1 in tumor cells and tumor microenvironment in DLBCL using other standards. Kiyasu et al. [5] defined PD-L1 positivity in tumor cells as over 30% of lym-phoma cells staining of both PD-L1 and paired box gene 5 (PAX5); when PD-L1-positive non-malignant stromal
cells constituted over 20% of the total tissue from patients without PD-L1 expression in tumor cells, the sample was considered PD-L1-positive in tumor microenvironment. In their study, PD-L1 positivity in tumor cells and tumor microenvironment were observed in 10.5% and 15.3% of DLBCL patients. The higher rates of PD-L1 expression in tumor cells and tumor microenvironment in our cohorts may due to the race and different experimental stand-ards. Fang et al. [43] detected the expression of PD-L1 in tumor tissues from 76 Chinese DLBCL patients and found that PD-L1 was expressed in tumor cells in 26.3% of patients. The smaller sample size in their study may explain the discrepancy.
Table 2 Univariate analysis of prognostic factors for overall survival (OS) and progression-free survival (PFS) of patients with DLBCL
IPI international prognostic index, LDH lactate dehydrogenase, β2-MG β2-microglobulin, CR complete remission, PD-L1 programmed cell death-ligand 1
Variable 5‑year OS rate (%) P value 5‑year PFS rate (%) P value
Age (years) < 0.01 0.02
≤ 60 66.7 54.7
> 60 42.1 38.8
Clinical stage < 0.01 < 0.01
I–II 68.2 61.7
III–IV 50.7 38.4
B symptoms 0.02 < 0.01
No 63.8 54.2
Yes 48.7 38.7
Spleen involvement 0.01 < 0.01
No 62.4 53.0
Yes 41.8 31.4
IPI < 0.01 < 0.01
< 3 64.4 55.6
≥ 3 41.9 29.6
LDH (U/L) < 0.01 < 0.01
≤ 245 72.7 60.1
> 245 46.2 39.0
β2‑MG (mg/L) < 0.01 0.07
≤ 2.52 73.2 54.6
> 2.52 42.2 35.7
Rituximab 0.04 0.20
Without 53.1 46.4
With 71.9 58.4
First‑line chemotherapy CR < 0.01 0.04
No 49.1 45.9
Yes 72.2 57.2
PD‑L1 expression in tumor cells 0.02 0.01
Negative 67.3 59.6
Positive 50.0 39.6
PD‑L1 expression in tumor microenvironment 0.21 0.26
Negative 62.0 52.5
In the present study on 204 DLBCL patients, PD-L1 expression in tumor cells was an independent risk factor for OS (HR 1.40; 95% CI 1.61–10.23; P < 0.01), but not for PFS (HR 0.46; 95% CI 1.00–2.51; P = 0.05), in
multivari-ate analysis. These results were in accordance with the findings by Kiyasu et al. [5]. Interestingly, using higher expression levels as cutoff threshold, such as over 30% of lymphoma cells expressing both PD-L1 and PAX5 used by Kiyasu et al. [5] and Xing et al. [44], is more accurate in prognostic prediction than other cutoff values in their studies. In the present study, the differences in survivals could also be distinguished using a cutoff threshold of 5%. Xing et al. [44] retrospectively analyzed data of 84 EBV-negative DLBCL patients and found that patients with PD-L1 expression in tumor cells had a higher pro-portion of non-GCB-subtype disease than those with-out PD-L1 expression (71% vs. 30%, P = 0.0060). In the
present study, PD-L1 expression in tumor cells and in microenvironment were associated with the non-GCB subtype (P = 0.02 and 0.04), which typically indicated a
poor overall prognosis. The mechanisms responsible for the relationship between PD-L1 expression and poor prognosis are still not clear. In classical Hodgkin’s lym-phoma, 9p24.1 amplification [45] and EBV infection [41] are thought to be related to the overexpression of PD-L1. Another study suggested that genetic alterations affecting the PD-L1/PD-L2 locus might lead to the overexpression of PD-L1 [46]. Several studies reported that ABC-subtype DLBCL prominently expressed both PD-L1 and PD-L2 [36, 47, 48]. Genes/pathways expressed in non-GCB-sub-type DLBCL showed similarity to those in ABC-subnon-GCB-sub-type DLBCL [49], and the activation of Janus kinase (JAK)/ signal transduction and activation of transcription factor 3 (STAT3) signaling might favor the constitutive expres-sion of PD-L1 [50]. This phenomenon suggests that
immunotherapies blocking PD-1 and PD-L1 or targeting the JAK/STAT3 signaling pathway may benefit patients with this aggressive subtype of disease.
PD-L1 positivity in tumor microenvironment was found to be associated with resistance to first-line chem-otherapy in the present study. The composition and func-tion of tumor microenvironment is an important factor for both immune escape of tumors and antitumoral defense [51]. PD-L1 is known to interact with CD80. CD80 expressed on activated T cells [and possibly anti-gen-presenting cells (APCs)] can function as a receptor rather than a ligand, delivering inhibitory signals when engaged by PD-L1 [52]. Understanding such complex receptor-ligand interactions in tumor microenvironment will be required to reveal potential immune checkpoint resistance mechanisms [53]. It is possible that small T-cell clones are more important than large T-cell clones in tumor response once effective chemotherapy regi-mens have significantly debulked the initial tumor load in DLBCL patients [54]. In DLBCL, IHC analysis of tis-sue biopsies has revealed an association between T-cell infiltration and response to chemotherapy [53]. High CD4+ T-cell infiltration has been associated with long OS in DLBCL patients treated with both anthracycline-based regimens and R-CHOP chemoimmunotherapy [55, 56]. Curiel et al. [57] reported that tumor-infiltrating PD-L1-positive myeloid dendritic cells (MDCs) sup-pressed the induction of interferon-gamma (IFN-γ) in T cells and reduced IFN-γ-positive T cells, indicating that PD-L1-positive MDCs induce T-cell immune suppres-sion in tumor microenvironment. Therefore, the number of PD-L1-positive tumor-infiltrating lymphocytes (TILs) was lower in DLBCL patients with PD-L1 expression tumor microenvironment, which may be due to the sup-pression of T-cell induction by PD-L1-positive MDCs in Table 3 Multivariate analysis of prognostic factors for OS and PFS of patients with DLBCL
IPI international prognostic index, LDH lactate dehydrogenase, β2-MG β2-microglobulin, CR complete remission, PD-L1 programmed cell death ligand 1, – not included
Variate OS PFS
HR 95% CI P HR 95% CI P
Age 1.38 1.69–9.40 < 0.01 0.39 0.87–2.51 0.15
Clinical stage − 0.39 0.22–2.06 0.57 0.69 1.23–3.23 0.01
B symptoms − 0.93 0.12–1.35 0.63 0.45 0.97–2.56 0.07
Spleen involvement − 0.05 0.24–3.87 0.95 0.34 0.74–2.67 0.30
IPI 1.01 0.59–12.70 0.20 0.02 0.51–2.04 0.96
LDH 0.29 0.49–3.67 0.57 0.24 0.76–2.15 0.35
β2‑MG 0.02 0.33–3.18 0.98 –
Rituximab − 0.13 0.34–2.26 0.80 –
CR after first‑line chemotherapy − 1.54 0.09–0.49 < 0.01 − 0.24 0.48–1.27 0.33
tumor microenvironment. High number of PD-L1-pos-itive cells in tumor microenvironment could shield the tumor against attacking TILs [51]. These may be the pos-sible mechanisms underlying why and how PD-L1 posi-tivity in tumor microenvironment impact the treatment resistance.
In the present study, we found that PD-L1 expression in tumor microenvironment had a negative correlation with that of C-Myc (r = − 0.20, P = 0.04). C-Myc is a known oncogene in DLBCL. C-Myc gene translocation is a hall-mark of Burkitt lymphoma and was detected in 5%–17% of DLBCL patients [58]. C-Myc aberrations include gene translocation, gene amplification, and mRNA or protein overexpression. Duranpanteix et al. [59] investigated the role of C-Myc in the regulation of PD-L1 expression in the P493-6 B cell line. They found that the inhibition of C-Myc expression by tetracycline led to an increase in
PD-L1 mRNA expression. The regulatory region of PD-L1
gene does not contain a binding site for C-Myc, whereas
STAT1 and interferon regulatory factor 1 (IRF1) directly bind to the promoter of PD-L1 gene to increase its tran-scription, suggesting that C-Myc would repress PD-L1
expression at the mRNA level via STAT1 inhibition [59]. The mechanism of the relationship between C-Myc and PD-L1 expression in tumor environment in the present study needs to be further explored. Casey et al. [60] have shown that C-Myc regulated the antitumor immune response through binding the promoter region and acti-vating the transcription of CD47 and PD-L1, and C-Myc
appeared to initiate and maintain tumorigenesis in a mouse model of Myc-induced T-cell acute lymphoblastic leukemia. Inactivation of Myc could result in the down-regulation of PD-L1, thus restoring recruitment of T cells and macrophages and causing tumor shrinkage. Besides, Rossille et al. [61] showed that patients with high levels of serum PD-L1 had a significantly shorter OS than those with low levels of serum PD-L1 within the BCL2-positive population. Therefore, in Myc-driven malignancies or even high-grade B-cell lymphomas, especially in those with Myc rearrangement, such as double-hit or triple-hit lymphomas, Myc- and PD-L1-targeted combination ther-apy may be of potential therapeutic benefit.
Several limitations should be noted when interpreting the results of the present work. As a retrospective study, the long time span for the storage of paraffin-embedded samples may affect the results of PD-L1 detection. The missing clinical data may also affect the accuracy of sta-tistical analysis. Therefore, a study with a larger popula-tion is needed to verify our findings. It remains unclear whether the expression of PD-L1 is a key factor asso-ciated with the clinical prognosis of DLBCL patients treated with PD-1/PD-L1 blockade therapy. Further
integration of genomic and clinical data is expected to deepen our understanding of PD-L1 in DLBCL.
Conclusions
In conclusion, the expression of PD-L1 in both tumor cells and microenvironment is associated with the non-GCB-subtype DLBCL. PD-L1 expression in tumor microenvironment has a negative correlation with the expression of C-Myc, which indicates a role of C-Myc in the regulation of PD-L1 expression. PD-L1 predicts short survival in DLBCL patients. For patients with PD-L1 expression in tumor cells, more strategy such as anti-PD-L1 antibody treatment should be recommended.
Abbreviations
PD‑L1: programmed cell death‑ligand 1; DLBCL: diffuse large B‑cell lymphoma; ALK: anaplastic lymphoma kinase; EBERs: EBV‑encoded RNAs; FISH: fluores‑ cence in situ hybridization; OS: overall survival.
Authors’ contributions
LYH, XLX, and HLR designed the research, collected data and wrote the paper; JC and RCL analyzed data and critically reviewed the paper; RCL and ZJX per‑ formed clinical follow‑up of the patients; WQJ, HQH, TYL, and QQC supervised the study and critically reviewed the paper. All authors read and approved the final manuscript.
Author details
1 State Key Laboratory of Oncology in South China, Collaborative Innovation
Center of Cancer Medicine, Sun Yat‑sen University Cancer Center, Guang‑ zhou 510060, Guangdong, P. R. China. 2 Department of Medical Oncology,
Sun Yat‑sen University Cancer Center, Guangzhou 510060, Guangdong, P. R. China. 3 Department of Medical Oncology, The Fifth Affiliated Hospital of Sun
Yat‑sen University, Guangzhou 519000, Guangdong, P. R. China. 4 Depart‑
ment of Pathology, Sun Yat‑sen University Cancer Center, Guangzhou 510060, Guangdong, P. R. China. 5 Guangdong Province Key Laboratory of Arrhythmia
and Electrophysiology, Guangzhou 510120, Guangdong, P. R. China. 6 Depart‑
ment of Radiotherapy, Sun Yat‑sen Memorial Hospital of Sun Yat‑sen Univer‑ sity, Guangzhou 510120, Guangdong, P. R. China. 7 Department of Anesthesiol‑
ogy, Sun Yat‑sen University Cancer Center, Guangzhou 510060, Guangdong, P. R. China. 8 Department of Hematology Oncology, Sun Yat‑sen University
Cancer Center, Guangzhou 510060, Guangdong, P. R. China.
Acknowledgements
QC was supported by National Natural Science Foundation of China (Nos. 81672686, 81372883, and 81001052), Natural Science Foundation of Guangdong Province, China (No. 2015A030313020), Science and Technology Planning Project of Guangdong Province, China (No. 2011B031800222), Young Talents Key Project of Sun Yat‑sen University (No. 2015ykzd13), and the Sister Institution Network Fund of MD Anderson Cancer Center.
Competing interests
The authors declare that they have no competing interests.
The authenticity of this article has been validated by uploading the key raw data onto the Research Data Deposit public platform (http://www. researchdata.org.cn), with the Approval Number as RDDA2017000335.
Ethics approval and consent to participate
The study was approved by the Ethics Committee of Sun Yat‑sen University Cancer Center.
References
1. Wu C, Zhu Y, Jiang J, Zhao J, Zhang XG, Xu N. Immunohistochemical localization of programmed death‑1 ligand‑1 (PD‑L1) in gastric carci‑ noma and its clinical significance. Acta Histochem. 2006;108(1):19–24. 2. Zou W, Wolchok JD, Chen L. PD‑L1 (B7‑H1) and PD‑1 pathway blockade
for cancer therapy: mechanisms, response biomarkers, and combinations. Sci Transl Med. 2016;8(328):328rv324.
3. Chen J, Jiang CC, Jin L, Zhang XD. Regulation of PD‑L1: a novel role of pro‑survival signalling in cancer. Ann Oncol. 2016;27(3):409–16. 4. Nomi T, Sho M, Akahori T, Hamada K, Kubo A, Kanehiro H, et al. Clinical
significance and therapeutic potential of the programmed death‑1 ligand/programmed death‑1 pathway in human pancreatic cancer. Clin Cancer Res. 2007;13(7):2151–7.
5. Kiyasu J, Miyoshi H, Hirata A, Arakawa F, Ichikawa A, Niino D, et al. Expression of programmed cell death ligand 1 is associated with poor overall survival in patients with diffuse large B‑cell lymphoma. Blood. 2015;126(19):2193–201.
6. Naidoo J, Page DB, Li BT, Connell LC, Schindler K, Lacouture ME, et al. Tox‑ icities of the anti‑PD‑1 and anti‑PD‑L1 immune checkpoint antibodies. Ann Oncol. 2015;26(12):383.
7. Thompson RH, Kuntz SM, Leibovich BC, Dong H, Lohse CM, Webster WS, et al. Tumor B7‑H1 is associated with poor prognosis in renal cell carci‑ noma patients with long‑term follow‑up. Cancer Res. 2006;66(7):3381–5. 8. Xu F, Xu L, Wang Q, An G, Feng G, Liu F. Clinicopathological and prognos‑ tic value of programmed death ligand‑1 (PD‑L1) in renal cell carcinoma: a meta‑analysis. Int J Clin Exp Med. 2015;8(9):14595–603.
9. Velcheti V, Schalper KA, Carvajal DE, Anagnostou VK, Syrigos KN, Sznol M, et al. Programmed death ligand‑1 expression in non‑small cell lung cancer. Lab Investig. 2014;94(1):107–16.
10. Nduom EK, Wei J, Yaghi NK, Huang N, Kong LY, Gabrusiewicz K, et al. PD‑L1 expression and prognostic impact in glioblastoma. Neuro Oncol. 2016;18(2):195–205.
11. Teixidó C, Gonzálezcao M, Karachaliou N, Rosell R. Predictive factors for immunotherapy in melanoma. Ann Transl Med. 2015;3(15):208. 12. Wenfeng F, Shaodong H, Nan C, Xiaobo H, Jianhua Z, Tao Q, et al. PD‑L1 is
remarkably over‑expressed in EBV‑associated pulmonary lymphoepitheli‑ oma‑like carcinoma and related to poor disease‑free survival. Oncotarget. 2015;6(32):33019–32.
13. Zhang J, Fang W, Qin T, Yang Y, Hong S, Liang W, et al. Co‑expression of PD‑1 and PD‑L1 predicts poor outcome in nasopharyngeal carcinoma. Med Oncol. 2015;32(3):1–6.
14. Qin T, Zeng YD, Qin G, Xu F, Lu JB, Fang WF, et al. High PD‑L1 expression was associated with poor prognosis in 870 Chinese patients with breast cancer. Oncotarget. 2015;6(32):33972–81.
15. Boger C, Behrens HM, Mathiak M, Kruger S, Kalthoff H, Rocken C. PD‑L1 is an independent prognostic predictor in gastric cancer of western patients. Oncotarget. 2016;7(17):24269–83.
16. Gao Y, Li S, Xu D, Chen S, Cai Y, Jiang W, et al. Prognostic value of programmed death‑1, programmed death‑ligand 1, programmed death‑ ligand 2 expression, and CD8(+) T cell density in primary tumors and metastatic lymph nodes from patients with stage T1‑4N + M0 gastric adenocarcinoma. Chin J Cancer. 2017;36(1):61.
17. Goodman A, Patel SP, Kurzrock R. PD‑1‑PD‑L1 immune‑checkpoint block‑ ade in B‑cell lymphomas. Nat Rev Clin Oncol. 2017;14(4):203.
18. Jelinek T, Mihalyova J, Kascak M, Duras J, Hajek R. PD‑1/PD‑L1 inhibitors in haematological malignancies: update 2017. Immunology. 2017;152(3):357– 71. https://doi.org/10.1111/imm.12788 (Epub 2017 Aug 4).
19. Ok CY, Young KH. Checkpoint inhibitors in hematological malignancies. J Hematol Oncol. 2017;10(1):103.
20. Topalian SL, Hodi FS, Brahmer JR, Gettinger SN, Smith DC, McDermott DF, et al. Safety, activity, and immune correlates of anti‑PD‑1 antibody in cancer. N Engl J Med. 2012;366(26):2443–54.
21. Brahmer JR, Tykodi SS, Chow LQ, Hwu WJ, Topalian SL, Hwu P, et al. Safety and activity of anti‑PD‑L1 antibody in patients with advanced cancer. N Engl J Med. 2012;366(26):2455–65.
22. Lin Z, Chen X, Li Z, Luo Y, Fang Z, Xu B, et al. PD‑1 antibody monotherapy for malignant melanoma: a systematic review and meta‑analysis. PLoS ONE. 2016;11(8):e0160485.
23. Motzer RJ, Rini BI, McDermott DF, Redman BG, Kuzel TM, Harrison MR, et al. Nivolumab for metastatic renal cell carcinoma: results of a rand‑ omized phase II trial. J Clin Oncol. 2015;33(13):1430.
24. Wallin JJ, Bendell JC, Funke R, Sznol M, Korski K, Jones S, et al. Atezoli‑ zumab in combination with bevacizumab enhances antigen‑specific T‑cell migration in metastatic renal cell carcinoma. Nat Commun. 2016;7:12624.
25. Brahmer J, Reckamp KL, Baas P, Crin L, Eberhardt WEE, Poddubskaya E, et al. Nivolumab versus docetaxel in advanced squamous‑cell non‑small‑ cell lung cancer. N Engl J Med. 2015;373(2):123–35.
26. Le DT, Uram JN, Wang H, Bartlett BR, Kemberling H, Eyring AD, et al. PD‑1 blockade in tumors with mismatch‑repair deficiency. N Engl J Med. 2015;372(26):2509–20.
27. Villasboas JC, Ansell SM. Nivolumab for the treatment of classical hodgkin lymphoma after failure of autologous stem cell transplant and brentuxi‑ mab. Expert Rev Anticancer Ther. 2016;16(1):5–12.
28. Bryan LJ, Gordon LI. Pidilizumab in the treatment of diffuse large B‑cell lymphoma. Expert Opin Biol Ther. 2014;14(9):1361–8.
29. Cai Q‑Q, Hu L‑Y, Geng Q‑R, Chen J, Lu Z‑H, Rao H‑L, et al. New risk factors and new tendency for central nervous system relapse in patients with diffuse large B‑cell lymphoma: a retrospective study. Chin J Cancer. 2016;35(1):87.
30. He X‑H, Li B, Yang S, Lu N, Zhang X, Zou S‑M, et al. R‑CHOP regimen can significantly decrease the risk of disease relapse and progression in patients with non‑germinal center B‑cell subtype diffuse large B‑cell lymphoma. Chin J Cancer. 2012;31(6):305–14.
31. Jian L, Jian O, Zhou R, Bing C, Yong X. Promising response of anaplastic lymphoma kinase‑positive large B‑cell lymphoma to crizotinib salvage treatment: case report and review of literature. Int J Clin Exp Med. 2015;8(5):6977.
32. Chuang WY, Chang H, Shih LY, Wang PN, Chang YS, Lin TL, et al. CD5 positivity is an independent adverse prognostic factor in elderly patients with diffuse large B cell lymphoma. Virchows Arch. 2015;467(5):571–82. 33. Hao X, Wei X, Huang F, Wei Y, Zeng H, Xu L, et al. The expression of CD30
based on immunohistochemistry predicts inferior outcome in patients with diffuse large B‑cell lymphoma. PLoS ONE. 2015;10(5):e0126615. 34. Huang W, Guo L, Liu H, Zheng B, Ying J, Lv N. C‑Myc overexpression
predicts aggressive transformation and a poor outcome in mucosa‑asso‑ ciated lymphoid tissue lymphomas. Int J Clin Exp Pathol. 2014;7(9):5634. 35. Hoeller S, Tzankov A, Pileri SA, Went P, Dirnhofer S. Epstein–Barr virus‑pos‑
itive diffuse large B‑cell lymphoma in elderly patients is rare in western populations. Hum Pathol. 2010;41(3):352–7.
36. Chen BJ, Chapuy B, Ouyang J, Sun HH, Roemer MGM, Xu ML, et al. PD‑L1 expression is characteristic of a subset of aggressive B‑cell lymphomas and virus‑associated malignancies. Clin Cancer Res. 2013;19(13):3462–73.
37. Carreras J, Lopez‑Guillermo A, Roncador G, Villamor N, Colomo L, Mar‑ tinez A, et al. High numbers of tumor‑infiltrating programmed cell death 1‑positive regulatory lymphocytes are associated with improved overall survival in follicular lymphoma. J Clin Oncol. 2009;27(9):1470.
38. Richendollar BG, Pohlman B, Elson P, Hsi ED. Follicular programmed death 1‑positive lymphocytes in the tumor microenvironment are an independent prognostic factor in follicular lymphoma. Hum Pathol. 2011;42(4):552.
39. Burger JA, Gribben JG. The microenvironment in chronic lymphocytic leukemia (CLL) and other B cell malignancies: insight into disease biology and new targeted therapies. Semin Cancer Biol. 2014;24(2):71–81. 40. Westin JR, Chu F, Zhang M, Fayad LE, Kwak LW, Fowler N, et al. Safety and
activity of PD‑1 blockade by pidilizumab in combination with rituximab in patients with relapsed follicular lymphoma: a single group, open‑label, phase 2 trial. Lancet Oncol. 2014;15(1):69–77.
41. Green MR, Rodig S, Juszczynski P, Ouyang J, Sinha P, O’Donnell E, et al. Constitutive AP‑1 activity and EBV infection induce PD‑L1 in Hodgkin lymphomas and posttransplant lymphoproliferative disorders: implica‑ tions for targeted therapy. Clin Cancer Res. 2012;18(6):1611–8. 42. Song Z, Yu X, Cheng G, Zhang Y. Programmed death‑ligand 1 expres‑
sion associated with molecular characteristics in surgically resected lung adenocarcinoma. J Transl Med. 2016;14(1):1–7.
43. Fang X, Xiu B, Yang Z, Qiu W, Zhang L, Zhang S, et al. The expression and clinical relevance of PD‑1, PD‑L1, and TP63 in patients with diffuse large B‑cell lymphoma. Medicine. 2017;96(15):e6398.
• We accept pre-submission inquiries
• Our selector tool helps you to find the most relevant journal
• We provide round the clock customer support
• Convenient online submission
• Thorough peer review
• Inclusion in PubMed and all major indexing services
• Maximum visibility for your research
Submit your manuscript at www.biomedcentral.com/submit
Submit your next manuscript to BioMed Central
and we will help you at every step:
45. Menter T, Bodmer‑Haecki A, Dirnhofer S, Tzankov A. Evaluation of the diagnostic and prognostic value of PD‑L1 expression in Hodgkin and B‑cell lymphomas. Hum Pathol. 2016;54:17–24.
46. Georgiou K, Chen L, Berglund M, Ren W, de Miranda NF. Genetic basis of PD‑L1 overexpression in diffuse large B‑cell lymphomas. Blood. 2016;127(24):3026–34. https://doi.org/10.1182/blood‑2015‑12‑686550
(Epub 2016 Mar 30).
47. Andorsky DJ, Yamada RE, Said J, Pinkus GS, Betting DJ. Programmed death ligand 1 is expressed by non‑Hodgkin lymphomas and inhibits the activity of tumor‑associated T cells. Clin Cancer Res. 2011;17(13):4232–44.
https://doi.org/10.1158/1078‑0432.ccr‑10‑2660 (Epub 2011 May 3).
48. Berghoff AS, Ricken G, Widhalm G, Rajky O, Hainfellner JA, Birner P, et al. PD1 (CD279) and PD‑L1 (CD274, B7H1) expression in primary central nervous system lymphomas (pcnsl). Clin Neuropathol. 2014;33(1):42–9. 49. Bsc JG, Hooijkaas AI, Kaiser ADM, Tinteren HV, van Boven H, Blank C. Over‑
all survival and PD‑L1 expression in metastasized malignant melanoma. Cancer. 2011;117(10):2192–201.
50. Green MR, Monti S, Rodig SJ, Juszczynski P, Currie T, O’Donnell E, et al. Integrative analysis reveals selective 9p24.1 amplification, increased PD‑1 ligand expression, and further induction via JAK2 in nodular sclerosing Hodgkin lymphoma and primary mediastinal large B‑cell lymphoma. Blood. 2010;116(17):3268–77.
51. Mitteldorf C, Berisha A, Pfaltz MC, Smc B, Schön MP, Kerl K, et al. Tumor microenvironment and checkpoint molecules in primary cutaneous diffuse large B‑cell lymphoma‑new therapeutic targets. Am J Surg Pathol. 2017;41(7):998.
52. Butte M, Keir M, Phamduy T, Sharpe A, Freeman G. Programmed death‑1 ligand 1 interacts specifically with the B7‑1 costimulatory molecule to inhibit T cell responses. Immunity. 2007;27(1):111.
53. Nicholas NS, Apollonio B, Ramsay AG. Tumor microenvironment (TME)‑ driven immune suppression in B cell malignancy. BBA Mol Cell Res. 2016;1863(3):471.
54. Keane C, Gould C, Jones K, Hamm D, Talaulikar D, Ellis J, et al. The T‑cell receptor repertoire influences the tumor microenvironment and is associated with survival in aggressive B‑cell lymphoma. Clin Cancer Res. 2017;23(7):1820.
55. Keane C, Gill D, Vari F, Cross D, Griffiths L, Gandhi M. CD4+ tumor infiltrat‑ ing lymphocytes are prognostic and independent of R‑IPI in patients with DLBCL receiving R‑CHOP chemo‑immunotherapy. Am J Hematol. 2013;88(4):273–6.
56. Ansell SM, Stenson M, Habermann TM, Jelinek DF, Witzig TE. CD4+ T‑cell immune response to large B‑cell non‑Hodgkin’s lymphoma predicts patient outcome. J Clin Oncol. 2001;19(3):720.
57. Curiel TJ, Wei S, Dong H, Alvarez X, Cheng P, Mottram P, et al. Blockade of B7‑H1 improves myeloid dendritic cell‑mediated antitumor immunity. Nat Med. 2003;9(5):562–7.
58. Slack GW, Gascoyne RD. Myc and aggressive B‑cell lymphomas. Adv Anat Pathol. 2011;18(3):219.
59. Durandpanteix S, Farhat M, Youlyouzmarfak I, Rouaud P, Oukmartin C, David A, et al. B7‑H1, which represses EBV‑immortalized B cell killing by autologous T and NK cells, is oppositely regulated by c‑Myc and EBC latency III program at both mRNA and secretory lysosome levels. J Immu‑ nol. 2012;189(1):181.
60. Casey SC, Tong L, Li Y, Do R, Walz S, Fitzgerald KN, et al. Myc regulates the anti‑tumor immune response through CD47 and PD‑L1. Science. 2016;352(6282):227.