Sensors for measuring plant phenotyping: A review
Ruicheng Qiu
1,
Shuang Wei
2,
Man Zhang
1*,
Han Li
1,
Hong Sun
1,
Gang Liu
1,
Minzan Li
1 (1. Key Laboratory of Modern Precision Agriculture System Integration Research, Ministry of Education, China Agricultural University,Beijing 100083, China; 2. Key Laboratory of Agricultural Information Acquisition Technology, Ministry of Agriculture, China Agricultural University, Beijing 100083, China)
Abstract: Food crisis is a matter of prime importance because it becomes more severe as the global population grows.
Among the solutions to this crisis, breeding is deemed one of the most effective ways. However, traditional phenotyping in breeding is time consuming and laborious, and the database is insufficient to meet the requirements of plant breeders, which hinders the development of breeding. Accordingly, innovations in phenotyping are urgent to solve this bottleneck. The morphometric and physiological parameters of plant are particularly interested to breeders. Numerous sensors have been employed and novel algorithms have been proposed to collect data on such parameters. This paper presents a brief review on the parameter measurement for phenotyping to describe its development in recent years. Some parameters that have been measured in phenotyping are introduced and discussed, including plant height, leaf parameters, in-plant space, chlorophyll, water stress, and biomass. And the measurement methods of each parameter with different sensors were classified and compared. Some comprehensive measurement platforms were also summarized, which are able to measure several parameters simultaneously. Besides, some deficiencies of phenotyping should be addressed, and novel methods should be proposed to reduce cost, improve efficiency, and promote phenotyping in the future.
Keywords: plant phenotype, high-throughput phenotyping, sensor, morphometric parameters, physiological parameters
DOI: 10.25165/j.ijabe.20181102.2696
Citation: Qiu R C, Wei S, Zhang M, Sun H, Li H, Liu G, et al. Sensors for measuring plant phenotyping: A review. Int J
Agric & Biol Eng, 2018; 11(2): 1–17.
1 Introduction
The rapid increase of the world population, alongside the decrease in cultivated land area, intensification of global climate change, and exacerbation of water resources shortage, is posing a tremendous challenge to the agricultural sector, which is facing the growing problem of grain security[1].
The most effective way to solve the food crisis is to increase grain yield. Plants are influenced by both self-genome and external environment conditions. At present, plants are more frequently subjected to unprecedented extreme weather (e.g., gale, drought, and waterlogging). Thus, breeding new plant varieties capable of withstanding complex and varied environmental conditions is imperative.
In the past decades, significant progress has been made in the field of plant breeding; particularly, advances in plant functional genomics and gene technologies have deepened the understanding on plant genomes[2]. Currently, genetically modified technologies have become an attractive subject and are regarded as the most effective and expedient solution to increase grain yield. With the
Received date: 2016-11-28 Accepted date: 2017-12-14
Biographies: Ruicheng Qiu, PhD candidate, research interests: Agricultural informatization, Email: qrc@cau.edu.cn; Shuang Wei, Master, research interests: agricultural informatization, Email: sepshuang@163.com; Han Li, PhD, research interests: agricultural informatization, Email: cau_lihan@cau.edu.cn; Hong Sun, PhD, Associate Professor, research interests: agricultural informatization, Email: sunhong@cau.edu.cn; Gang Liu, PhD, Professor, research interests: precision agriculture, Email: pac@cau.edu.cn; Minzan Li, PhD, Professor, research interests: precision agriculture, Email: limz@ cau.edu.cn.
*Corresponding author: Man Zhang, PhD, Professor, research interests: precision agriculture. P.O.Box 125, Qinghua Donglu, Haidian District, China Agricultural University, Beijing 100083, China. Tel: +86-10-62737188, Email: cauzm@cau.edu.cn.
development of plant genotyping, breeders intend to research on the nature of genotype by environment interactions. Phenotype, which is the external expression of plant genetics, results from the interaction of genotype and environment. Consequently, understanding the relationship between genotype and phenotype and linking them to the physiology at the cellular and tissue levels
are becoming more significant than ever[1,3]. Breeders pay
attention to both the final grain yield and the entire process of plant growth. Some plant traits and phenotypic parameters that vary in space and time as an organ develops need to be monitored and measured for a considerable time to cultivate excellent varieties. However, this task is formidable because numerous parameters are measured manually and the methods employed are outdated, laborious, costly, and time consuming. As a result, the use of inefficient measurement methods results that cannot realize large-scale production in breeding, and cannot inadequately exploited information from available genetic data[2]. Owing to the lack of phenotypic data, phenotyping has superseded genotyping as the major operational bottleneck and funding constraint of genetic analyses and breeding research[3]. Thus, applying new techniques and methods to relieve this bottleneck is both urgent and promising.
imaging techniques, reverse engineering, and virtual plant technique, can provide the basis for phenotyping. Such measuring methods can be carried out in the field or the laboratory to collect massive data, thereby facilitating high-throughput phenotyping.
Therefore, phenotyping allows the measurement of the morphometric and physiological parameters of plants in a rapid, non-destructive, accurate, and high-throughput manner. It can help breeders analyze and screen the salt resistance, drought resistance, and insect resistance of different varieties. The objectives of this paper are to summarize and analyze the existing measurement methods and sensors according to the related morphometric and physiological parameters in high-throughput plant phenotyping and discuss the obstacles encountered in this field.
2 Main phenotyping parameters and measurement
methods of plant
Currently, the measured objects in plant phenotyping are conventional food and economic crops, such as wheat, maize, sorghum, barley, tomato, bean, and grape. These plants have significant practical and economic values for agricultural development. Measurement usually focuses on some crop stand parameters. These parameters can be divided into morphometric and physiological parameters. The morphometric parameters, including plant height, stem diameter, leaf area or leaf area index, leaf angle, stalk length, in-plant space, and the physiological parameters, such as chlorophyll, photosynthetic rate, water stress, biomass, salt resistance, and leaf water content, which can all influence or represent the growth of a plant.
The phenotypic parameters that must be measured are numerous, and thus various sensors are used in phenotyping. Phenotype measurement is related to many traditional technologies. Numerous conventional and novel sensors are employed and integrated for plant characterization, including color digital cameras, lidar or laser sensors, range cameras, spectral sensors and cameras, thermography, fluorescence sensors, and other sensors. Several typical sensors that were extensively implemented in plant phenotyping were described in the following part, related representative products are listed in Table 1.
Table 1 Typical devices in plant phenotyping measurement
Sensor Sensor model Manufacturer
Color digital
camera __
Canon, Tokyo, Japan Nikon, Tokyo, Japan
Lidar/laser VLP-16, HDL-32E LMS series
Sick AG, Waldkirch, Germany Velodyne Acoustics, California, America
Range camera
CamCube 3.0 SR4000 Kinect 2.0
PMD, Germany MESA AG, Switzerland Microsoft, Washington, America
Spectral sensor
GreenSeeker RT 100, 200 CropCircle ACS 210, 430,
470 N-sensor
Trimble, California, America Holland Scientific, Lincoln, America
Yara International ASA, Oslo, Norway
Thermography FLIR T series FLIR, Oregon, America Fluorescence
sensor Multiples 2, 3 FORCE-A, Orsay, France Color digital cameras, which are mostly made up of charge-coupled device (CCD) silicon sensors or complementary metal oxide semiconductors, are the most conventional and simplest sensors in the machine vision field. Color digital cameras can collect the visible-band radiation of an object and
present its color information and textures information with similar wavelengths to human eyes. Plant 3D structure could be reconstructed with many images captured by the stereo vision system. It consisted of one or more color digital cameras, which made it possible for color digital camera to measure more phenotypic parameters.
Lidar sensors, which emit infrared or visible wavelength pulses, have been extensively used in agricultural studies since the 1980s[5] and are mostly based on time-of-flight (ToF) principle, interferometry, or triangulation. Lidar sensors based on ToF are suitable for measuring long ranges, the others are used to measure short ranges[6]. Lidar sensors output discrete point cloud data contain the distance information between the object and the sensors. Based on the structures, lidar could be divided into two-dimensional (2D) lidars and 3D lidars. 2D lidars detect an object through sector scanning and generate point cloud data in a plane. 3D lidars can present the point cloud data of the object surface features with high accuracy and high resolution, as well as more easily acquire morphological and structural data[7]. Besides the common lidar sensor just for measuring distances, full-waveform (FWF) lidar and hyperspectral lidar were also implemented in plant phenotyping. FWF lidar contains all the return information of a laser pulse in a unique waveform shape, not just the peaks, and peak intensity is also recorded. FWF lidar makes it easier to distinguish diverse objects[8]. Hyperspectral lidar is able to add the spectral response characteristics of plant to multiple wavelengths to point data, which help to diagnose the vigour of plant.
Range cameras can provide real-time depth information and images simultaneously. These cameras are mostly based on the ToF principle, structured light and light coding, ordinarily return depth, amplitude, and intensity images. The depth image contains the Z coordinate of the scene, the amplitude image can evaluate the quality of depth information, and the intensity image is simply a
grayscale image[9]. As a new kind of range camera, RGB-D
cameras equipped with RGB (red, green, and blue) camera, depth sensor and infrared emitters have been developed at low cost. RGB-D camera could simultaneously provide color information and depth information of an object, Kinect (Microsoft, WA, America) and Xtion (Asus, Taipei, Taiwan) are regarded as representatives of such cameras and are used extensively in numerous applications, including its primary application of plant measurement[10].
Spectral sensors usually detect the reflected information of a visible spectrum (400-700 nm) and a near-infrared (NIR) spectrum (700-1200 nm) and can be used to explore some specific characteristics of objects. Some commercial agricultural products, such as GreenSeeker (Trimble, California, America), ASD FieldSpec (Analytical Spectral Devices, Boulder, America), N-sensor ALS (Yara International ASA, Oslo, Norway), and CropCircle (Holland Scientific, Lincoln, America), have been widely implemented by researchers.
Thermography detects and visualizes the infrared radiation of an object in line with its temperature. The sensitive spectral band of
thermography is 3-14 μm, and the most common wavelengths are
3-5 μm and 7-14 μm[13]. Thermography is able to detect early heat generation in stressed plant, especially, leaf[14]. Thermal images can represent the surface temperature of a plant objectively.
Fluorescence sensors measure plants in a unique and active manner. In general, the chlorophyll of a plant is the fluorescent part. External light is absorbed and utilized by the chlorophyll for photosynthesis, where a proportion of the absorbed light is converted into heat, while the other proportion is reflected back in the form of fluorescence. Numerous plant traits, particularly some parameters related to the photosynthesis of the plant, can be acquired by detecting the fluorescence.
Many other sensors, such as ultrasonic sensor and thermometer, are also used in phenotype measurement, which will be described in the following sections.
Phenotype measurement can be conducted in an indoor or outdoor measurement environment. Measurement types mainly include handheld, vehicle-based, and unmanned aerial vehicle (UAV)-based measurements. In the following sections, the
measurement methods for the morphometric parameters (plant height, leaf area (LA)/leaf area index (LAI), leaf inclination angle (LIA), and in-plant space) and physiological parameters (chlorophyll, water stress, and biomass) of plants in phenotyping are introduced and summarized as a function of sensors (Table 2). The characteristics of the common sensors are listed in Table 3, and the detail information about these sensors will be discussed in the following sections.
Table 2 Measurement devices for morphometric and physiological parameters
Sensor
Parameters HeightLA/LAI/
LIA
In-plant space Chlorophyll
Water stress Biomass
Color digital camera √ √ √ √
Lidar/laser √ √ √ √ √
Range camera √ √ √ √
Spectral sensor/camera √ √ √ √
Thermography √
Fluorescence sensor √ √
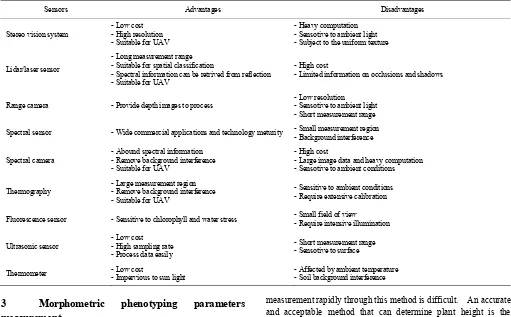
Table 3 Advantages and disadvantages of common sensors implemented in phenotyping
Sensors Advantages Disadvantages
Stereo vision system - Low cost - High resolution - Suitable for UAV
- Heavy computation - Sensotive to ambient light - Subject to the uniform texture
Lidar/laser sensor
- Long measurement range - Suitable for spatial classification
- Spectral information can be retrived from reflection - Suitable for UAV
- High cost
- Limited information on occlusions and shadows
Range camera - Provide depth images to process
- Low resolution - Sensotive to ambient light - Short measurement range Spectral sensor - Wide commercial applications and technology meturity - Small measurement region - Background interference
Spectral camera
- Abound spectral information - Remove background interference - Suitable for UAV
- High cost
- Large image data and heavy computation - Sensotive to ambient conditions
Thermography
- Large measurement region - Remove background interference - Suitable for UAV
- Sensitive to ambient conditions - Require extensive calibration
Fluorescence sensor - Sensitive to chlorophyll and water stress - Small field of view
- Require intensive illumination
Ultrasonic sensor
- Low cost - High sampling rate - Process data easily
- Short measurement range - Sensotive to surface
Thermometer - Low cost - Impervious to sun light - Affected by ambient temperature - Soil background interference
3 Morphometric phenotyping parameters
measurement
3.1 Plant height measurements
Plant height is a vital morphological parameter that can be used to describe the architecture of a plant. Plant height at the seedling growth stage can represent plant vigor, which is closely related to the final grain yield.
Conventional measurement is performed manually with a meter stick and is thus subject to human error, especially when the plant is higher than the human measuring it. Color digital cameras have been used to measure plant height, which can be calculated by processing the color images; however, this method requires known objects as reference. Realizing high-throughput
measurement rapidly through this method is difficult. An accurate and acceptable method that can determine plant height is the difference method, wherein the difference between the canopy height and the surface is calculated[15]. Novel systems or sensors, such as stereo vision systems, lidar or laser sensors, ultrasonic sensors, and range cameras, have also been utilized to measure plant height.
plant heights[19]. In the following part, various sensors for plant height measuring will be introduced.
3.1.1 Plant height measurement based on stereo vision systems With stereo vision systems, high-resolution images of a plant can be obtained and 3D models can be generated by fusing images of different perspectives for measuring plant height. Typically, fused images were collected from several different cameras or a moving camera (Figure 1), 3D models were established based on the relative positions of cameras. Chen et al.[22] adopted binocular stereovision to monitor maize in the fields and then reconstructed the images in 3D to calculate plant height. Many algorithms were put forward to make it possible to measure plant height with a single camera, structure-from-motion (SFM) and path-based multiple view stereo (PMVS) algorithms have great performance for stereo vision. Jay et al.[21] estimated plant height with a single color camera and constructed a 3D model of the plant using the SFM algorithm, both color and 3D information were used to derive plant height. Camera was also installed on a UAV to collect images from a large field of maize and sorghum[19], digital surface model was calculated with SFM to estimate plant height, but the results were not satisfactory, which may be caused by the insufficient images. High-resolution and considerable overlap
images are of great importance. Santos and Rodrigues[23]
employed PMVS to reconstruct 3D point of maize and estimated plant height by computing the distance between the farthest point and the fitting ground plane, the measuring error is inferior to 1%. Nonetheless, the accuracy and speed of the processing algorithms for stereo vision systems need to be improved. Binocular stereo vision is positive correlated with measuring distances, and SFM is sensitive to wrong registration. Stereo vision systems are also not robust against natural illumination because the limitations of color digital cameras, which restricts the outdoor applications of these systems.
a. Several different cameras[20] b. A moving camera[21]
Figure 1 Plant height measuring
3.1.2 Plant height measurement based on lidar/laser sensors Lidar or laser sensors have been used to measure plant height because they present good adaptation to illumination and provide considerable data. Some studies have selected vehicle-based measurement and installed lidar to measure plant height. Plant height can be derived from the point cloud data of lidar, including distance information collected from the plant canopy or plant side. Chatzinikos et al.[24] used a laser scanner to measure the properties of three plants. Saeys et al.[25] adopted 2D lidar to measure wheat and used the histogram method to estimate plant density. Zhang and Grift[26] used 2D lidar to detect the stem height of Miscanthus giganteus. Given the measurement errors introduced by the inclination angles resulting from the installation of the sensor or the
undulation of the ground, Zhang and Grift[26] analyzed and
developed a correction algorithm based on the difference between the maximum and minimum ordinates. However, travel speed and natural wind both affected the aforementioned studies, because high speed can diminish the data volume as a result of the 2D line scan nature. On the other hand, 2D lidars are not robust in measuring the occlusion of plant organs, such as overlapping leaves and branches[9]. Owing to their ability to handle this situation, 3D lidars have been mounted at certain heights to observe plants in some studies[27,28]. Because the measurement error increases with the increase of the measurement distance, the appropriate distance and installation position of the 3D laser radar should be determined. To address this issue, the related tests and analysis were conducted by Ehlert and Heisig[29]. The results showed that plant surface generated based on point cloud becomes steeper with an increase in scan angle, as shown in Figure 2. The accuracy of the point cloud data is the highest when 3D lidars scan small plants vertically, and the front angle represents the best angle for high plants. Different from 2D lidars, 3D lidars are unaffected by a wide speed range, and the velocity of a vehicle has a negligible effect on the measurement results[30].
Figure 2 Theoretical overestimate of reflection point height by lidar[29]
Novel lidars with preferable performances have also been introduced to measure plant height. A 3D lidar with four layers was adopted to measure the height of wheat and maize[30,31]. The lidar emits a pulse, and four photodiodes at different heights receive the return signals. As a result, a pulse can acquire four echo signals, and the accuracy and data volume can be improved. Gao et al.[16] likewise adopted an airborne FWF lidar system to extract maize height through a UAV-based measurement. Unlike lidar point clouds, which record limited strong peaks, a FWF contains all the return signals of a laser pulse[16], and different signals can be combined and analyzed. UAV-based measurement can build a digital terrain model to improve measurement accuracy. Plant height can be acquired by taking the difference between the digital terrain model and the current UAV surface model[32-34], thus generating crop surface models.
ultrasonic sensors mounted on a two-wheel bicycle to measure maize height for yield estimation. However, ultrasonic sensors are likely to be divergent and damped. Their scanning accuracy is susceptible to the orientation and roughness of the sensing surface that data are easily lost. The sensors usually installed perpendicular to the ground to ensure precision, but the upright leaves movement with wind will lead to different readings[6]. All of these factors result in the fact that ultrasonic sensors are not suitable to measure long range. Recently, acoustic spectrum in a wide frequency range were applied, and the quality of the
ultrasonic signals are significantly improved[37], which may
promote its application. To improve measurement accuracy, ultrasonic sensors can be also combined with lidars[38].
3.1.4 Plant height measurement based on range cameras
Range cameras measure plant height based on its depth information. An autonomous field robot mounted with PMD cameras was developed, and the plant height was monitored by calculating the histogram of distances[39]. However, the cameras are usually disturbed by natural illuminations, and the pixels of the images are low (e.g., 204×204 pixels for PMD CamCube).
Besides depth information, color information provided by RGB-D camera makes it easier to remove background interference and identify plant. Azzari et al.[40] used Kinect to characterize the vegetation structure, the normalized root-mean-squared error of plant height ranged from 2.7% to 19.1%. Gai et al.[7] used Kinect to recognize plants and calculate their heights, the measuring error of maize within 2 cm. Andújar et al.[41] applied Kinect to estimate the height of cauliflower, the deviation from the ground truth is less than 2 cm. Kinect provides high-resolution images (e.g., 640× 480 pixels and up to 1920×1080 pixels) even if its cost is lower than the aforementioned sensors. In addition, the latest Kinect is robust against natural illuminations, and its applications in plant phenotyping are promising.
3.1.5 Comparison and analysis of plant height measurements Compared with other sensors, the measurement accuracy of lidars is the highest because of the considerable amounts of data they acquire[42]; however, they are costly. Although ultrasonic sensors have a price advantage, only few studies use these sensors because they generate huge amounts of invalid data. Stereo vision systems require image calibration, and range cameras possess low resolution, so that the data may be lost after data processing. Illumination also has an effect on the measurement accuracy of both stereo vision systems and range cameras. With the improved performance and algorithm, aside from its low cost and high accuracy, Kinect may be a good choice for plant height measurement.
Vehicle-based measurement has significant benefits, and all the aforementioned sensors can be mounted on vehicles. Generally, GPS and encoders are selected as accessories to record the positions of the vehicles and plants in real time, and then an automatic navigation system can be applied. However, uneven terrains are likely to affect the measurement accuracy. The information reflected from the ground is mixed with the information on the plant canopy and introduces measurement interference, especially at the early growth stage of the plants.
UAV-based measurement receives more attention because of its high efficiency and low cost. But when the color camera was mounted on UAV, the UAV speed and the exposure time of color camera will affect the measurement accuracy. Currently, lidars are extensively used for UAV measurement because of their high accuracy and data rate.
3.2 Leaf angle / leaf area / leaf area index measurements Leaf is one of the important parts of a plant. It plays a significant role in plant growth because its growing status affects the efficiency of the direct solar energy utilization of plant. Therefore, leaf is a vital parameter in plant phenotyping. Numerous morphological parameters are associated with leaf, and those that are frequently measured in phenotyping include LIA or leaf angle distribution (LAD), LA, and LAI. LIA refers to the angle between the zenith and the leaf surface normal and determines the quality of plant light interception. LAD has an influence on the LAI measurement and represents the water stress of a plant[43]. LA refers to the area of a single leaf, and its estimation is significant to the biometrical observation (geometric features) of a plant. LAI indicates the ratio of the summation of plant LAs per unit ground area. LAI represents the vitality of a plant group and the canopy architecture, which results in photosynthesis and plant water use. The aforementioned parameters are relevant to a plant in terms of biological and physical processes, such as photosynthesis, respiration, transpiration, and water use, as well as to grain yield. LIA can be measured manually using a protractor. Compared with that of LIA, the measurement methods of LAI and LA are complicated and arduous. A leaf needs to be painted with paper in unit cells, and the number of cells can then be counted to obtain the area. A few sensors and techniques for measuring leaf have been developed and implemented gradually for phenotyping to save time and minimize labor, which will be introduced in the following part. 3.2.1 Leaf parameters measurement using color digital cameras and stereo vision system
Color digital camera is a low-cost imaging device and extensively used in various fields, including measuring plant leaves. Specifically, the color images of leaves are captured and processed with morphological operations, which can be used to calculate the parameters of LIA, LA, and LAI. Deng et al.[44] used an image processing method to measure the leaf posture of maize. Images were corrected and preprocessed firstly, and then the skeleton extraction was conducted to acquire the structure of stem and leaves. Finally, LIA were obtained by calculated branch angles of skeleton.
Calculating LA according to pixels is a common method. An et al.[45] used a color digital cameras to develop a pipeline and then to measure leaf length and rosette area. Color correction and optical distortion correction were performed, the plant was extracted from background based on colors. And then plant boundary was searched, the rosette area was calculated by computing the number of pixels.
researches have shown that there is a relationship between the plant coverage and LAI. Liu and Pattey[49] used top-of-canopy color images over a plant to estimate LAI, a model was built based on gap fraction, which was linearly related with LAI2000.
a. Original image b. Image of individual leaves with different colors Figure 3 Leaf parameters measurement by color digital
cameras[47]
Stereo vision systems were also introduced to measure leaf features. The system, which was developed by Yeh et al.[50], consists of two off-the-shelf cameras with parallel optical axes. Images were rectified and registered, corresponding pointes were detected and matched. Plants were segmented and LA was
calculated by counting the pixels. Leemans et al.[51] used
stereoscopic images to build a model with distance information, LAI was segmented and calculated in the field. Multi-camera can consist a multi-view stereo vision system, Zhang et al.[52] combined four images taken at different positions with SFM algorithm to reconstruct paprika plant in 3D and accurately estimated leaf lengths and widths, which can be used to measure LA[53,54].
3.2.2 Leaf parameters measurement using range cameras
Range cameras were tested to analyze the parameters of leaves. Depth images of a leaf captured by PMD and SwissRanger SR4000 cameras were analyzed and compared under indoor (room) and outdoor (shadow and sunlight) conditions[9]. The results showed that determining the best possible integration times for each condition is necessary. Depth information offered by ranger cameras was widely used to extract plants and leaves. Song et al.[55] combined stereo and ToF images and conducted localized search to find the boundary of leaves. Chéné et al.[56] proposed a segmentation algorithm of depth images captured by Kinect to extract leaf and measured its azimuth and zenith angles for plant phenotyping, as shown in Figure 4. Additionally, Andújar et al.[41] separated crops from ground not only based on the height difference but also according to their colors. Plant leaves were extracted and reconstructed in 3D. Point cloud data were meshed and smoothed, then LAD, LAI and LA can be successfully estimated[55,57].
a. RGB image of plant b. Azimuth and zenith angles of leaves in the depth image Figure 4 Leaf parameters measurement by range cameras[56]
3.2.3 Leaf parameters measurement using spectral sensors and cameras
A few vegetation indices can generally be derived based on the spectral responses of plant canopy. In particular, non-destructive methods can be used to invert some parameters and indirectly calculate LAI, and typically, the most common parameter used to invert LAI is the NDVI[58]. New parameters
were also presented in recent studies. Hasegawa et al.[59]
combined the hot spot-dark spot index and the NDVI, both of which are related closely with LAI. They proposed a normalized hotspot-signature vegetation index (NHVI) to build the relationship with LAI, the results shown that NHVI has better performance in estimating LAI than NDVI. In general, the spectral information in visible and NIR bands was used to build LAI model. Neinavaz et al.[60,61] conducted some researches in the thermal infrared region (TIR). Spectrometer was implemented to measure the spectral information of plants in the TIR. In the region, spectra mostly came from the emissivity of plants rather than their reflectance. Radiometric calibration was carried out to the measurement. They found that the canopy
emissivity spectra increased with rising LAI[60]. PLSR and
ANN were applied to analyze the spectral data, the results indicated that the spectrum in TIR is able to retrieve LAI, but it is necessary to conduct further study in field conditions[61]. LAI also can be evaluated according to the plant coverage calculated
from spectral images. Dammer et al.[62] used multispectral
camera to collect the plant reflections of light at red and infrared wavelengths. Schirrmann et al.[63] gathered images from the red and NIR wavelength range of plants, and then NDVI images based on red and infrared images or red and NIR images were calculated. NDVI images were processed to extract plants and calculate the plant coverage, then LAI was estimated according to the coverage.
3.2.4 Leaf parameters measurement using lidar/laser sensors Special attentions are increasingly given to lidar to measure leaf features. Lidar can rapidly acquire the point cloud data of a leaf surface by using sensors to scan the plant canopy and leaves. Plant architecture can thus be generated under indoor or field conditions.
a. Point cloud data of the wheat plant b. 3D reconstruction of each leaves Figure 5 Leaf parameters measurement by laser sensors[65] 3.2.5 Comparison and analysis of leaf parameters measurements The above mentioned measurement methods can be divided into two types according to the measurement principle of leaf. Color digital camera, stereo vision system, range camera, and lidar can measure or estimate leaf features by segmenting and reconstructing the leaf and calculating its actual values. Spectral sensors and cameras can acquire leaf features through inferring on the basis of related parameters. Compared with inference, reconstruction is more complicated and has costly computation operation. However, the measurement accuracy of reconstruction is generally higher than that of inference.
Several problems encountered in practice that cause the measurement methods of LIA, LA, and LAI to be incomplete. On the one hand, accomplishing the measurement of leaf according only to the single-perspective data is difficult. Multi-perspective measurement is needed to reduce deviations. On the other hand, leaves of the same plant or adjacent plants will block and overlap each other. Current methods have difficulty classifying all leaves and settling this situation. Consequently, measurement results usually tend to be underestimated.
3.3 In-plant space measurements
Considerable previous researches showed that variations in plant spacing can affect the architecture and populations of plant, a phenomenon that leads to an uneven distribution of moisture and illumination, which, in turn, results in lower final grain yield[71]. Measuring plant spacing provides a basis for breeders to explore the relationship between genotype and phenotype. Conventional measurement methods are time consuming and laborious, which make automatic plant spacing sensing necessary. Notably, plant localization is the premise of measuring in-plant space.
In general, color digital camera was chosen to acquire the image of plant, and multiple consecutive images were processed
and mosaicked to obtain the position distribution map[21].
However, a color digital camera has difficulty separating individual plants. To overcome the challenge, lidar, stereo vision system, range camera, and other sensors are implemented in this field. Shi et al.[72,73] used a 2D lidar to measure maize stem in side-view dynamically. The locations of each stem were obtained by fusing the encoder data. In addition, ground irregularity, weed, and leaves resulted in the loss of data in the process of measurement. To obtain abundant information, 3D sensors were adopted. Compared with 2D sensors, 3D sensors could provide more comprehensive relative positions with minimal interference of terrain and obstacle. Jin and Tang[74] used a stereo vision system consisting of two CCD imaging sensors to recognize maize in the V2-V3 growth stage. They also processed and analyzed the depth image. Plant center was localized according to its lower height and concave slope. Located plant in top-view images is usually
less accurate than side-view. Nakarmi and Tang[71,75] developed a cart mounting with a ToF-based 3D imaging sensor and encoder. Side-view images were captured and stem locations were confirmed by processing the depth images, thus acquiring the in-plant space. Different images were also mosaicked in two scenarios, and the distribution of row plants was generated. Plant spacing could be obtained by calculating the distance between neighbor stems.
4
Physiological phenotyping parameters measurement
4.1 Chlorophyll measurements
Chlorophyll is the organic molecule of plant leaves and is regarded one of the key components in plant photosynthesis. Plant leaf nitrogen cannot be synthesized without chlorophyll. Some studies have found a high relationship between leaf nitrogen and chlorophyll because pigments determine most spectral features between 400-700 nm in a spectrum[76]. Moreover, reflection from this wave band primarily depends on the chlorophyll content of leaves and has a negative correlation with leaf nitrogen content[77]. The nutritional and physiological statuses of a plant can be effectively estimated based on chlorophyll content. Measuring chlorophyll is crucial for monitoring plant growth, promoting nitrogenous fertilizer usage, and guaranteeing high yield. Kjeldahl Method has the highest accuracy among chlorophyll measurement methods and is deemed the most commonly used method to measure chlorophyll. However, it necessitates a complex and time-consuming chemical analysis. Leaves are also destroyed in the process of measurement, and the plant growth will be affected. Rapid, non-destructive, and cost-effective measurement methods are, therefore, necessary.
As an alternative, spectrum technology has been applied to analyze the chemical components of plants because of its rapid and non-destructive advantages. Various spectral sensors and cameras have been developed to measure plant chlorophyll. In addition, researchers have acknowledged that fluorescence technology can measure chlorophyll according to the response of leaves to light. Some lidars or laser sensors with specific wavelengths and the capability to measure chlorophyll have also been developed. In the following part, various sensors for chlorophyll measuring will be introduced.
4.1.1 Chlorophyll measurement based on spectral sensors The development of spectrum technology has resulted in an increasing number of mature products being introduced in the market. Spectral sensors are the most frequently used instruments to assess vegetation status with visible and near-infrared light. Many studies have also been carried out using some typical spectral sensors that are passive-type or active-type to measure chlorophyll. Conventionally, some spectral vegetation indices were also calculated based on several spectral information in the different wavelengths to invert chlorophyll, these indices are revealed to be slightly superior to the normalized difference vegetation index (NDVI).
to estimate plant chlorophyll. As a representative of passive-type sensors, Yara N-sensor is widely-used in measuring chlorophyll, which provided multi-spectral reflection of a plant. There is also a spectrometer pointing sky to correct for the fluctuation in light
intensity. Raper and Varco[79] analyzed the multi-spectral
reflectance and provided a simplified canopy chlorophyll content index to detect cotton chlorophyll, which indicated that reflectance in the red edge region strongly related with the leaf nitrogen status. ASD FieldSpec is also a portable device, whose wavelength is in the domain of 350-2500 nm, and is also capable of providing hyperspectral data. Based on the hyperspectral reflectance data obtained through ASD, He et al.[80] estimated the nitrogen status of wheat by proposing the multi-angle vegetation index and pointed out that taking measuring angle into account is very important. Thorp et al.[81] estimated leaf chlorophyll with partial least squares regression (PLSR) approach, the results showed the performance was better than NDVI and the physiological reflectance index. Inoue et al.[82] compared the canopy chlorophyll of different plant types and regional scales, and found the ratio spectral index with the reflectance at 815 nm and 704 nm was robust to predict canopy chlorophyll content.
Conversely, GreenSeeker, CropCircle and other devices equipped with active spectral sensors have been widely used in agriculture, because they can tolerate severe environments. The active sensors usually emit amber or red and NIR wavebands light due to their link to chlorophyll[83] and record the reflectance of several wavebands to calculate some vegetation indices to measure chlorophyll, primarily NDVI. GreenSeeker and CropCircle were used by Barker[84] mounted on field-based phenotyping platforms to measure plant chlorophyll, the change in NDVI from night to the brightest noon was 0.046 for GreenSeeker and 0.0013 for CropCircle, which indicated that they were all not significantly affected by ambient light. Kipp et al.[85] developed a method for measuring the early chlorophyll in winter wheat with the use of multispectral active sensors, including GreenSeeker and CropCircle. They also used RGB image analysis as a reference method and proposed a novel index, the early plant vigor index (EPVI), using single wavelengths values (670 nm, 750 nm and 862 nm) to evaluate early plant vigor. GreenSeeker Model 505 (red at 656 nm and NIR at 774 nm) and CropCircle ACS-210 (amber at 590 nm and NIR at 880 nm) were used to collect red and amber canopy NDVI values of winter wheat at three growth stages by Samborski et al.[83], they found that genotype has an effect on both red NDVI values and amber NDVI values at Zadoks 37 to 39 growth stages, and only on amber NDVI values at 55 to 71 growth stages. CropCircle ACS-210 and ACS 430 (red at 630 nm, red-edge at 730 nm and NIR at 780 nm) were compared by Taskos et al.[86], different NDVI values were calculated and analyzed in each individual waveband. The results demonstrated that ACS-430 indices and red edge-based indices were more strongly correlated with leaf chlorophyll of vineyards. The new CropCircle ACS-470 provides filters to select different wavelengths and vegetation indices were also highly related to plant nitrogen[87], red edge-based indices performed better than NDVI and ratio vegetation index[86]. But plant height, measuring distance, temperature, and reflectance from soil or adjacent rows affect the performance of active sensors, the optimal measuring distance should be adjusted depending on plant architecture and the growth stage, and the distance of sensors beyond 40 cm from the canopy is appropriate[88-91]. In addition, reflectance indices were less sensitive at the late growth stages of plants with the reduction
in the NIR reflectance from canopy[83,87].
Among all of the active-type and passive-type spectral sensors, GreenSeeker, CropCircle, and N-sensor are the most commonly used for on-the-go in real-time measurement of plant chlorophyll, all of them could be mounted on a platform and suitable for high-throughput phenotyping. Raper et al.[90] tested N-sensor, GreenSeeker Model 505, and CropCircle ACS-210, they found that N-sensor and CropCircle ACS-210 were less sensitive than GreenSeeker Model 505 at the early growth stage of pants when the NDVI values were small, while N-sensor and CropCircle ACS-210 have better performance than GreenSeeker Model 505 at the late growth stages when NDVI values were higher than 0.6. 4.1.2 Chlorophyll measurement based on spectral cameras Unlike common spectral sensors, multispectral or hyperspectral cameras can measure canopy spectral reflectance in wide wavebands with high spatial resolution images (Figure 6), making it possible to extract plant from background with image processing and derive numerous vegetation indices exactly. Based on these advantages, spectral cameras have been extensively applied to estimate and predict plant chlorophyll.
can be also mosaicked together for a better understanding of the measured region[95,96]. Elarab et al.[95] calculated the vegetation indices, selected LAI, NDVI, thermal and red bands as inputs of relevance vector machine algorithms to spatially estimate oat
chlorophyll with a root-mean-squared-error of 5.31 μg/cm2.
Kalacska et al.[97] developed a model that comprised a continuous wavelet transform with a neural network to predict chlorophyll with R2 value ranging from 0.8 to 0.9.
Satellite spectral imager can provide spectral images that cover large sized plots, but the spatial resolution is lower and the sample period is longer than vehicle-based and UAV-based measurement. Houborg et al.[98] analyzed hyperspectral images from the Earth Observing-1 satellite with a 30 m ground resolution. Images were conducted radiometric and geometric correction, and atmospheric correction was also carried out with the FLAASH algorithm to retrieve water vapor and correct adjacency effects. And then vegetation indices were calculated for multiple parameters regression to assess chlorophyll. Some indices, particularly in the red-edge bands, played an important role in improving the robustness of chlorophyll retrieval.
4.1.3 Chlorophyll measurement based on fluorescence sensors Chlorophyll fluorescence (ChlF) is emitted by chlorophyll shortly after plants absorb light. It mainly comes from photosystem II, which offers a promising method for measuring plant chlorophyll content. ChlF signals could be divided into the red fluorescence (RF) and the far-red fluorescence (FRF). The ChlF ratios of RF and FRF are usually used to estimate plant chlorophyll.
ChlF measurements contain active fluorescence-based measurement and passive reflectance-based measurement. Active fluorescence-based measurement based on the pulse-amplitude modulation or the laser-induced fluorescence (LIF) transient method, whose measuring range can up to several meters. Passive reflectance-based measurement derives ChlF with the use of sun-induced fluorescence (SIF) method[99]. Active fluorescence- based measurement has advantage over passive reflectance-based measurement in tolerating ambient light, so many researches applied this measurement.
LIF is an active sensing technique wherein leaves are excited by laser sensors and then re-emit fluorescence, which is widely used in measuring chlorophyll. Yang et al.[100,101] used the ultraviolet (UV) laser to induce fluorescence and measured the intensity of fluorescence peaks at 685 nm and 740 nm to estimate paddy rice nitrogen content with back-propagation neural network and support vector machine (SVM) models. They found that the intensity of fluorescence peaks were more sensitive and accuracy than the fluorescence ratios in estimating nitrogen content. The Multiplex fluorescence sensors were used to measure the nitrogen status by Agati et al.[102,103], and Longchamps and Khosla[104]. The sensors provided the flavonol index, the chlorophyll indices and the nitrogen balance indices (NBI) that were calculated based on the ratio of RF and FRF induced by UV, red, green, or blue light. One of the NBI was highly relation to leaf nitrogen content and not
affected by seasons[102]. Longchamps and Khosla[104] also
conducted some tests for the Multiplex fluorescence sensor, and verified the fact that the fluorescence sensors can measure the variation of chlorophyll at the early stage of plant. And soil has less impact on the measurement if plant height is higher than 20 cm. In order to investigate the influence of light intensity and temperature, Thoren et al.[105] tested LIF measurements under field and controlled laboratory conditions. Studies showed that the chlorophyll content of plant leaves is strongly related to the ratio of
the two peaks of ChlF at 690 nm and 730 nm, and the ratio decreased linearly with an increase in light intensity up to 23°C. 4.1.4 Chlorophyll measurement based on lidar/laser sensors
Blue and red light are essential partners for plant photosynthesis, which would be absorbed by chlorophyll and carotenoids, and most green light was reflected. Some research has proved that the reflectance of green light is sensitive to the variation in plant chlorophyll, canopy reflectance at 550 nm will increase with the reduction of chlorophyll[106]. Based on the study, Eitel et al.[107-110] conducted many researches on the use of green (532 nm) laser sensor to measure leaf chlorophyll and nitrogen. The reflectance intensity values were recorded to calculate chlorophyll. However, there are many factors that influence the measurement accuracy. In order to improve the measurement accuracy, the process can be divided into the following steps. First, the laser reference intensity was normalized by using a white reference panel to correct the drift of laser intensity [108]. Second, the soil and edge returns were removed based on an intensity threshold[107]. Third, it is necessary to keep the distance between the laser sensor and plant constant[110]. The results indicated that green laser intensity was strongly correlated with chlorophyll and nitrogen content. Furtherly, a multi-wavelengths laser system was tested and the ratio of green and red laser return intensities was used to measure plant nitrogen. But the results were not significantly improved compared with previous researches, which may be caused by aggravating the leaf angles effects.
With the development of lidars, the hyperspectral lidar was introduced to measure plant chlorophyll or nitrogen. This kind of lidar works based on wide-spectrum emission and is able to produce point cloud data with spectral information (Figure 7). The performance of ASD FieldSpec, multispectral lidar and hyperspectral lidar were compared by Sun et al.[112], and the results demonstrated that hyperspectral lidar has the best performance in estimating plant nitrogen. Nevalainen et al.[113] used hyperspectral lidar to estimate leaf level chlorophyll. Points that had low NDVI values were filtered and vegetation indices were calculated for linear regression analysis to estimate chlorophyll. The results demonstrated that the modified chlorophyll absorption ratio index (MCARI), which was calculated by using reflectance at 750 nm and 705 nm, has the best performance in measuring needle-leaf chlorophyll. Du et al.[114] recorded the reflectance intensity of a hyperspectral lidar and selected characteristic wavelengths to estimate nitrogen contents with SVM regression. They proposed that considering more wavelengths as inputs in the regression can significantly improve measurement accuracy. Furthermore, they combined hyperspectral lidar data and LIF data to detect
nitrogen[115]. With the use of SVM regression, PLSR and two
artificial neutral networks (ANN), the determination coefficients were high. In addition, they found that the reflectance spectrum performs less well in predicting plant chlorophyll when the leaf nitrogen content is high.
Recently, Ounis et al.[116] described a new lidar system that combing LIF and SIF, which may provide help to measure chlorophyll in the future.
4.1.5 Comparison and analysis of chlorophyll measurements Chlorophyll measurement has always been the priority of considerable research, and the related spectral products and sensors have been implemented widely for such task. Spectral measurement is usually disturbed by ambient conditions, especially sun illumination, and the performance of active sensors is better than that of passive sensors. Previous studies have demonstrated that the reflected spectral information from soil can affect the spectral determination of chlorophyll at the early stages of plant growth because soil coverage is low at such an early development
stage[85]. Owing to the abundant spectral information,
hyperspectral or multispectral sensors and cameras can probably eliminate background interference by deducing some vegetation indices. Hyperspectral or multispectral cameras can be not only used on vehicle, but also mounted on UAV or satellite, making it is possible to realize large-scale measurement by mosaicking multi-frame images. Image processing methods can be applied to extract vegetation and remove background interference. But the volume of data captured by spectral cameras is tremendously large due to the high data rate, especially in the UAV measurement, which needs laborious offline processing. ChlF measurement is more sensitive to the variation of chlorophyll than vegetation indices. Compared to spectral sensors like GreenSeeker or CropCircle, the field of view of Multiplex fluorescence sensor is smaller, as shown in Figure 8. Reflectance almost comes from plant vegetation, which gives rise to that ChlF measurement is independent of distance and soil. In addition, the intensities of fluorescence at about 690 nm and 740 nm are largely used to analyze and estimate plant chlorophyll.
Figure 8 Comparison the field-of-view (FOV) of ChlF and spectral sensors [104]
The measurement accuracy of laser sensors is mainly depends on the reflectance intensity that is affected by various factors, such as temperature, leaf edge, measuring angle, and leaf roughness. Further research is needed. Hyperspectral lidar provides help for us to measure chlorophyll in spatial and temporal scales and broadens the potential application of lidars.
4.2 Water stress measurements
Global warming and water resources shortage have resulted in the inevitable reduction of grain yield. In the increasingly crucial task of conducting research on the water use efficiency of plant, water stress is an important parameter for assessing plant drought water status. Stomatal conductance and leaf water potential (LWP) are vital indictors of plant water stress, and canopy temperature is a
surrogate for stomatal conductance[117], crop water stress index (CWSI) is successfully related to LWP[118]. Generally, water stress can be measured by two methods, one is based on canopy or vegetation temperature, the other is based on canopy or vegetation reflectance. Thermal infrared technique is an effective method to investigate canopy temperature. Spectral technique is widely used to measure canopy reflectance. Typically, thermometer, thermography, spectral sensors and cameras are implemented to evaluate water stress, the related methods will be described as follow. 4.2.1 Water stress measurement based on thermometer
Thermometers can be mounted on some phenotyping platforms to monitor plant canopy temperature[78,84], whose measuring region is concentrated and small that contribute to reduce interference. Although ambient light does not affect thermometers due to its measured radiations are in the long-infrared, ambient temperature has a significantly effect on thermometers reading. Tests conducted by Barker et al.[84] showed that thermometer reading was higher than the surface temperature when the ambient temperature was high, and the thermometer will underestimate the actual temperature when the ambient temperature was low. Therefore, they put forward a correction method based on the ground truth measurement with the use of thermocouple to reduce the measurement error.
Vegetation temperature is usually lower than ambient temperature, but when the vegetation fraction is small, especially at the early stage of plants, soil temperature is higher than ambient temperature during middays that disturbing the measurement. In order to reduce the influence from soil, Rischbeck et al.[119] used two thermometers to measure canopy temperature with the opposed oblique views at an angle of 45 degrees from the nadir. This measurement was capable of increasing the biomass proportion in the field of view. The actual, the lowest and highest canopy temperatures were used to calculate CWSI. Besides, some researches collected ambient temperature to correct thermometer values, Ni et al.[120], Kim et al.[121] and Bai et al.[78] regarded the difference between canopy temperature and air temperature as an indicator of water stress to assess plant growth.
4.2.2 Water stress measurement based on thermography
Infrared thermography is considered as a high-throughput tool for measuring plant temperature to estimate the plant water stress, which provides great help for us to evaluate spatial and temporal water variability of plants.
temperature and improve the measuring efficiency of canopy temperature. In addition, thermal image resolution plays an important role in eliminating inaccurate temperatures, especially the temperatures correlated to the edge pixels that contain both canopy and background[117].
Infrared thermography can be applied on vehicle-based[123],
UAV[118,126] and greenhouse[127]. Thermal images of plant and environmental parameters were collected synchronously, and thermal images need to be calibrated with radiometric correction. After canopy temperatures were calculated, CWSI, LWP, vapour pressure deficit (VPD) and other parameters would be applied to evaluate plant water stress (Figure 9).
Figure 9 Spatial CWSI images[127] 4.2.3 Water stress measurement based on spectral sensors and
cameras
Researches was conducted by Buitrago et al.[128] to investigate the changes in thermal infrared spectra of plants caused by water or temperature stress. They found that water stress and temperature stress created a similar spectral response, the emissivity in mid-infrared decreased with water loss. And many spectral sensors were applied to measure canopy temperature or water stress of plants. Elsayed et al.[129] tested a hyperspectral passive sensor, a hyperspectral active sensor, an active flash sensor, a CropCircle, and a GreenSeeker to assess the normalized relative canopy temperature (NRCT) that was similar to the CWSI introduced by Rischbeck et al.[119], and the spectral indices of all sensors strongly in correlation with NRCT.
Assessing the water stress of plants based on spectral indices was a principle method for spectral sensors and cameras, but the internal structure of leaf affects the sensitivity of these indices. Taking advantage of the spectral reflectance at the specific wavelengths collected by spectrometer, Bandyopadhyay et al.[130] proposed and calculated different water stress indices to characterize the water stress of wheat. Winterhalter et al.[131] evaluated a series of spectral indices to estimate canopy water mass of maize and the global coefficients of determination of several indices were over 0.70. In addition, hyperspectral camera was also used. Moshou et al.[132] extracted spectral features from hyperspectral images to detect the water stress of wheat. They applied least squares SVM to analyze spectral data and selected six indices whose central wavelengths at 503 nm, 545 nm, 566 nm,
608 nm, 860 nm and 881 nm, respectively. Rossini et al.[133]
acquired hyperspectral data from airborne imagery and verified that photochemical reflectance index had good performance in measuring water stress.
4.2.4 Comparison and analysis of water stress measurements The measuring region of thermometer is small and the measurement accuracy depends on the vegetation. Thermography is able to provide temperatures of a region, offering an opportunity to directly monitor the global variations, especially in the UAV measurement. However, the region of interested of thermal image was determined manually in general[127], and the view field of
sensors also has an effect on the measurement of canopy temperature [134] and the resolution of thermal resolution need to be improved. Although some spectral indices were closely related to water potential and stomatal conductance, canopy temperature and relevant parameters were still recommended as the best indicators of water stress[133,135].
The measurement of water stress still presents some problems that need to be solved. First, thermal measurement is easily affected by dynamic variations in environmental factors, including solar radiation, cloud cover, wind speed, air temperature, humidity, VPD, etc [136], and the time of measurement also influence the results, all of these interferences should be taken into account. Second, canopy temperature changes vary with canopy architecture, plant height, soil coverage, leaf angle and other factors, all of which need to be considered. Combining different sensors or parameters together to measure water stress is feasible in order to improve the accuracy. Besides, fluorescence was also put forward to measure water stress, which is more sensitive to water stress[119,137].
4.3 Biomass measurements
obtained according to the methods mentioned in the previous sections. The following sections will introduce the measurement methods of biomass in detail.
4.3.1 Biomass measurement using non-spectral method
Non-spectral method focuses on measuring the plant height. Similar to the trunk in trees[139,140], the plant stem accounts for the majority of the entire plant weight. Given that plant height is basically up to the stem, height is one of the significant parameters for above-ground biomass prediction model in a few studies[141-144]. Lidar was adopted to measure the height of rice, oilseed rape, winter rye, winter wheat, and grassland. Linear regressions were conducted, and the results demonstrated strong coefficients of determination between above-ground biomass and plant height in the range of 0.60-0.99[141,144]. Fricke et al.[145] installed an ultrasonic sensor on a vehicle to measure sward height. The results were used as the input data to predict forage biomass, and the mean residuals ranged between 0.893 and 1.672. Notably, the accuracy was high if no mixture was present in the sward. Estimating biomass based on plant height is promising but the further improvements are needed. Vegetation coverage should be considered[143], especially at the early growth stage of plant. Li et al.[146,147] used airborne lidar to derive the LAI and height of maize in northwest and north China, and then estimated biomass, thus improving measurement accuracy and efficiency.
4.3.2 Biomass measurement using spectral method
Spectral methods mostly measure certain vegetation indices and nitrogen content of a plant using numerous spectral sensors or cameras. Nitrogen status is a primary component of plants and plays a vital role in contributing to biomass. Biomass accumulation is strongly related to nitrogen application rates[148]. NIR regions were applied to measure nitrogen and estimate biomass. SPAD and ASD FieldSpec were widely used, and prediction models were developed based on the hyperspectral reflectance of plant canopy[149-151]. Gnyp et al.[152,153] proposed a vegetation index with the use of a multi-band combination in the NIR and short-wave infrared domains to develop biomass model, which can improve the estimation of above ground biomass. Furthermore, Mistele and Schmidhalter[154,155] conducted a few vehicle-based measurement studies by using spectral sensors. Erdle et al. [156] compared a bi-directional passive radiometer and three active sensors (CropCircle, GreenSeeker, and an active flash sensor) and calculated several vegetation indices. The results demonstrated that the active sensor is more flexible. Parameters related with nitrogen, such as NDVI and simple R780/R740 ratio[154-156], are strongly related to plant biomass. Considerable research also showed that the canopy architecture has an effect on the estimation of biomass, the correlation coefficient between LAI and biomass was 0.96[156], and the vertical biomass distribution of maize is a bell shape. Hence, considering the canopy parameters is necessary to estimate plant biomass[151].
4.3.3 Combined method for biomass measurement
The potential of combining non-spectral and spectral methods to estimate above-ground biomass is currently being explored. Plant height and several indices related with nitrogen content are being used to refine the prediction models and improve the estimation of above-ground biomass. At the early stage of maize, Montes et al.[157] employed light curtain and spectral reflectance sensor to estimate biomass with SVM regression from V4 (collar of 4th leaf unfolded) to V8 (collar of 8th leaf unfolded). The results showed
very high values of repeatability. Freeman et al.[158] used
GreenSeeker to collect NDVI and combined it with plant height to
predict biomass during the V8 to V10 (collar of 10th leaf unfolded) stage of maize. Hyperspectral measurement with ASD FieldSpec can be used to calculate vegetation indices, such as NDVI, normalized reflectance index, renormalized difference vegetation index, and red edge inflection point. These indices fused with plant height derived from lidar or ultrasonic can be used to estimate biomass[149,159].
4.3.4 Comparison and analysis of biomass measurements Studies have shown that plant height is a significant parameter for estimating plant biomass. This parameter is also the measurement key of the non-spectral method. Water and nitrogen concentration of plant will affect the estimation of biomass. These two parameters can be measured by spectral methods, but the results will be disturbed by weather, vegetation coverage, and soil. Plant height as well as nitrogen and water concentration are regarded as the fundamental parameters for estimating plant biomass. These parameters can be combined to estimate plant fresh weight and dry weight, and thus to improve the accuracy and robustness of measurement.
5 Comprehensive phenotyping platforms
Although there is a wealth of researchers pay attention to measuring phenotyping parameters, most studies just focus on one or a limited number of parameters. In order to facilitate high-throughput phenotyping, the usability of comprehensive phenotyping platforms that are able to measure multiple phenotypic traits should be further investigated. Numerous research institutions have already developed some phenotyping platforms that integrate various sensors. In terms of measurement type, these platforms could be classified into two types, one is the vehicle-based platform, the other is the aerial platform.
5.1 Vehicle-based phenotyping platform
In general, the vehicle-based phenotyping platform was driven by a tractor or human pull[160-162]. Sensors were installed on different positions and heights of platforms in accordance with the plant varieties and the growth stages. Additional accessories include power system, data collection terminal, GPS receiver, encoder and others, which are also necessary for the vehicle-based system to work. Several representative phenotyping platforms are illustrated in Table 4, including “BreedVision” designed by Busemeyer et al.[163], “Phenomobile” designed by Deery et al.[164],
and two platforms based on tractors[160,161]. Phenotype
measurement research has large value for application as well as vast market potential and development prospects, many commercial applications have been developed by companies. As listed in Table 4, Blue River Technology designed a vehicle-based measuring platform with several sensors and multiple observed views[162], LemnaTec developed the Scanalyzer Discovery platform for field phenotyping[165].
Table 4 Description of the vehicle-based phenotyping platforms
Research institution Sensor type Phenotype parameter
University of Applied Sciences
Osnabrück[163] Color digital camera, Range camera, Laser sensor, Hyperspectral camera, Light curtain, GPS receiver, Rotary encoder Plant height, Plant coverage, Tiller density, Nitrogen
University of Arizona[160] Sonar sensor, Multispectral camera, Crop Circle ACS-470, Infrared
radiometer, GPS receiver Plant height, Chlorophyll, NDVI, Canopy temperature Kansas State University[161] Laser sensor, Crop Circle ACS-470, GreenSeeker, thermometer,
Ultrasonic sensor, GPS receiver Plant height, Canopy termperature, NDVI High Resolution Plant Phenomics
Centre[164] Color digital camera, Lidar sensor, GreenSeeker, Hyperspectral camera, Thermometer, Thermography, GPS receiver, Wheel encoder Plant height, NDVI, LA/LAD, Biomass, Canopy temperature
LemnaTec[165] Color digital camera, Laser sensor, Hyperspectral camera, Thermography,
Fluorescence sensor, CO2 sensor, radiometer
Plant height, NDVI, Nitrogen, Plant coverage, Water stress
Blue River Technology[162] Color digital camera, Lidar sensor, Multispectral sensor, Thermography,
pyranometer, GPS receiver
Plant height, NDVI, Leaf angle, LAI, Canopy temperature
Table 5 Description of the autonomous robot phenotyping platforms
Platform Sensor type Phenotype parameter
Vinobot [166] Stereo camera, Lidar sensor, GPS receiver, RFID reader, pyranometer,
Temperature sensor, Humidity sensor Plant height, LAI
BoniRob [167,168] Color digital camera, Range camera, Lidar sensor, Hyperspectral camera,
Light curtain, GPS receiver, Rotary encoder
Plant height, Plant coverage, Spectral reflection, Biomass, Stem thickness, Spacing in the row
Robotanist [169] Color digital camera, Stereo vision, Range camera, Lidar sensor, GPS
receiver, Attitude and heading reference system Leaf angle, Plant greenness
5.2 Aerial phenotyping platform
The aerial platform was first applied on the plant phenotype measurement a few years ago. Notably, the measuring area and the measuring efficiency of aerial platform are more extensive than those of vehicle-based measurement. The aerial platform is also universal to most plants. Typical types of the aerial platform are aircraft, rotary wing, fixed wing, and helicopter. Aircraft is difficult to be moved and is easily obstructed by wind. Rotary wing aerial vehicle is flexible and can fly at any altitudes with low
speed. Fixed wing aerial vehicle has long flight time, but its speed and flight altitude are high, which may result in image loss[4]. The helicopter structure is complex and the maintenance tasks are heavy[170]. Among the aerial platform, rotary wing aerial vehicle and fixed wing aerial vehicle are the most widely used. Limited to the payload, sensors installed on the aerial phenotyping platform is less than the vehicle-based platform, and several representative phenotyping platforms are illustrated in Table 6.
Table 6 Description of the aerial phenotyping platforms
Country Type Sensor type Phenotype parameter
Switzerland[171] Aircraft Color digital camera, Multispectral camera, thermography LAI, NDVI, Plant coverage, Canopy temperature
Americ[81] Rotary wing
Fixed wing
Color digital camera, Multispectral camera, GPS receiver, Inertial
measurement unit Plant height, NDVI, LAI
Australia[170] helicopter Color digital camera, Multispectral camera, thermography Plant coverage, Crop lodging, Canopy temperature
5.3 Comparison and analysis of phenotyping platforms The vehicle-based platforms could measure plant phenotyping parameters with close distance, and a high performance terminal that could receive and process all kinds of sensor data is of great importance. Lidar, GPS, gyroscope, and other sensors make automatic navigating possible, as well as generate the phenotypic character distribution map of plant. However, a vehicle-based platform has the potential to damage a plant, especially at the late stage of a plant. Every platform is unique and will be restricted by row space, in-plant space, and plant height. Hence, these platforms can have difficulty measuring different types or stages of plant. Although the image resolution, security and payload of the aerial platform still have to be improved, this kind of platform has a large application potential in plant phenotyping[4,172].
6 Conclusions
Phenotype measurement research can improve the efficiency of genomic research and promote its development. In this paper, the measurement methods of several morphometric and physiological parameters in phenotyping are summarized. Related sensors are introduced and existing problems are discussed.

![Figure 2 Theoretical overestimate of reflection point height by lidar[29]](https://thumb-us.123doks.com/thumbv2/123dok_us/600774.2059567/4.595.43.286.460.623/figure-theoretical-overestimate-reflection-point-height-lidar.webp)
![Figure 3 Leaf parameters measurement by color digital cameras[47]](https://thumb-us.123doks.com/thumbv2/123dok_us/600774.2059567/6.595.44.287.655.773/figure-leaf-parameters-measurement-color-digital-cameras.webp)
![Figure 6 Structure of hyperspectral image data cube[92]](https://thumb-us.123doks.com/thumbv2/123dok_us/600774.2059567/8.595.335.518.307.463/figure-structure-of-hyperspectral-image-data-cube.webp)
![Figure 7 3D point cloud with a hyperspectral texture at different views [111]](https://thumb-us.123doks.com/thumbv2/123dok_us/600774.2059567/9.595.312.553.667.765/figure-d-point-cloud-hyperspectral-texture-different-views.webp)
![Figure 8 Comparison the field-of-view (FOV) of ChlF and spectral sensors [104]](https://thumb-us.123doks.com/thumbv2/123dok_us/600774.2059567/10.595.44.287.454.610/figure-comparison-field-view-fov-chlf-spectral-sensors.webp)
![Figure 9 Spatial CWSI images[127]](https://thumb-us.123doks.com/thumbv2/123dok_us/600774.2059567/11.595.107.488.142.324/figure-spatial-cwsi-images.webp)

