Study of the correlation between foliar and patternator deposits in
a “tendone” vineyard
Simone Pascuzzi
1*, Francesco Santoro
1, Giuseppe Manetto
2, Emanuele Cerruto
2 (1. Department of Agricultural and Environmental Science (DiSAAT), Via Amendola, 165/A - 70125 Bari, University of Bari Aldo Moro, Italy; 2. Department of Agricoltura, Alimentazione e Ambiente (Di3A), Via S. Sofia, 100 – 95123 Catania, University of Catania, Italy)Abstract: The correct sprayer setting is a key point in all phytosanitary treatments to optimise efficacy and reduce environmental impact. The goal can be achieved with the appropriate choice of the operative parameters such as forward speed, airflow rate, volume rate, working pressure and nozzle types. Moreover, sprayer calibration requires adapting the distribution profile, i.e. the spatial distribution of the sprayed mixture, according to the geometrical and morphological features of the target. Distribution profiles may be assessed by using special patternators able to intercept the spray jet. The present paper analysed the correlations between distribution profiles, leaf area index (LAI) and foliar deposits measured during treatments in a “tendone” vineyard. All correlations between patternator deposits and LAI of the vineyard and between foliar deposits and patternator deposits were statistically significant, with determination coefficients ranging from 0.724 to 0.999. These results demonstrate the importance of patternators as powerful tools during the sprayer calibration process.
Keywords: sprayer calibration, leaf area index, distribution profiles
Citation: Pascuzzi, S., F. Santoro, G. Manetto, and E. Cerruto. 2018. Study of the correlation between foliar and patternator
deposits in a “tendone” vineyard. Agricultural Engineering International: CIGR Journal, 20(3): 97–107.
1 Introduction
Apulia and Sicily (Southern Italy), according to the Italian National Institute of Statistics, are the Italian regions whit the highest production of table grape (Chinnici et al., 2013; Spampinato et al., 2013; ISTAT, 2016). The typical vine training system is the “pergolato” or “tendone”, whose primary characteristic is the arrangement of the canopy on an unbroken horizontal plane, sustained by a main grid of steel wires at 1.7-1.8 m above the ground, in turn supported by stakes placed near the vines (Pascuzzi and Cerruto, 2015a).
Protection of table grapes usually requires about 30 treatments in the period April-November; volume rates range from 500 up to 1000 L ha-1. The most employed machines are conventional air-blast sprayers fitted with an axial-flow fan and an arc-shaped spray boom, or mist
Received date: 2017-10-08 Accepted date: 2018-10-12 *Corresponding author: Pascuzzi Simone, Department of
Agricultural and Environmental Science (DiSAAT), University of Bari Aldo Moro, Italy. Tel: +39 080 5442214. Fax: +39 080 5442214. Email: [email protected].
blower sprayers equipped with a centrifugal fan and air shear nozzles, generally trailed by narrow-track wheeled tractors (Pascuzzi, 2015; Cerruto et al., 2008). Electrostatic mist blower sprayers are also used for the application of biostimulants (Pascuzzi and Cerruto, 2015b). Enhancement in electrostatic nozzle design in terms of electrode material, dimensional shape, size, charge-to-mass ratio, distance from the target, have shown that it is possible to increase deposition and reduce off-target losses (Zhao et al., 2008; Patel, 2016; Patel et al., 2016; Patel et al., 2017).
exclusively from the bottom. Furthermore, the subdivision of the canopy into two specialised layers, upper layer (over the main grid) with only leaves and lower layer (under the main grid) with only grapes, located in some areas only, requires a careful choice of the operating parameters of the sprayer and a proper adjustment of the distribution profile, i.e. of the spatial distribution of the sprayed mixture, especially when targeted treatments are necessary (Pascuzzi, 2013).
The assessment of the distribution profiles requires suitable patternators during the preliminary calibration of the sprayer to adjust the nozzle orientation according to the target features (Pessina, 2000; Balsari et al., 2002; Pergher, 2004; Pascuzzi, 2016), whereas operating parameters such as volume rate, airflow rate, dose per hectare, foliar spray coverage and deposit, can be chosen on the basis of suitable mathematical models referring to the canopy structure such as crown height, leaf wall area, tree row volume, tree area density (Gil et al., 2007; Pergher and Petris, 2008; Friso et al., 2015; Cerruto et al., 2016; Cerruto et al., 2017). Simulations with appropriate mathematical models may also be useful in assessing other aspects of treatments such as spray drift pattern (Baetens et al., 2007; Fujimoto et al., 2016) or pesticide residues on the target (Joyosemito and Tokai, 2016).
2 Usefulness of spray profile assessment
A spray profile is a diagram showing the amount of sprayed liquid, measured at established spacing along the main axis of the target (canopy or other). This axis may be horizontal for herbaceous crops, or vertical if the canopy of the tree crops is predominantly developed on a vertical plane, or it may be arranged in different ways (partially horizontal, sloping, vertical) for orchards trained as “tendone”, “pergola” and so on. Evaluation of spray diagrams requires suitable test benches (patternators), horizontal, vertical or ad hoc shaped, fitted with intercepting tools able to collect the sprayed liquid.
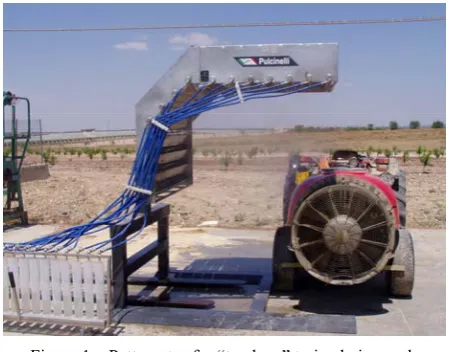
Spray patternators for arboreal crops can be of different types (with horizontal or vertical lamellae, with trays, inclined or not, with slim sponges) and with different shapes also adaptable to complex geometries of the vegetation as that of the “tendone” (Figure 1) (Guarella and Pascuzzi, 2000).
Figure 1 Patternator for “tendone” trained vineyards
All patternators mimic the behaviour of the vegetation that intercepts the mixture sprayed during the phytosanitary treatments and all are used to obtain information useful to improve uniformity of deposition and to reduce off target losses. Special patternators may also be used to evaluate drift from boom sprayer (Balsari et al., 2007; Baldoin et al. 2008; Grella et al., 2017; Nuyttens et al. 2017).
The assessment of the spray profile by means of a patternator is not necessary to evaluate the functionality of the sprayer in professional use, but it is useful for its calibration so that the spray plume matches the target profile. This calibration should be executed for each crop type and vegetative stage present in the farm or at least for the most representative ones. The setting of the sprayer, according to measurements and evaluation of the distribution profile, is carried out by acting on nozzles (type, number and inclination), air flow or other components (depending on the characteristics of the sprayer and the directives provided by the manufacturer). The use of patternators during sprayer calibration is also covered by the Italian legislation (Legislative Decree no. 150, 2014, that transposes the European Directive 2009/128/EC, and Ministerial Decree of 22 January 2014, that adopts the National Action Plan for the sustainable use of pesticides as stated in the same Legislative Decree no. 150, 2014).
al., 2008; Sarri et al., 2014).
The analysis of the spray profile allows assessing the quality of the spray application with respect to the target characteristics, such as the size of the canopy, its shape and the leaf area index (LAI) variation. In this way it becomes possible to evaluate the amount of mixture directed towards the target and its uniformity, as well as the off-target losses. Furthermore, any spray asymmetries between the profiles concerning the left and right sides of the machine can be detected. With the aim to optimise the spray profile diagram according to a predefined criterion, it will be possible to adjust or modify, depending on the case, nozzle types and their inclination, position of the air deflectors, amount of air flow produced by the fan, and so on.
Aim of this paper is to study the correlation between foliar and patternator deposits measured during simulated treatments in a “tendone” vineyard. The results may provide information useful for sprayer calibration in sprayer workshops.
3 Material and methods
3.1 The vineyard
Field tests are those described in Pascuzzi et al. (2016), here summarised for understanding needs. They were aimed at evaluating the effects of airflow rate and volume rate on foliar deposits. To take into account the vegetative development of the vineyard, they were repeated in two phenological stages: full flowering (BBCH (Biologische Bundesanstalt, Bundessortenamt and CHemical industry) code = 23), and berry touch (BBCH code = 34).
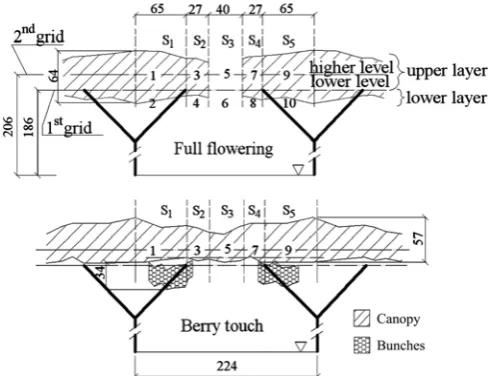
The vineyard was a double-grid “tendone” with a layout of 2.24 × 2.24 m, located in a farm in the Province of Bari (Apulia, Italy). The main grid (1.86 m above ground level) split the canopy into two layers (lower layer and upper layer) and the secondary one (2.06 m above ground level) split in turn the upper layer into two levels (higher level with the growing shoots and lower level with the fruit-bearing shoots). The iron wires forming the first grid were used as reference to delimit five contiguous sectors (from S1 to S5) and two layers from
which to carry out the foliar sampling to measure the deposits. Sectors, layers, foliar sampling zones and
average geometric profile (thickness) of the canopy in the two phenological stages are shown in Figure 2.
Figure 2 Canopy structure in the two phenological stages (sizes in cm). Labels from 1 to 10 refer to the foliar sampling zones and
from S1 to S5 to the five contiguous sectors of the vineyard
The average LAI profile across the sectors was adopted as reference for adjusting the orientation of the nozzles of the sprayer; the adjustment was performed based upon the distribution profiles measured by using a patternator. The LAI in each phenological stage was estimated by measuring the average ratio foliar surface-to-foliar mass of all the leaves belonging to a random sample of 15 shoots according to Equation (1):
1
1 n i
i i
S r
n = m
=
∑
(1)where, Si and mi are surface and mass of the ith leaf and n
is the number of sampled leaves. The mass of each leaf was measured by using a precision balance and the surface was measured by analysing its image, acquired by means of a scanner settled at 300 dpi, with the image processing software Image Pro Plus (Media Cybernetics). Then, using the iron wires of the first grid as reference, rectangular surfaces one meter long and as wide as the sectors Si (i = 1, 2, …, 5) were considered and all the
leaves inside them were picked and weighed. Finally, the LAI of the ith sector was calculated according to Equation
(2):
i i
i r M LAI
A ⋅
= (2)
where, Mi is the mass of all the leaves inside the i
th sector
and Ai its rectangular ground surface considered. The
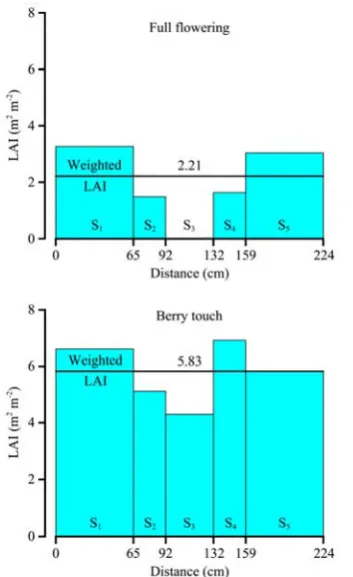
stage and the average LAI profiles across the inter-rows are shown in Figure 3 for both phenological stages. Almost no vegetation at full flowering phenological stage was present in the central sector S3 due to the little
development of the canopy at the time of testing. The LAI of the vineyard was calculated by averaging LAIi
values, assuming widths of sectors as weighting factors. Computed values were 2.21 and 5.83 m2 m-2 at full flowering and berry touch phenological stage, respectively.
Figure 3 Vineyard LAI profiles across the sectors in both phenological stages
3.2 The sprayer and the patternator
Spraying tests were carried out by using a towed sprayer (Projet “Maxi 660” model), equipped with 600 L main tank, two counter-rotating fans (diameter 700 mm) with anterior intake, and an arc-shaped spray boom fitted with 5+5 Albuz ATR 80° hollow cone nozzles (Figure 4). This type of sprayer is widely used for PPP application in “tendone” vineyards. Its main advantage over conventional single-fan sprayers is the symmetry of air velocities on the two sides of the machine coming from the adoption of two counter-rotating fans. The sprayer was settled to operate in both phenological stages with two airflow rates (standard = 5.71 m3 s-1 and reduced = 2.43 m3 s-1) and two volume rates (standard = 624– 626 L ha-1 and reduced = 335–337 L ha-1), according to a
full factorial design. Tractor speed (1.1 m s-1) and power
take-off (PTO) rotation speed (57 rad s-1) were kept unchanged across all the tests. The two airflow rates were obtained by changing the gearbox ratio of the fans and reducing the air inlet section. They were calculated by measuring the air speed at the outlet side according to the technical standard for ISO (2000). The different volume rates were obtained by changing nozzle type, number of open nozzles and working pressure. Average nozzle flow rates were measured for each sprayer setting (nozzle type and working pressure) according to ISO (1997, 2013). A summary of all the operating parameters during the tests is reported in Table 1.
Figure 4 The sprayer Projet “Maxi 660” used for the experimental tests
Table 1 Sprayer settings during the field tests (tractor speed = 1.1 m s-1 and power take-off rotation speed = 57 rad s-1 were
kept constant across all the tests)
PS(a) SS(b) Airflow rate
(m3 s-1)
Nozzle colour(c)
Open nozzle,
no.
Pressure (MPa)
Nozzle flow rate (L min-1)
Volume rate (L ha-1)
1 2.43 yellow 2+2 1.8 5.0 335 2 2.43 red 2+2 1.5 9.3 624 3 5.71 yellow 2+2 1.8 5.0 335 FF
4 5.71 red 2+2 1.5 9.3 624 5 2.43 brown 3+3 2.0 5.0 337 6 2.43 orange 3+3 1.5 9.4 626 7 5.71 brown 3+3 2.0 5.0 337 BT
8 5.71 orange 3+3 1.5 9.4 626 Note: (a) PS: phenological stage; FF: full flowering; BT: berry touch; (b) SS: sprayer setting; (c) Nozzle colour: European colour code of Albuz ATR 80° hollow cone nozzles.
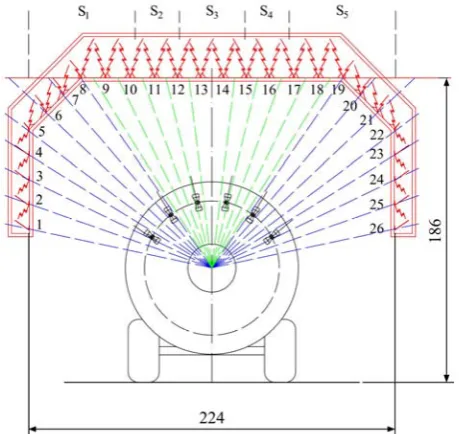
manufacturer, has a metallic structure with vertical, oblique and horizontal development that evokes the shape of the “tendone”. It is equipped with 15 interceptors made of thin steel sheets 1450 mm long and 80 mm wide: four are placed in the vertical trait, four in the oblique one, and seven in the horizontal one. Interceptors in the vertical trait measure the spray mixture directed towards the vine trunk, those in the oblique trait measure the mixture directed towards the main vine branches, and those in the horizontal trait measure the mixture sprayed towards the horizontal canopy.
During the calibration process, the sprayer is stationary and placed in such a way that the distance between its axis and the vertical trait of the patternator is equal to half the inter-row of the vineyard. Moreover, the patternator is adjusted so that the height of its horizontal trait is equal to that of the first grid of the vineyard. The amount of sprayed liquid collected by each interceptor is conveyed in graduated 600 mL Plexiglas containers via flexible drain pipes. Measurements are carried out for the two sides of the sprayer separately and then data are combined in such a way to obtain a unique distribution pattern as shown in Figure 5.
Figure 5 Geometric scheme of sprayer and patternator adopted for the calibration process. From S1 to S5: vineyard sectors;
from 1 to 26: patternator interceptors
3.3 Field tests and foliar deposits measurement
Field tests consisted in spraying a mixture containing a food dye tracer (yellow tartrazine, Sigma Chemical) at
nominal concentration of 4.0 g L-1. Three adjacent
inter-rows about 14 m long were chosen as experimental plots. Each sprayer setting was replicated three times per phenological stage according to a randomized block design.
After spraying, a number of leaves were randomly sampled from the two layers and the five sectors of the canopy to assess foliar deposition (Figure 2). On the whole, 48 leaves per replication (144 per treatment) were sampled at full flowering phenological stage, and 30 per replication (90 per treatment) were sampled at berry touch phenological stage. No leaves were sampled from sector S3 at full flowering phenological stage due to the
little development of the canopy, and no leaves were sampled from lower layer in berry touch phenological stage as green pruning operations had removed from it all the leaves and the non-fruit-bearing shoots.
Each sampled leaf was placed in a Petri dish, stored in dark conditions, and then carried into the laboratory to measure the deposit. Measurements were carried out based upon a spectrophotometric technique (Pergher, 2001; Cerruto et al., 2018). A known quantity of distilled water (50 mL) was added to a Petri dish containing a leaf, the Petri dish was shaken manually for about 30 s, and, after waiting for about 30 min, the absorbance of the washing mixture was measured by using a spectrophotometer (6300 model, Jenway Ltd) at a wavelength of 426 nm. The volume of sprayed mixture deposited per unit of leaf surface (unitary deposit) was calculated according to Equation (3):
1000 2
L
m V ABS d
ABS S
= (3)
where, d is the unitary deposit (µL cm-2); ABS the
absorbance of the sample washing mixture; ABSm the
absorbance of the mixture sprayed in field, sampled at the nozzle output; VL = 50 mL the quantity of water added to
each Petri dish, and S (cm2) the leaf surface (one side only).
The effects of sprayer settings (airflow rate and volume rate) and canopy sampling locations (layer and sectors) on foliar deposits, normalised to the common
volume rate of 480 L ha-1 to make all comparisons
3.4 Correlations between LAI profiles, foliar
deposits, and patternator deposits
The correspondence between vineyard sectors and patternator interceptors was based upon the system geometry. Supposing a radial distribution of the sprayed liquid with respect to the sprayer axis (Figure 5), the quantity of liquid Q(Si) assigned to the sector Si was
calculated according to Equations (4):
1 5 6 7 8 9 10
2 10 11 12
3 12 13 14 15
4 15 16 17
5 17 18 19 20 21 22
(S ) 0.7
(S ) 0.3 0.6
(S ) 0.4 0.4
(S ) 0.6 0.3
(S ) 0.7
Q Q Q Q Q Q Q
Q Q Q Q
Q Q Q Q Q
Q Q Q Q
Q Q Q Q Q Q Q
= + + + + + ⋅ ⎧ ⎪ = ⋅ + + ⋅ ⎪⎪ = ⋅ + + + ⋅ ⎨ ⎪ = ⋅ + + ⋅ ⎪ ⎪ = ⋅ + + + + + ⎩ (4)
where, Qi is the quantity of liquid collected by the ith
interceptor. To make all profiles comparable, raw data measured at the patternator were rescaled in such a way to respect the constraint expressed by Equation (5) (mean value between all sprayer’s settings was 1166 mL):
5
1
(S ) 1000 mLi
i Q =
=
∑
(5)In these calculations, the quantity of liquid collected by the interceptors present in the vertical traits of the whole patternator profile (from 1 to 4 and from 23 to 26, Figure 5), simulating the vine trunks, was not considered.
The preliminary sprayer calibration procedure was based upon the analysis of the correlation coefficients between LAIi and Q(Si) values for each vineyard
phenological stage and for each sprayer setting. In all calculations, LAIi values (Figure 3) were weighted on the
basis of the sector widths (Figure 2) according to Equation (6): i i wi w LAI LAI w ⋅
= (6)
where, LAIwi is the weighted LAI of the sector Si and w =
2.24 m the inter-row distance of the vineyard. A spreadsheet was prepared with the appropriate formulae that, after inputting the amount of liquid collected by each interceptor of the patternator, provided the required correlation coefficient. The trial-and-error procedure was stopped when no further improvement occurred by changing the nozzle orientation.
Subsequently, on the basis of foliar deposit and LAI values, the quantity of mixture Vi per unit of row length
deposited on the ith sector of the vineyard was calculated
according to Equation (7):
10 2 1 (mL)
i i i i
V = ⋅ ⋅ ⋅d LAI ⋅ ⋅w (7)
where di is the average (not normalised) foliar deposit
(μL cm-2, Equation (3)), LAIi (m2 m-2) the leaf area index
and wi (m) the width of the sector Si; 1 (m) is the
reference length, the factor 2 considers the LAI calculation referred to both leaf surfaces, and the factor 10 is used to express Vi values in millilitres. To assess the
correspondence between patternator deposits and volumes of mixture deposited on the canopy of the vineyard, upon which the sprayer calibration procedure is based, the coefficients of correlations between Vi and Q(Si) values were investigated.
All the statistical analyses and graphical representations were carried out by using the open source software R (R Core Team, 2013).
4 Results and discussion
4.1 Correlation between LAI and patternator
deposits
Figure 6 and Figure 7 show the relationships between weighted LAI (Equation (6)) of vineyard sectors and patternator deposits (Q(Si) values after rescaling,
Equation (7)) at full flowering and berry touch phenological stage respectively. Each of the five points in a sub-plot refers to a sector of the canopy and then to a set of interceptors of the patternator. The linear trends were always highly significant and the coefficients of determination ranged from 0.894 to 0.983. The line slope was about 0.196 L per unit of LAI at full flowering and about 0.527 L per unit of LAI at berry touch phenological stage: their ratio (2.69) reflects the increase in the vineyard LAI value from 2.21 at full flowering to 5.83 at berry touch (ratio 2.64, Figure 3).
plausible that a fraction of this spray goes on the canopy or the grapes of the adjacent rows.
Figure 6 Correlation between patternator deposits and weighted LAI at full flowering phenological stage
Figure 7 Correlation between patternator deposits and weighted LAI at berry touch phenological stage
4.2 Correlation between foliar and patternator deposits
Table 2 reports the average foliar deposits (not normalised) in the canopy sampling locations at varying the sprayer settings in both phenological stages (Table 1).
The corresponding relationships between canopy deposits (Vi values, Equation (4)) and patternator deposits
(Q(Si) values after rescaling, Equation (4)) are shown in
Figure 8, Figure 9 and Figure 10 at full flowering phenological stage and in Figure 11 at berry touch phenological stage.
All trends are well described by linear relationships of the form:
Vc=a·Vp+b (8)
where, Vc (mL) is the volume of mixture intercepted by
the canopy (Equation (7)) and Vp (mL) the volume of
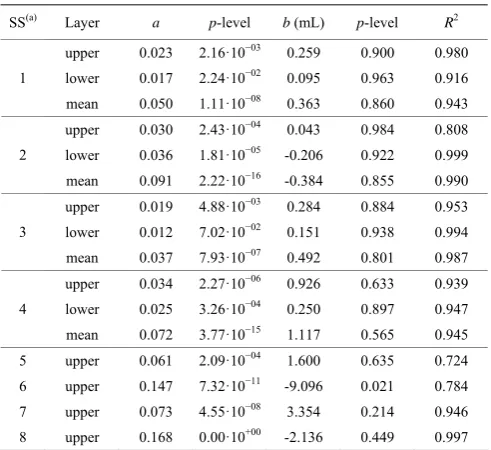
mixture intercepted by the patternator (Equations (4) and (5)). Determination coefficients, all highly significant, ranged between 0.724 and 0.999. The coefficients a and b
of the regressions are reported in Table 3 for each sprayer setting.
Table 2 Foliar deposits (μL cm-2, not normalised) at varying
the sprayer settings
Sectors SS(a) Layer
S1 S2 S3 S4 S5
upper 0.327 0.256 0.280 0.370 lower 0.814 0.579 0.364 0.703 1
mean 0.570 0.417 0.322 0.537 upper 0.537 0.379 0.234 0.305 lower 1.384 1.197 0.785 1.610 2
mean 0.961 0.788 0.510 0.958 upper 0.356 0.201 0.153 0.233 lower 0.601 0.270 0.277 0.524 3
mean 0.479 0.236 0.215 0.378 upper 0.636 0.321 0.384 0.480 lower 1.332 0.514 0.419 1.002 4
mean 0.984 0.418 0.401 0.741 5 upper 0.217 0.206 0.221 0.342 0.316 6 upper 0.407 0.286 0.265 0.290 0.510 7 upper 0.332 0.301 0.313 0.298 0.404 8 upper 0.662 0.426 0.524 0.408 0.737 Note: (a) SS: sprayer setting (Table 1).
Table 3 Coefficients of regression (Equation (8)) between patternator and canopy deposits.
SS(a) Layer
a p-level b (mL) p-level R2
upper 0.023 2.16·10−03 0.259 0.900 0.980
lower 0.017 2.24·10−02 0.095 0.963 0.916
1
mean 0.050 1.11·10−08 0.363 0.860 0.943
upper 0.030 2.43·10−04 0.043 0.984 0.808
lower 0.036 1.81·10−05 -0.206 0.922 0.999
2
mean 0.091 2.22·10−16 -0.384 0.855 0.990
upper 0.019 4.88·10−03 0.284 0.884 0.953
lower 0.012 7.02·10−02 0.151 0.938 0.994
3
mean 0.037 7.93·10−07 0.492 0.801 0.987
upper 0.034 2.27·10−06 0.926 0.633 0.939
lower 0.025 3.26·10−04 0.250 0.897 0.947
4
mean 0.072 3.77·10−15 1.117 0.565 0.945
5 upper 0.061 2.09·10−04 1.600 0.635 0.724
6 upper 0.147 7.32·10−11 -9.096 0.021 0.784
7 upper 0.073 4.55·10−08 3.354 0.214 0.946
8 upper 0.168 0.00·10+00 -2.136 0.449 0.997
Figure 8 Correlation between patternator deposits and lower layer canopy deposits at full flowering phenological stage
Figure 10 Correlation between patternator deposits and mean canopy deposits at full flowering phenological stage
Figure 9 Correlation between patternator deposits and upper layer canopy deposits at full flowering phenological stage
Figure 11 Correlation between patternator deposits and upper layer canopy deposits at berry touch phenological stage
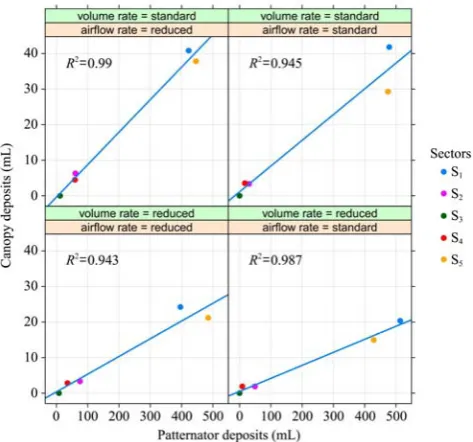
From regression lines in Figures 8-11 and data in Table 3, it emerges that the main factor affecting average canopy deposits (not normalised) is the volume rate; in fact, line slopes with standard volume rates (624- 626 L ha-1) are almost double those with reduced volume rates (335-337 L ha-1).
Limiting the regression analysis to the average canopy deposits (average between the two layers at full flowering phenological stage) and considering volume rate as the only factor affecting deposits, the results shown in Figure 12 are obtained. The two regression lines are highly significant and show a strong correlation
between canopy and patternator deposits; if LAI values of the vineyard are known, they allow estimating average foliar deposits based upon patternator measurements.
5 Conclusions and perspectives
The assessment of the spraying profile is one of the key points in order to maximise the deposits on the target, to increase the uniformity of distribution with respect to the LAI distribution, and to limit the environmental impact. This assumes greater importance with the “tendone” vine training system due to the arrangement of the canopy on an unbroken horizontal plane that can be sprayed by bottom side only.
The results reported in this paper show that the patternator, arranged so to simulate the “tendone” structure, allows a properly calibration of the sprayer before a PPP application. In fact, the data shows a linear and significant correlation between the distribution profile measured with the patternator and the LAI profile of the canopy and between the patternator deposits and the canopy deposits. Moreover, this result occurs at each of the phenological stages tested (full flowering and berry touch).
On the basis of the results it is possible to indicate that the patternator is a useful tool in choosing position and orientation of the open nozzles according to canopy size and geometry. Further tests with different canopy development (different LAI profiles) and with other sprayer models are necessary to confirm the general indications.
All considered, evaluation and optimisation of the spray profile allow:
-lowering the pollution of agrochemicals into the environment;
-improving the effectiveness of the treatment, due to a more uniform distribution of the mixture on the target, sprayed in agreement with the specific characteristics of the crop;
-increasing training and awareness of the operators, which should attend the calibration activities carried out inside the authorised workshops by suitably trained technical staff.
Acknowledgements
The authors equally contributed to the present study. The authors wish to thank C. Gidiuli, V. Marzano and D.
Sfregola of DiSAAT for their helpfulness and commitment in conducting the experimental tests.
References
Baetens, K., D. Nuyttens, P. Verboven, M. De Schampheleire, B. Nicolaï, and H. Ramon. 2007. Predicting drift from field spraying by means of a 3D computational fluid dynamics model. Computers and Electronics in Agriculture, 56(2):
161–173.
Baldoin, C., P. Balsari, E. Cerruto, S. Pascuzzi, and M. Raffaelli. 2008. Improvement in pesticide application on greenhouse crops: results of a survey about greenhouse structures in Italy.
ISHS Acta Horticulturae, 801: 609–614.
Balsari, P., G. Pergher, M. Vieri, G. Ade, P. Guarella, G. Giametta, and G. Blandini. 2002. Usefulness of patternators in calibrating vineyard sprayers. L’Informatore Agrario, 8:
97–108 (in Italian).
Balsari, P., P. Marucco, and M. Tamagnone. 2007. A test bench for the classification of boom sprayers according to drift risk.
Crop Protection, 26(10): 1482–1489.
Balsari, P., G. Doruchowski, P. Marucco, M. Tamagnone, J. Van de Zande, and M. Wenneker. 2008. A system for adjusting the spray application to the target characteristics. Agricultural Engineering International: the CIGR Ejournal, X: Manuscript
ALNARP 08 002.
Cerruto, E., G. Emma, and G. Manetto. 2008. Study of a new model of sprayer for applications in “tendone” vineyards.
Journal of Agriculture Engineering, 39(1): 41–48.
Cerruto, E., S. Failla, D. Longo, and G. Manetto. 2016. Simulation of water sensitive papers for spray analysis. Agricultural Engineering International: CIGR Journal, 18(4): 22–29.
Cerruto, E., G. Manetto, D. Longo, S. Failla, and G. Schillaci. 2017. A laboratory system for nozzle spray analysis. Chemical Engineering Transactions, 58: 751–756.
Cerruto, E., G. Manetto, F. Santoro, and S. Pascuzzi. 2018. Operator dermal exposure to pesticides in tomato and strawberry greenhouses from hand-held sprayers.
Sustainability, 10(7): 2273.
Chinnici, G., B. Pecorino, M. Rizzo, and P. Rapisarda. 2013. Evaluation of the performances of wine producers in Sicily.
Quality - Access to Success, 14(135): 108–113.
Directive 2009/128/EC. 2009. Establishing a framework for Community action to achieve the sustainable use of pesticides. Strasbourg, France: European Parliament and Council of the European Union.
Fox, R. D., R. C. Derksen, J. A. Cooper, C. R. Krause, and H. E. Ozkan. 2003. Visual and image system measurement of spray deposits using water–sensitive paper. Applied Engineering in Agriculture, 19(5): 549–552.
of the dynamics of air jet crossing the canopy of tree crops during pesticide application. Applied Mathematical Sciences,
9(26): 1281–1296.
Fujimoto, A., T. Satow, and T. Kishimoto. 2016. Simulation of spray distribution with boom sprayer considering effect of wind for agricultural cloud computing analysis. Engineering in Agriculture, Environment and Food, 9(4): 305–310. Gil, E., A. Escolà, J. R. Rosell, S. Planas, and L. Val. 2007.
Variable rate application of plant protection products in vineyard using ultrasonic sensors. Crop Protction, 26(8):
1287–1297.
Grella, M., E. Gil, P. Balsari, P. Marucco, and M. Gallart. 2017. Advances in developing a new test method to assess spray drift potential from air blast sprayers. Spanish Journal of Agricultural Research, 15(3): 1-16.
Guarella, P., and S. Pascuzzi. 2000. Test bench for calibration of spraying machines used in “tendone” trained vines. Design and operation aspects. Rivista di Ingegneria Agraria, 31(1):
18–23.
ISO (International Organization of Standardization). 1997. Equipment for crop protection – spraying equipment – Part 2: test methods for hydraulic sprayers. ISO 5682-2:1997. Geneva: International Organization for Standardization Publications. ISO (International Organization of Standardization). 2000.
Equipment for crop protection – test methods for air-assisted sprayers for bush and tree crops. ISO 9898:2000. Geneva: International Organization for Standardization Publications. ISO (International Organization of Standardization). 2013.
Agricultural and forestry machinery – environmental requirements and testing for sprayers – Part 3: sprayers for bush and tree crops. ISO 16119-3:2013. Geneva: International Organization for Standardization Publications.
ISTAT (Italian National Statistical Institute). 2016. Table C26 - Area (hectares) and production (quintals): table grapes, wine grapes, wine. Data by Region - Year 2016. Available at: http://agri.istat.it/jsp/dawinci.jsp?q=plC260000010000032101 &an=2016&ig=1&ct=604&id=15A|18A|21A|73A. Accessed 29 May 2018.
Italian Government. 2012. Attuazione della Direttiva 2009/128/CE. Legislative Decree no. 150, August 14, 2012. Supplemento ordinario n. 177/L alla Gazzetta Ufficiale.
Italian Government. 2014. Adozione del Piano d’Azione Nazionale per l’uso sostenibile dei prodotti fitosanitari. Ministerial Decree January 22, 2014. Gazzetta Ufficiale della Repubblica Italiana.
Joyosemito, I. S., and A. Tokai. 2016. A modeling approach to study the pesticide dynamics to reduce pesticide residues in Japanese green tea. Engineering in Agriculture, Environment and Food, 9(4): 311–323.
Nuyttens, D., I. K. A. Zwertvaegher, and D. Dekeyser. 2017. Spray
drift assessment of different application techniques using a drift test bench and comparison with other assessment methods. Biosystems Engineering, 154: 14–24.
Pascuzzi, S. 2013. The effects of the forward speed and air volume of an air-assisted sprayer on spray deposition in “tendone” trained vineyards. Journal of Agricultural Engineering, 44(3): 125–132.
Pascuzzi, S. 2015. A multibody approach applied to the study of driver injures due to a narrow-track wheeled tractor rollover.
Journal of Agricultural Engineering, 46(3): 105–114.
Pascuzzi, S., and E. Cerruto. 2015a. Spray deposition in “tendone” vineyards when using a pneumatic electrostatic sprayer. Crop Protetion, 68: 1–11.
Pascuzzi, S., and E. Cerruto. 2015b. An innovative pneumatic electrostatic sprayer useful for tendone vineyards. Journal of Agricultural Engineering, 46(3): 123–127.
Pascuzzi, S. 2016. Outcomes on the spray profiles produced by the feasible adjustments of commonly used sprayers in “tendone” vineyards of Apulia (Southern Italy). Sustainability, 8(12):
1307–1324.
Pascuzzi, S., E. Cerruto, and G. Manetto. 2016. Foliar spray deposition in a “tendone” vineyard as affected by airflow rate, volume rate and vegetative development. Crop Protection, 91:
34–38.
Patel, M. K. 2016. Technological improvements in electrostatic spraying and its impact to agriculture during the last decade and future research perspectives – A review. Engineering in Agriculture, Environment and Food, 9(1): 92–100.
Patel, M. K., M. Kundu, H. K. Sahoo, and M. K. Nayak. 2016. Enhanced performance of an air-assisted electrostatic nozzle: Role of electrode material and its dimensional considerations in spray charging. Engineering in Agriculture, Environment and Food, 9(4): 332–338.
Patel, M. K., B. Praveen, H. K. Sahoo, B. Patel, A. Kumar, M. Singh, M. K. Nayak, and P. Rajan. 2017. An advance air-induced air-assisted electrostatic nozzle with enhanced performance. Computers and Electronics in Agriculture, 135:
280–288.
Pergher, G. 2001. Recovery rate of tracer dyes used for deposit assessment. Transactions of the ASAE, 44(4): 787–794.
Pergher, G. 2004. Field evaluation of a calibration method for air-assisted sprayers involving the use of a vertical patternator.
Crop Protection, 23(5): 437–446.
Pergher, G., and R. Petris. 2008. Pesticide dose adjustment in vineyard spraying and potential for dose reduction.
Agricultural Engineering International: the CIGR Ejournal, X:
Manuscript ALNARP 08 011.
Pessina, D. 2000. Tools for sprayer inspection. L’Informatore Agrario, 20: 5–13 (in Italian).
Computing. Vienna, Austria: R Foundation for Statistical
Computing.
Salyani, M., H. Zhu, R. D. Sweeb, and N. Pai. 2013. Assessment of spray distribution with water-sensitive paper. Agricultural Engineering International: CIGR Journal, 15(2): 101–111.
Sarri, D., R. Lisci, M. Rimediotti, and M. Vieri. 2014. RHEA airblast sprayer: calibration indexes of the air jet vector related to canopy and foliage characteristics. In: Second international conference on robotics and associated high-technologies and equipment for agriculture and forestry, 73–81. Madrid (Spain),
21–23 May.
Solanelles, F., A. Escolà, S. Planas, J. R. Rosell, F. Camp, and F. Gràcia. 2006. An electronic control system for pesticide
application proportional to the canopy width of tree crops.
Biosystems Engineering, 95(4): 473–481.
Spampinato, D., M. D’Amico, and P. Rapisarda. 2013. Intervention policies and Italian viticulture. Quality - Access to Success, 14
(SUPPL. 1): 272–278.
Walklate, P. J., J. V. Cross, G. M. Richardson, R. A. Murray, and D. E. Baker. 2002. IT—Information technology and the human interface: comparison of different spray volume deposition models using LIDAR measurements of apple orchards. Biosystems Engineering, 82(3): 253–267.