PDM Field Study in Collaborative Engineering
Education – Results from 2016/17
https://doi.org/10.3991/ijoe.v15i04.9753
Andreas Probst(*) HTL Ried, Ried/Innkreis, Austria
Martin Ebner, Martin Schön Graz University of Technology, Graz, Austria
Detlef Gerhard TU Wien, Vienna, Austria
Abstract—This work describes the research activities performed regarding engineering education at Austrian Federal Colleges of Engineering (HTL) in collaboration with both Graz and Vienna Universities of Technology. To pro-vide assistance to collaboration in engineering education, several Austrians HTLs were introduced to a Product Data Management system (PDM). A field study was conducted in the academic year 2016/17 that will continue in 2017/18 to determine how to utilize this type of software and methodology in order to encourage and improve collaboration between students. This paper pre-sents the initial results of the survey, obtained in the academic year 2016/17 and the impression of the lecturers regarding the degree of teamwork exhibited by students within their design projects.
Keywords—Design practice, Product development, Outcomes based assess-ment, Higher education, Engineering Education, Teamwork, Engineering Col-laboration, PDM
1
Introduction
there is no existing research about the progress in collaboration of students using PDM tools. The motivation for the research presented in this paper is to obtain knowledge about how to best utilize these types of software and methods to improve inter-student collaboration.
2
Background and Related Work
This research work is the follow-up to the research study [9] presented at the Inter-national Conference on Interactive Collaborative Learning ICL2017 in Budapest Hungary.
2.1 Collaboration in engineering education
When looking at different methodologies for engineering education, Problem-Based learning and Project-Problem-Based learning can be identified as the two major ap-proaches within previous research.
Mills et al. [10, p. 8] determine in their paper the difference between Problem-Based learning and Project-Problem-Based (PBL) learning in the field of engineering educa-tion. They stated that “Project-Based learning is usually accompanied by subject courses (eg maths, physics etc. in engineering), whereas problem-based learning is not”. Furthermore, they identified Project-Based learning frequently used in K-12 education.
Looking at teaching, Kolmos [11] identifies different teaching roles. For Project-Based learning the role of a “product-oriented supervisor” is compared to a “process-oriented supervisor” in Problem-Based learning scenarios. Additionally, she identifies a difference at the problem-solving level; that project work has more to do with both problem analysis and problem solution than Problem-Based learning which focuses mainly on problem analysis.
Searching for differences between the two approaches Perrenet et al. [12, p. 348] find “Project-Based learning is more directed to the application of knowledge, where-as Problem-Bwhere-ased learning is more directed to the acquisition of knowledge”.
It seems that the Project-Based learning approach is what is generally utilized in Austrian HTLs, especially in labs and engineering design education lessons.
In their paper Johnson and Johnson [13, p. 2] identify five required conditions for team management to get better results than competitive or individual performance”.
• Clearly perceived positive interdependence
• Considerable promotive (face-to-face) interaction
• Clearly perceived individual accountability and personal responsibility to achieve the group’s goals
• Frequent use of the relevant interpersonal and small-group skills
Considering this, students improve their teamwork skills, doing educational design projects in groups after starting their third year out of five.
Oakley et al. [14] identify in their paper several basic conditions to turn student groups into effective teams:
• Ensuring that expectations are reasonable by establishing clear guidelines
• Giving team members useful information on team practices that work well before they begin working with one another
• Effectively handling problems with team members
Regarding the optimal team size, they state that there is no consensus in the litera-ture, but most authors agree that the minimum team size for most team tasks is three and the maximum is five. Two people may not provide enough ideas, skills, and ap-proaches to maximize the outcome of the group work. In addition, conflicts among pairs of people tend to be won by the more dominant partner, even if they are wrong. However, if a team consists of six or more individuals, at least one tends to contribute less than the others. In regard to this, the team size for the field study is determined to be three, four or five team members, depending on the overall number of students attending a class.
In their work Lu et al. [8] distinguishes between coordination, cooperation, and collaboration. Considering his classification (see Table 1) (especially for small stu-dent groups’) collaboration seems to be the most appropriate form of working on common tasks and objectives. They also state that traditional engineering can be iden-tified as a decision process with many technical aspects or “task work” conducted by individuals, whereas collaborative engineering must also be thought of as a social collaboration for the sake of teamwork and reaching agreement between those in-volved
Table 1. “Collective human endeavor characteristics” [8, p. 615]
Stakeholder Resource Goal Task Structure
Coordination Large Community Limited and
Exchanged Multiple & Competing Pre-defined, same layer in hierarchy, uni-direction Cooperation Mid-size Group Limited a
nd Shared
Multiple &
Private Pre-defined, across layers in hierarchy, bi-direction
Collaboration Small Team Limited, Shared
Complementary Single & Common Undefined, non-hierarchical, multi-direction
Furthermore, Lu et al. see “collaborative engineering as the synergy between team-work and task-team-work” [8, p. 620]. They observed the common characteristics of suc-cessful teams within industry, including: [8, p. 610]
• It is best to make joint decisions since these lead to better outcomes than individual decisions.
• All team members have the ability to contribute their own creativity in both the creation and claiming of value when making group decisions
Additionally Lu et al. [8, p. 610] declared “desirable results from a collaborative engineering team should go beyond task-work agreements that meet stakeholders’ competing interests and requirements”. They also state that teams should avoid limit-ing their decision-maklimit-ing process. Instead, they should allow themselves to think of multiple alternative possibilities and solutions.
Lu et al. [8, p. 605] also stated “Although we can recognize the good results of successful collaborations, our ability to re-create the desired collaboration process and train engineers to better collaborate with each other is still very limited”
2.2 PDM in engineering and engineering education
Although PDM and PLM are commonly used in industry, Small and Medium En-terprises (SME) seem to use such tools only when they are part of a supply pyramid. In this case, the Original Equipment Manufacturer (OEM) and their supplier have to develop together and share product data. Schuh et al. [6, p. 211] report in their publi-cation that a survey “in the automotive industry have shown that there is a wide gap between the current implementation status and the state of the art”. Though the re-search mentioned in this rere-search study was done several years ago, the situation has not changed a lot. Duigou et al. [15] described in their paper framework for modeling to support the use of SMEs as part of the implementation process of PLM systems. Despite these facts, the authors of this paper believe that the single source of data is very important for international operating teams, therefore working with PDM pro-grams has to be trained in engineering education classes.
Mamo et al. [16] described a Global Design Exercise between three universities carried out as a project involving collaborative design, in which, for eight weeks, engineering students from various disciplines and cultural backgrounds participated. They investigated “the patterns in the use of design tools by students in engineering design to collaborate with each other”.
One outcome of the project was the information about students’ usage of online tools like Skype, Dropbox, Whatsapp, and Facebook together with professional de-sign tools like CAD to solve a given dede-sign task. In his research work Barrie [17, p. 1] reports about this Global Design Exercise that the “CAD modelling process was con-ducted by a single person with inputs from other team members, mostly via Facebook and Skype”. This lack of usage of design tools seems to show an urgent need for web-based PDM tools, case of use (usability) and a simple user interface.
as well as the possibility to administrate projects and access) seem to be opposed by the effort needed to learn an additional program within students education.
3
Research Questions
Regarding research work three research questions are specified:
RQ1: Can collaboration within the student groups be easily identified and moni-tored?
RQ2: What challenges occurred over the course of the field study?
RQ3: How many of the tasks were completed during the allotted time?
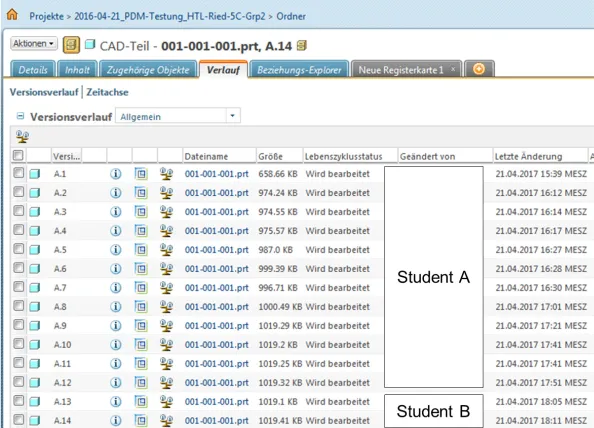
Concerning the first research question the different file versions displayed in Fig-ure 1 of each compulsory file from FigFig-ure 2 are collected in a database. The question is how often students alternately edit and store the different files given within their task. Evaluating all of the data from each student group will provide information about how students collaborate and how they utilized the PDM system.
Fig. 1. Different file versions created by two students within PDM database.
The second research question is about difficulties occurring during the field study which could not be identified from looking into the PDM database. For this reason, student notes in Table 9 and teacher’s observations and notes are evaluated in order to obtain extra information to be used in the field study.
4
Research Methodology of PDM Field Study
4.1 PDM field study set-up
The field study was intended to be conducted within 10 Austrian Federal Colleges of Engineering (HTL) [9] but due to daily business reasons only three HTLs partici-pated in the study in the academic year 2016/17. In the academic year 2017/18, the field study is being continued amongst several other HTLs. For the purposes of the field study, students in the participating classes are split into groups of three or four individuals and must solve the given assignment together using the CAD program in conjunction with the PDM software. The students have a maximum of four hours to complete their tasks and receive no instructions on how they should work together.
Design task and deliverables: The design task is a single stage gear transmission (see Figure 2) where some parts like the gearbox housing already exist and are stored within the PDM database. The figure also shows the deliverables for the PDM field study, however stress calculation or any other calculation of any part is not included in the study. Despite teachers not telling them to do so, students split up the work they are assigned to do between themselves and decide how they will collaborate.
Fig. 2. Design task single stage transmission 2D drawing [20] and 3D CAD model
Instead of giving grades to the student projects, as we first intended [9], the per-centage of completion within the task regarding the following aspects is evaluated:
• Parts displayed in the drawings are producible
• Completed dimensions of the parts
• The necessary surface symbols and tolerances are displayed on the drawings
Parameter used for collecting data: For each group the following data are col-lected.
Pinion shaft Gear Wheel
Output shaft
Bearing cover
Gear assembly
Pinion shaft Gear Wheel
Table 2. Parameter used for calculation
No. Parameter description Sub parameter
1 Austrian Federal Colleges of Engineering (HTL)
2 Group Nr. 3 Students / group 4 Female students / group 5 Percentage of collaboration 6 experience w. PDM [months] 7 Percentage of completion 8 Saved file versions / group
9 Improvements within data conflicts Number of occurrences [quantity] 10 Improvements within data conflicts Time for correction [minutes] 11 3D interface problems Number of occurrences [quantity] 12 3D interface problems Time for correction [minutes] 13 Coordination concerning 2d working draft Number of discussions [quantity] 14 Coordination concerning 2d working draft Time for each discussion [minutes] 15 Working on the same parts or assemblies Number of occurrences [quantity] 16 Working on the same parts or assemblies Time for correction [minutes] 17 Duration of field study
18 Time field study started
19 Semester of field test 1=winter semester / 2=summer semester 20 HTL year
PDM field study data: In Table 3 the collected data from the field study so far are displayed. Data were collected from three different HTLs among four classes with a total of 18 groups consisting of three or four students each. The overall number of students was 68 which included three female students; the subjects of these classes are Mechanical Engineering (MB) or Mechatronics (ME).
Table 3. Overview involved HTL classes PDM field study
Colleges / HTL Graz Wien3 Wien3 Ried Total / remarks
Subject MB ME ME MB
HTL year 3rd 4th 4th 5th
Students’ average age 16 years 17 years 17 years 18 years
Experience w. PDM 3 2 2 1 [months]
Groups / class 4 7 5 2 18
Students / group 4 4 / 3 3 4
Students total 16 26 18 8 68
Female students 3 0 0 0 3
Evaluation time 3:05 3:25 3:25 3:15 [hh:min]
the task entirely. In the table, “A” represents student A, “B” student B etc., therefore one can see that only student D worked with this file and stored it in two versions.
Table 4. Evaluation saved file versions from PDM database
HTL-nnn-Group-x Task %
finished File version
Deliverable File type 1 2 3 4 5 6 7 8 9
Gear assembly assembly 100 B B B B B B B B drawing 100 B B B B
Output shaft 3D part 100 D D drawing 100 D
To evaluate the collaboration for each deliverable (see Table 4) we determine which file version was created by which student and an expectancy value is calculated by dividing the total file versions by the number of students. Afterwards a Chi² func-tion is calculated for each student’s task as well as the sum of all Chi² Values. Lastly, the value for the p – significance is calculated. An example of collected and calculat-ed data for the 3D CAD part of the pinion shaft from Table 4 is shown in Table 5.
Table 5. Evaluation example of students’ collaboration File versions
/Student versions Total Expectancy value Chi² / Student Total File versions /Student
1 2 3 4 1 2 3 4
7 0 0 2 9 2,25 10 2,3 2,3 0 14,6 0,0007
A high Chi² value means a deviation of uniform distribution as well as a low p- significance value, and a low collaboration between students for editing and saving data from the given field test task.
4.2 Evaluation of occurring difficulties in field study
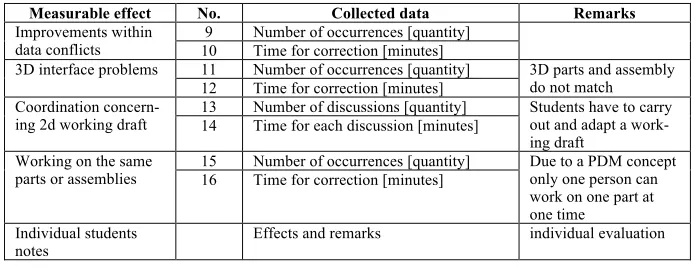
Over the course of the study students were required to take written notes of certain effects which are then evaluated, as seen in Table 6. This gives the opportunity to get information in addition to that gained from the PDM database.
Table 6. Overview pattern of students’ notes for PDM field study
Measurable effect No. Collected data Remarks
Improvements within
data conflicts 10 9 Number of occurrences [quantity] Time for correction [minutes]
3D interface problems 11 Number of occurrences [quantity] 3D parts and assembly do not match 12 Time for correction [minutes]
Coordination
concern-ing 2d workconcern-ing draft 13 Number of discussions [quantity] Students have to carry out and adapt a work-ing draft
14 Time for each discussion [minutes]
Working on the same
parts or assemblies 15 Number of occurrences [quantity] Due to a PDM concept only one person can work on one part at one time
16 Time for correction [minutes]
Individual students
The quantity and minutes are collected from every student’s individual notes but are only processed for a whole group. Teachers were also required to make note of several effects such as the start and end time of the field study as well as individuals’ notes like problems with students’ computers or students leaving the field study early. This will give more accurate information about whether groups are performing effi-ciently or not.
4.3 Evaluation of PDM field study completed tasks
The evaluation of the percentage of finished tasks (see Table 4) is done anony-mously by two teachers according to given criteria that students and teacher know from the beginning of the test. These criteria are:
• Assemblies are complete
• No interface problems like intersections between parts are occurring
• Parts are producible
• Dimensioning of the parts in the drawings is complete
• Expedient surface symbols and tolerances are on the drawings
• No geometrical dimensions and tolerances are needed in the drawings
• Bill of material is present and completed (e.g. material, good part names, …)
5
PDM Field Study Results
5.1 Results for collaboration in field study
A heuristic method of a principal component analysis is used to present the data matrix more simply and manageably, see Table 7. The first four principal components (Table 7, rows 1 to 4) describe 84.55 percent of the total variance. In order to interpret these components, the correlations of the original variables with these most important components 1 to 4 are considered.
For the interpretation, the Variamax rotation method (see Table 8.) has proven to clearly allocate the variables to one of the four factors. Values below 0.25 are not shown in the rotated component matrix.
Since we are particularly interested in the degree of collaboration, the columns with components 3 and 4 in Table 8 are especially interesting since the parameter grade of collaboration only occurs there. In column 4, a higher degree of collaboration is associated with group size and duration of the experience with PDM programs. Since the group size varies only between groups consisting of 3 or 4 group members, this means that the groups of four seem to have a higher degree of collaboration than the groups of three.
Table 7. Principal component analysis based on parameters and collected data Principal
component Sum Variance [%] Accumulated [%]
1 6,434 40,211 40,211
2 3,851 24,071 64,282
3 1,971 12,32 76,602
4 1,272 7,953 84,555
5 0,776 4,852 89,407
6 0,697 4,356 93,763
7 0,514 3,211 96,974
8 0,219 1,372 98,346
9 0,111 0,693 99,039
10 0,092 0,578 99,617
11 0,044 0,275 99,892
12 0,016 0,101 99,993
13 0,001 0,005 99,999
14 0 0,001 100
15 4,52E-05 0 100
16 -1,41E-15 -8,83E-15 100
Table 8. Variamax rotation matrix
Component
1 2 3 4
Students / group -0,359 0,634
Female students / group 0,513 0,499
Percentage of collaboration 0,526 0,581
Experience w. PDM [months] 0,977
Percentage of completion 0,911
Saved file versions / group 0,889
Improvements w. data conflicts -Number of occurrences
[quantity] 0,536 -0,454 0,496
Improvements w. data conflicts - Time for correction
[minutes] 0,757 -0,47 0,345
3D interface problems - Number of occurrences [quantity] 0,901 0,381 3D interface problems - Time for correction [minutes] 0,941
Coordination concerning 2d working draft - Number of
discussions [quantity] 0,945
Coordination concerning 2d working draft - Time for each
discussion [minutes] 0,956
Working on the same parts or assemblies - Number of
occur-rences [quantity] 0,494 0,777
Working on the same parts or assemblies - Time for
correc-tion [minutes] 0,793 -0,455 0,359
Duration of field study -0,608 -0,501 -0,486
Semester -0,977
In an older study [21] 31 studies were reviewed with the conclusions: „group size is an important variable which should be taken into account in any theory of group behavior, and future research on group size should proceed more systematically than in the past. There is no specified group size for most effective task performance.”
three- and four-person groups without conflict did not differ, but three-person groups with coalitions (two vs. one) produced more positive relationships than four-person groups with coalitions (both two vs. two and three vs. one).”
On the site "How to Design Small Decision Making Groups" (http://www.intuitor.com/statistics/SmallGroups.html) we find „Rules for Optimizing Small Groups“ and the recommendation „Groups should have an odd number of members. This prevents ties and improves the odds of making a correct decision when using majority rules.”
We see: There is no specified group size for effective task performance. Obviously, it depends on the situation. According to our data, groups with four members work together more efficiently than those with three. However, the data base is still very thin.
For the next field study in the academic year 2017/18 we plan to divide the stu-dents into equal numbers of groups of three and four.
5.2 Results regarding difficulties in field study
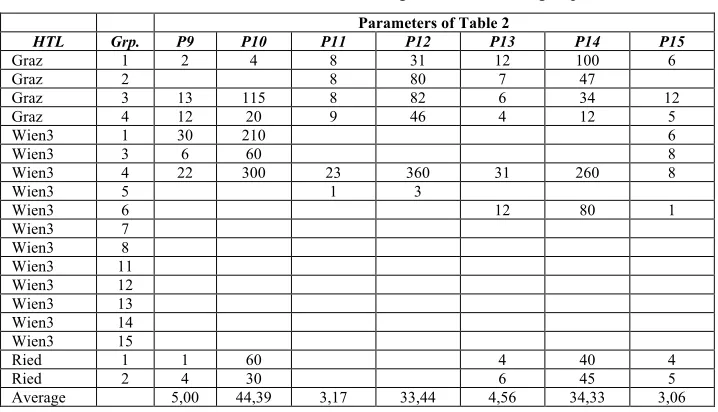
There are groups without any values and groups with extremely high values. The first groups (Graz groups 1 to 4, Wien3 groups 1 to 6 and Ried groups 1 and 2) had reported problems using PDM functionality. Meanwhile, it is possible that the HTL Wien3 groups 7 to 15 did not have enough time to make notes. In particular, group 4 of HTL Wien3 had reported 22 issues connected with data conflicts (Table 9, parame-ters 9 and 10), which took 300 minutes of work on the problems connected with PDM. Additionally, they reported 23 occurrences connected with 3D interface prob-lems (Table 9, parameters 11 and 12) which took 360 minutes to work on a solution.
Table 9. Difficulties measured during field test over all groups Parameters of Table 2
HTL Grp. P9 P10 P11 P12 P13 P14 P15
Graz 1 2 4 8 31 12 100 6
Graz 2 8 80 7 47
Graz 3 13 115 8 82 6 34 12
Graz 4 12 20 9 46 4 12 5
Wien3 1 30 210 6
Wien3 3 6 60 8
Wien3 4 22 300 23 360 31 260 8
Wien3 5 1 3
Wien3 6 12 80 1
Wien3 7 Wien3 8 Wien3 11 Wien3 12 Wien3 13 Wien3 14 Wien3 15
Ried 1 1 60 4 40 4
Ried 2 4 30 6 45 5
Looking into the evaluated data, while being a group of three students with 2 months experience in PDM, only two students worked on the project, whereas the percentage of finished tasks was with 19,6% significantly below the average of 62,58% for all groups (see Table 10). Looking into the individual students’ notes, it seems the students especially had problems working with the PDM system (name conflicts, check-in CAD-files, check-out CAD-files, synchronizing the workspaces both local and on the server), whereas using CAD was no issue. In contrast, the stu-dents of HTL Ried, who were in their last year at HTL and had one month of experi-ence with PDM (the lowest value in the field study), had significantly fewer problems using the PDM system.
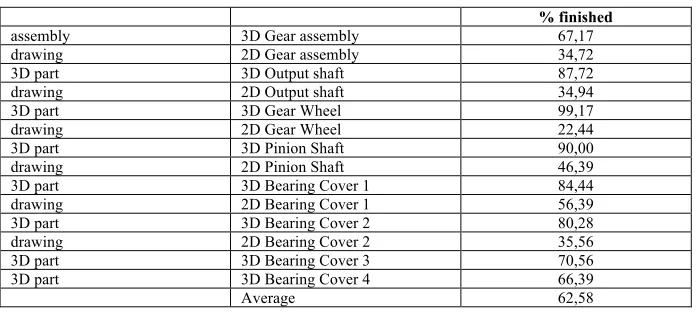
5.3 Results of PDM field study completed tasks
Table 10. Evaluation of finished tasks for all groups % finished
assembly 3D Gear assembly 67,17
drawing 2D Gear assembly 34,72
3D part 3D Output shaft 87,72
drawing 2D Output shaft 34,94
3D part 3D Gear Wheel 99,17
drawing 2D Gear Wheel 22,44
3D part 3D Pinion Shaft 90,00
drawing 2D Pinion Shaft 46,39
3D part 3D Bearing Cover 1 84,44
drawing 2D Bearing Cover 1 56,39
3D part 3D Bearing Cover 2 80,28
drawing 2D Bearing Cover 2 35,56
3D part 3D Bearing Cover 3 70,56
3D part 3D Bearing Cover 4 66,39
Average 62,58
Table 10 and Figure 3 give an overview about completion rates of each task for all groups as well as the average of completion at 62,58%.
Fig. 3. Comparison of finished 3D and 2D field study tasks
5.4 Results for research questions
Results RQ1: Is collaboration identifiable within the student groups? Concerning RQ1 collaboration can be observed, although the correlation with group size needs additional field tests and evaluation.
Results RQ2: What difficulties occurred during the field study? It can be observed that some student groups had problems using the PDM software, whereas other student groups left no information to evaluate. Due to these problems, there seems to be a growing need for user-friendly and simple-to-use interfaces [23].
Results RQ3: How many tasks were completed in the given time? Looking at RQ3, it can be observed that the 3D parts and assemblies are completed at a higher level compared to the 2D drawings. This is unsurprising to the authors, since generating drawings takes more time due to the need to consider several engineering standards.
6
Conclusion and Further Work
Collaborative engineering is an increasing part of daily engineering work, which will get more important in the near future, due to worldwide linked development and production in industry. Therefore, introducing and using PDM programs to support students work on collaborative engineering seems to be a good way to prepare stu-dents for the requirements of the labor market.
The PDM Field Study tests are ongoing in the current academic year 2017/18 to complete the data set obtained so far. There will be a focus especially on the second research question about difficulties occurring during the tests, to figure out and if possible mitigate the students’ problems with PDM programs.
Despite the few successes that have been achieved so far, it will take additional ef-forts to introduce PDM methodology into engineering education. Starting with intro-ducing PDM into mechanical engineering design education, it will be necessary to introduce it to electrical and mechatronics engineering as well. Due to this, students will learn how to develop products within collaborative engineering, which will be a key success factor in a changing industrial environment.
0,00 20,00 40,00 60,00 80,00 100,00
3D % finished
0,00 20,00 40,00 60,00 80,00 100,00
7
References
[1]A. Ensici, P. Badke-Schaub, N. Bayazıt, and K. Lauche, “Used and rejected decisions in design teamwork,” CoDesign, vol. 9, no. 2, pp. 113–131, 2013. https://doi.org/10.10 80/15710882.2013.782411
[2]T. Martinec, S. Škec, and M. Štorga, “Exploring the decomposition of team design activi-ty,” in DS 87-3 Proceedings of the 21st International Conference on Engineering Design (ICED 17) Vol 3: Product, Services and Systems Design, Vancouver, Canada, 21-25.08.2017, 2017.
[3]J. Feldhusen, M. Löwer, A. Brezing, and J. Neis, “PLM-enhanced engineering education,” in Proceedings of E&PDE 2010 When design education and design research meet: Pro-ceedings of the 12th International Conference on Engineering and Product Design Educa-tion, Norwegian University of Science and Technology (NTNU) Trondheim, Norway, 2nd - 3rd September 2010 ; [E&PDE], 2010, pp. 598–604.
[4]M. Geier and J. Steffen, “Establishing CAD and PDM as Part of Engineering Education in Large Classes for Undergraduate Students,” in Proceedings of E&PDE 2012 Design edu-cation for future wellbeing: Proceedings of the 14th International Conference on Engi-neering and Product Design Education, Artesis University College, Antwerp, Belgium, 6th - 7th September 2012, 2012.
[5]M. Abramovici and A. Youssef, “Next Generation Product Lifecycle Management (PLM).,” in Integration of Practice-Oriented Knowledge Technology: Trends and Prospec-tives, Springer, Berlin Heidelberg, Germany, 2013, pp. 143–156. https://doi.org/10. 1007/978-3-642-34471-8_12
[6]G. Schuh, H. Rozenfeld, D. Assmus, and E. Zancul, “Process oriented framework to sup-port PLM implementation,” Computers in Industry, vol. 59, no. 2-3, pp. 210–218, 2008.
https://doi.org/10.1016/j.compind.2007.06.015
[7]M. Eigner and R. Stelzer, Product Lifecycle Management: Ein Leitfaden für Product De-velopment und Life Cycle Management, 2nd ed. Dordrecht: Springer, 2013.
[8]S.C.-Y. Lu, W. Elmaraghy, G. Schuh, and R. Wilhelm, “A SCIENTIFIC FOUNDATION OF COLLABORATIVE ENGINEERING,” CIRP Annals, vol. 56, no. 2, pp. 605–634, 2007. https://doi.org/10.1016/j.cirp.2007.10.010
[9]A. Probst, D. Gerhard, and M. Ebner, “PDM field study and evaluation in collaborative engineering education,” in Proceedings of the 20th ICL Conference, Budapest, Hungary, 2017.
[10]J. E. Mills and D. Treagust, “ENGINEERING EDUCATION – IS PROBLEMBASED OR PROJECT-BASED LEARNING THE ANSWER?,” in AUSTRALASIAN JOURNAL OF ENGINEERING EDUCATION, AAEE 2003, online publication, 2003.
[11]A. KOLMOS, “Reflections on Project Work and Problem-based Learning,” European Journal of Engineering Education, vol. 21, no. 2, pp. 141–148, 2010.
[12]J. C. Perrenet, P. A. J. Bouhuijs, and J. G. M. M. Smits, “The Suitability of Problem-based Learning for Engineering Education: Theory and practice,” Teaching in Higher Education, vol. 5, no. 3, pp. 345–358, 2000. https://doi.org/10.1080/713699144
[13]R. T. Johnson and D. W. Johnson, “AN OVERVIEW OF COOPERATIVE LEARNING,” in Creativity and Collaborative Learning, Baltimore: Brookes Press, 1994, pp. 1–21. [14]B. Oakley, R. M. Felder, R. Brent, and I. Elhajj, “Turning student groups into effective
teams,” Journal of student centered learning, vol. 2, no. 1, pp. 9–34, 2004.
[16]J. Mamo et al., “USING ENGINEERING DESIGN TOOLS IN MULTIDISCIPLINARY DISTRIBUTED STUDENT TEAMS,” in Great expectations: design teaching, research & enterprise: Proceedings of the 17th International Conference on Engineering and Product Design Education, Loughborough Design School, University of Loughborough, United Kingdom, 3rd-4th September 2015, 2015.
[17]J. Barrie, “APPLICATIONS FOR CLOUD-BASED CAD IN DESIGN EDUCATION AND COLLABORATION,” in Great expectations: design teaching, research & enterprise: Proceedings of the 17th International Conference on Engineering and Product Design Edu-cation, Loughborough Design School, University of Loughborough, United Kingdom, 3rd-4th September 2015, 2015.
[18]A. Probst, “Introducing PLM at Austrian Secondary Colleges of Engineering,” in Proceed-ings of 2015 International Conference on Interactive Collaborative Learning (ICL), Flor-ence, Italy, 2015, pp. 327–329. https://doi.org/10.1109/ICL.2015.7318047
[19]A. Probst, D. Gerhard, S. Bougain, and C. Nigischer, “Continuous Research and Devel-opment Partnership in Engineering Education,” in Proceedings of the 19th ICL Confer-ence, Belfast, UK, 2016, pp. 7–21.
[20]W. Matek, D. Muhs, and H. Wittel, Roloff/Matek Maschinenelemente Aufgabensammlung, 6th ed.: Friedr. Vieweg & Sohn, 1984.
[21]E. J. Thomas and C. F. Fink, “Effects of group size,” Psychological bulletin, vol. 60, no. 4, pp. 371–384, 1963. https://doi.org/10.1037/h0047169
[22]T. Menon and K. Williams Phillips, “Getting Even vs. Being the Odd One Out: Conflict and Cohesion in Even and Odd Sized Groups,” SSRN Journal, 2008.
[23]P. de Pinel, N. Maranzana, F. Segonds, S. Leroux, and V. Frerebeau, “Proposition of Er-gonomic Guidelines to Improve Usability of PLM Systems Interfaces,” in IFIP Advances in Information and Communication Technology, v.409, Product Lifecycle Management for Society: 10th IFIP WG 5. 1 International Conference, PLM 2013, Nantes, France, July 8-10, 2013, Proceedings, A. Bernard, L. Rivest, and D. Dutta, Eds., Berlin/Heidelberg: Springer Berlin Heidelberg, 2013, pp. 530–539. https://doi.org/10.1007/978-3-642-41501-2_53
8
Authors
Andreas Probst is with the HTL Ried a Technical Secondary College of Engineer-ing, Ried, 4910 Ried / Innkreis, Austria
Martin Ebner is with the Educational Technology, TU Graz - Graz University of Technology, 8010 Graz, Austria
Martin Schön is with the Educational Technology, TU Graz - Graz University of Technology, 8010 Graz, Austria
Detlef Gerhard is with the Mechanical Engineering Informatics and Virtual Prod-uct Development, TU Wien - Vienna University of Technology, 1040 Wien, Austria
![Table 1. “Collective human endeavor characteristics” [8, p. 615]](https://thumb-us.123doks.com/thumbv2/123dok_us/563154.2055607/3.595.126.471.491.578/table-collective-human-endeavor-characteristics-p.webp)
![Fig. 2. Design task single stage transmission 2D drawing [20] and 3D CAD model](https://thumb-us.123doks.com/thumbv2/123dok_us/563154.2055607/6.595.149.447.379.536/fig-design-task-single-stage-transmission-drawing-model.webp)