PRIMARY RESEARCH
Biological effects of selective COX-2 inhibitor
NS398 on human glioblastoma cell lines
Paola Palumbo, Francesca Lombardi, Francesca Rosaria Augello, Ilaria Giusti, Vincenza Dolo, Pietro Leocata,
Maria Grazia Cifone and Benedetta Cinque
*Abstract
Background: Cyclooxygenase-2 (COX-2), an inflammation-associated enzyme, has been implicated in tumorigenesis and progression of glioblastoma (GBM). The poor survival of GBM was mainly associated with the presence of glioma stem cells (GSC) and the markedly inflammatory microenvironment. To further explore the involvement of COX-2 in glioma biology, the effects of NS398, a selective COX-2 inhibitor, were evaluated on GSC derived from COX-2 express-ing GBM cell lines, i.e., U87MG and T98G, in terms of neurospheres’ growth, autophagy, and extracellular vesicle (EV) release.
Methods: Neurospheres’ growth and morphology were evaluated by optical and scanning electron microscopy. Autophagy was measured by staining acidic vesicular organelles. Extracellular vesicles (EV), released from neuro-spheres, were analyzed by transmission electron microscopy. The autophagic proteins Beclin-1 and LC3B, as well as the EV markers CD63 and CD81, were analyzed by western blotting. The scratch assay test was used to evaluate the NS398 influence on GBM cell migration.
Results: Both cell lines were strongly influenced by NS398 exposure, as showed by morphological changes, reduced growth rate, and appearance of autophagy. Furthermore, the inhibitor led to a functional change of EV released by neurospheres. Indeed, EV secreted by NS398-treated GSC, but not those from control cells, were able to significantly inhibit adherent U87MG and T98G cell migration and induced autophagy in recipient cells, thus leading to effects quite similar to those directly caused by NS398 in the same cells.
Conclusion: Despite the intrinsic diversity and individual genetic features of U87MG and T98G, comparable effects were exerted by the COX-2 inhibitor NS398 on both GBM cell lines. Overall, our findings support the crucial role of the inflammatory-associated COX-2/PGE2 system in glioma and glioma stem cell biology.
Keywords: Glioblastoma, U87MG, T98G, Glioma stem cells, Inflammation, COX-2, COX-2 inhibitor, NS398, Autophagy, Extracellular vesicles
© The Author(s) 2020. This article is licensed under a Creative Commons Attribution 4.0 International License, which permits use, sharing, adaptation, distribution and reproduction in any medium or format, as long as you give appropriate credit to the original author(s) and the source, provide a link to the Creative Commons licence, and indicate if changes were made. The images or other third party material in this article are included in the article’s Creative Commons licence, unless indicated otherwise in a credit line to the material. If material is not included in the article’s Creative Commons licence and your intended use is not permitted by statutory regulation or exceeds the permitted use, you will need to obtain permission directly from the copyright holder. To view a copy of this licence, visit http://creat iveco mmons .org/licen ses/by/4.0/. The Creative Commons Public Domain Dedication waiver (http://creat iveco mmons .org/publi cdoma in/ zero/1.0/) applies to the data made available in this article, unless otherwise stated in a credit line to the data.
Background
Gliomas are classified by the World Health Organiza-tion (WHO) grade criteria (I to IV) into multiple spe-cific histologic subtypes, based on cell type of origin and molecular characteristics [1]. Grade IV Glioblas-toma (GBM) is one of the most lethal brain cancers
worldwide since it is the most highly infiltrating and aggressive tumor of the central nervous system, charac-terized by a high degree of genetic and cellular hetero-geneity. Nowadays, for the treatment of GBM, surgical resection is usually followed by radiotherapy or radio-therapy plus chemoradio-therapy with temozolomide (TMZ) [2]. These therapeutic approaches have increased median patient survival of 15-23 months [3, 4], but GBM often relapses due to the presence of tumor-ini-tiating cells, called GBM stem cells (GSC), promoting
Open Access
*Correspondence: benedetta.cinque@univaq.it
tumor recurrence, therapy resistance and metastasis. GBM is characterized by the presence of an inflamma-tory milieu, which is emerging as a target for new treat-ment modalities [5–7].
In our previous studies, the role of NOS2 (Nitric Oxide Synthase 2), a key inflammatory marker highly expressed in GBM, has been evaluated in GBM cell lines and pri-mary cultures, pointing out the correlation between NOS2 expression and ability to generate neurospheres [8]. We also reported that selective NOS2 inhibition by 1400W (N-(3-(Aminomethyl)benzyl)acetamidine) was able to reduce proliferation, migration, colony forma-tion, and neurospheres’ generation ability of U87MG and T98G cell lines [9].
Cyclooxygenase-2 (COX-2), another pivotal inflam-matory marker, is an inducible enzyme that catalyzes the first step of the synthesis of prostanoids by con-verting arachidonic acid into prostaglandin PGH2 and prostaglandin E2 synthase delivers PGE2 [10]. Under normal conditions, COX-2 expression is low or absent at basal levels but is rapidly induced by several stimuli, and, unlike the constitutive isoform COX-1, COX-2 is frequently overexpressed in cancerous tissues, including glioma and is implicated in cell proliferation, migration, metastatic process, angiogenesis, as well as in cancer stem-like phenotype promotion [11, 12]. The enhanced expression of COX-2 protein has been correlated with many aggressive aspects of the disease, such as rate of GBM cell proliferation [13], histopathological grade of glioma [14, 15], and poor prognosis and survival [16–19]. Furthermore, evidence has been reported that the COX-2 pathway, through the stimulation of the GSC self-renewal and proliferation, could contribute to chemo- and radio-resistance [20–22]. Hence, COX-2 has been proposed as a strong predictor of poor survival and aggressiveness [12, 18] as well as its targeting with specific COX-2 inhib-itors is emerging as a potential anti-glioma strategy [12,
14, 23, 24]. Indeed, COX-2 overexpression was found to correlate with GBM cell migration and invasion as well as increased vascular endothelial growth factor (VEGF) levels and high microvessel density [25–28]. The selec-tive COX-2 inhibitor rofecoxib, in combination with low dose of TMZ, has been proposed as an antiangiogenic strategy to treat GBM [29]. The GBM-associated hypoxic microenvironment has been reported to induce COX-2 expression [30] and COX-2 and its product PGE2 are well known immunosuppressive factors in various cancers, including GBM [31]. Taking into account that chemo-therapy and radiochemo-therapy can induce COX-2 activity in GBM cells with PGE2 synthesis which in turn causes overexpression of immunosuppressive cytokines and inhibits T cell infiltration and proliferation, several find-ings suggest that the conventional treatment-induced
immunosuppression can be counteracted by NSAIDs such as diclofenac, NS398, celecoxib [32–34].
NS398, a sulphonamide derivative, is a specific COX-2 inhibitor with an IC50 of 3.8 × 10⁻⁶ M on the enzyme
iso-lated from sheep placenta [35], without affecting COX-1 activity at concentrations exceeding 100 mM (> 50-fold potency for COX-2 over COX-1) [36]. The anti-prolifer-ative effect of NS398 on GBM cell lines (i.e., U87MG and U251MG) and relative neurospheres was firstly reported by Joki et al. [14]. Of note, a significant reduction in gli-oma growth was registered in mice bearing tumor xen-ografts after 2 weeks of treatment with NS398 able to reduce PGE2 secretion from tumor xenografts [37, 38].
Taking into account previous reports which showed that anti-glioma effects of some clinical and experimen-tal approaches are associated with upregulation of the autophagic pathway [39, 40], it would be of interest to verify if the COX-2 inhibition can also exert the same action. Autophagy is a highly dynamic and conserved-catabolic process responsible for degrading damaged cel-lular structures and proteins by lysosomal digestion and recycling macromolecules. It occurs at low basal levels in all cells to perform homeostatic functions and is rap-idly induced during different forms of metabolic stress [41–44]. Recently, in vitro and in vivo studies on glioma models have reported an increase of autophagy levels in response to different antitumor approaches [39, 45–47]. TMZ has been reported to influence cell viability by mod-ulating autophagy [48]. The activation of this pathway is crucial for the susceptibility to the treatment [49, 50]. Of interest, it been recently demonstrated that chaper-one mediated autophagy (CMA) is the main mechanism by which TMZ treatment decreases hypoxia-inducible factor-1α (HIF-1α) activity in sensitive cells, thus improv-ing responsiveness by promotimprov-ing cell apoptosis. Moreo-ver, the relation between mitochondrial reactive oxygen species (ROS), CMA induction, and TMZ-sensitiveness in GBM has been showed [51].
A strict interplay between autophagy and EV release, with important implications for normal physiology and disease states has been well recognized and documented [52, 53]. The significance of EV signalling in cancer, and the role of autophagy in multiple phases of tumorigenesis has been reviewed [54]. However, the importance of the crosstalk between EV and autophagy in cancer, including GBM, is not fully clarified [53].
expresses the isocitrate dehydrogenase (IDH)-wild type, O6-methylguanine-DNA methyltransferase (MGMT) promoter methylated, MGMT-negative, and a wild-type p53 [55–57]. The T98G human GBM cell line, showing a polymorphic with fibroblast-like, polygonal morphol-ogy, expresses the isocitrate dehydrogenase (IDH)-wild type and MGMT and also express p53 mutated [55, 58,
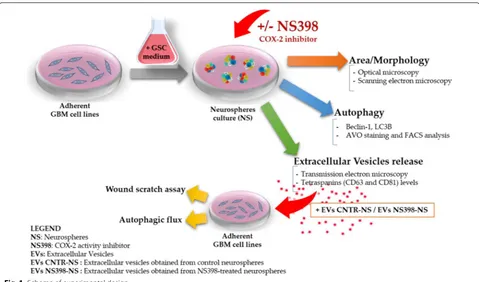
59]. Cell growth, autophagy flux, and EV secretion were evaluated after treatment with COX-2 inhibitor. The influence of NS398 was also assessed on migration rate and autophagy in adherent U87MG and T98G. In addi-tion, the effect of EV released by neurospheres previously incubated with or without NS398 was evaluated on the adherent GBM cell lines (recipient cells), according to the scheme shown in Fig. 1.
Methods
GBM cell coltures, neurosphere generation and treatments
Human GBM grade IV cell lines, U87MG and T98G were purchased from the European Collection of Authenti-cated Cell Cultures (ECACC) and American Type Cul-ture Collection (ATCC), respectively. Both GBM cell lines were grown as adherent cells in DMEM (Dulbecco’s Modified Eagle Medium) supplemented with 10% (v/v) of fetal calf serum (FCS), 2 mM l-glutamine, 100 U/ mL penicillin, and 100 mg/mL streptomycin (standard medium, St-M) (Euro Clone, West York, UK). The cells
were maintained in a humidified incubator with 5% CO2 at 37 °C. Subcultures were performed every 3 days; after reaching 70/80% confluence adherent cells were detached using trypsin–EDTA solution (Euro Clone, West York, UK). The culture medium was totally replaced by centrif-ugation for 10 min at 400xg. Cell viability was determined using trypan blue solution (0.04% final concentration in PBS, Euro Clone, West York, UK), and neurospheres were visualized by optical microscopy (Eclipse 50i, Nikon Corporation, Japan). Here, to perform most of the experi-ments, we chose the neurosphere model since sphere formation is a typical characteristic of cancer stem cells when cultured in serum-free medium due to their self-renewal ability [60]. In addition, most importantly, GBM neurospheres are able to give rise to a tumor in xeno-graft model [61]. As previously described [8], for neu-rosphere (NS) generation, 5x10⁵ cells were seeded onto
T25 cell culture flasks and cultured in suspension using a serum-free medium DMEM/F12 (1:1, vol/vol) supple-mented with B27 reagent (Life Technology Corporation, CA, USA), EGF (20 ng/mL), and FGF-2 (20 ng/mL) (both purchased from ImmunoTools, 26169, Friesoythe, Ger-many), penicillin/streptomycin and glutamine. Neuro-sphere media were replaced every 3 days. All reagents for cell biology and consumables were purchased from Euro-Clone (EuroEuro-Clone, West York, UK). The neurosphere cultures were routinely evaluated by flow cytometry and
compared to adherent GBM cells for phenotypic marker expression. For cytofluorimetric analysis, we used a FAC-SCalibur supplied with CellQuest software (Becton– Dickinson, San Jose, CA). The primary antibodies were used for immunophenotypic analysis: anti-β-tubulin III (Alexa Fluor 488, Catalog No. 560338), anti-SOX-2 (PE Mouse, Catalog No. 560291), anti-nestin (Alexa Fluor 647, Catalog No. 560393), all acquired from Becton– Dickinson (BD), anti-GFAP (Glial fibrillary acidic protein; Catalog No. G9269 Sigma–Aldrich). Secondary anti-body anti-rabbit FITC conjugated (Millipore) was used for detection of GFAP positive cells. Neurospheres were treated in the absence or presence of the selective COX-2 inhibitor, NS398 (N-[2-(Cyclohexyloxy)-4-nitrophenyl] methanesulfonamide) acquired from Sigma Aldrich (Sigma Aldrich, Saint Louis, MO, USA). Cells were firstly treated with different concentrations of NS398, as fol-lows: 10 µM, 100 µM, and 200 µM for 48 h. According to manufacturer instruction, the COX-2 inhibitor was stored as stock solutions in DMSO at − 20 °C and diluted in cell culture medium just before use. The treatment with the vehicle alone was referred to as “control”, while the term “not-treated” was used for cells incubated with only culture medium. For all the parameters evaluated in this work, DMSO, used to dissolve NS398 at 0.6% (v/v) final concentration, did not have any effects on its own. Morphology and size of neurospheres were visualized by microscope Nikon Eclipse TS100 at the initial time (T0) and after 48 and 72 h from addition of COX-2 inhibitor NS398 and at a longer incubation (range 96–144 h), after subculturing, with fresh medium and without inhibitor. To determine the area of the neurospheres, 10 bright field images (at 4× magnification) were randomly taken at each time points under the inverted microscope (Nikon Eclipse TS100). The size of the neurospheres was deter-mined using Image J software. The neurospheres’ average area (total area/number of neurospheres) was expressed in mm2, as previously reported [9]. After NS398
expo-sure, in order to assess cell viability, U87MG- and T98G-derived neurospheres were enzymatically dissociated with the Accutase™ solution (from PAA-GE Healthcare Life Sciences Bio-Sciences AB, SE-751 84 Uppsala Swe-den) for about 10 min at 37 °C and stained with trypan blue dye exclusion assay recording live and dead cells number. Cell viability was evaluated by flow cytometric analysis by propidium iodide (PI) staining. PI staining is commonly used for identifying dead cells in a population and, since it can penetrate only in cells with disrupted membranes, is excluded from viable cells. PI staining was measured with FACS analysis. Cells were incubated with PI for 30 min and analyzed by flow cytometer (BD Instru-ments Inc., San José, CA, USA), equipped with BD Cell-Quest Software (BD Instruments Inc.).
Prostaglandin 2 (PGE2) level assay
The levels of secreted PGE2 in the cell supernatants were quantified using an prostaglandin E2 enzyme-linked immunosorbent assay (ELISA) kit (Cayman Chemical Company, Ann Arbor, MI, USA) as described in the manufacturer’s instructions and presented as pg/ mL. Breafly, neurospheres were treated in presence or absence of NS398 (10 µM, 100 µM, and 200 µM) for 48 h; cell culture supernatants were assayed at a final dilution of 1:10 for U87MG and not diluited for T98G cultures. The least detectable PGE2 concentration was 7.8 pg/mL.
Western blot analysis
Scanning electron microscopy
Scanning electron microscopy (SEM) was carried out on U87MG- and T98G-derived neurospheres, that were previously untreated or treated with NS398 (100 µM for 48 h) and then left to adhere overnight on coverslips that were pre-coated with poly-lysine (30 µg/ml) (Sigma Aldrich, Saint Louis, MO, USA). Neurospheres were fixed with 2% glutaraldehyde (Electron Microscopy Sci-ences, Hatfield, PA, USA) in PBS for 30 min and the cov-erslips briefly rinsed with PBS and water; afterward they were dehydrated in ethanol solutions 30–50–70–90% in H2O and three times 100%, for 5 min each. For HMDS
drying, the samples were immersed in HMDS:EtOH 1:2, HMDS:EtOH 2:1 and HMDS 100% for 3 min each. (Elec-tron Microscopy Sciences, Hatfield, PA, USA) and then the excess HMDS was blotted away by filter paper. The samples were then transferred to a desiccator for 25 min. to avoid water contamination, mounted on stubs, sput-ter-coated with chromium in a Quorumtech Q 150T ES Turbo chromium sputter, and detected via a Zeiss Gem-ini SEM 500.
Autophagy detection: fluorescent staining of acidic vesicular organelles (AVO)
For autophagy evaluation the acridine orange (AO) stain-ing was performed to detect the presence of acidic vesicu-lar organelles (AVOs), an hallmark of autophagy process. Before staining with AO, adherent GBM cell lines (1 × 10⁵) were previously plated onto glass round coverslips in
12-well plates, allowed to attach by overnight incubation, and then exposed to NS398 (100 μM for 48 h). Before staining with AO, neurospheres from both U87MG and T98G were disaggregated with Accutase solution and plated onto glass round coverslips coated with poly-lysine for 12 h and then treated with NS398 similarly to adher-ent cells. AO (Sigma Aldrich, Saint Louis, MO, USA) was added at a final concentration of 0.01 μg/mL in PBS at room temperature for 10 min and in presence of RNase A (6 μg/106 cell, Sigma Aldrich, Saint Louis, MO, USA)
both in U87MG and T98G adherent and neurophere cul-tures. Cells were washed twice with PBS, and examined under a fluorescence microscope. AO accumulates in acidic organelles in a pH-dependent manner in cells. At neutral pH, it emits green fluorescence, but within acidic environments, AO becomes protonated and gets trapped within the organelle and then aggregates and emits red fluorescence. In AO-stained cells, the cytoplasm and nucleolus fluoresce bright green, whereas acidic com-partments fluoresce bright orange/red. The intensity of the orange/red fluorescence is proportional to the degree of acidity and/or the volume of the cellular acidic com-partment. To detect and quantify AVOs (autophagy cells), FACS analysis was performed by FACSCalibur flow
cytometry (BD Instruments Inc., San José, CA, USA) equipped by Cell Quest software (BD Instruments Inc.). Cells were analyzed using the 488-nm excitation detec-tor (green fluorescence/FL1) and the 540-nm emission detector (red fluorescence/FL3). U87MG and T98G cells subjected to serum withdrawal for at least 4 h have been used as positive control of autophagy.
Isolation and characterization of neurospheres‑derived extracellular vesicles
The EV were isolated from U87MG- and T98G-derived neurospheres cell media by ultracentrifugation, as previ-ously described [62]. Briefly, all of the supernatants from neurospheres cultures treated in presence or absence of NS398 for 48 h were collected in aseptic working condi-tions and initially centrifuged in clear and sterile tubes at 4 °C at 600×g for 10 min and 1500xg for 30 min to remove cellular debris. The resulting supernatants were centrifuged at 100,000×g (Rotor 70Ti, Quick-Seal Ultra-Clear tubes, kadj 221, brake 9) for 2 h at 4 °C in an Optima
XPN-110 Ultracentrifuge (Beckman Coulter, Brea, CA, USA). The pelleted EV were resuspended in PBS. The quantity of EV was double measured by determining the total protein concentration in the preparations using the BCA Protein Assay Kit (Pierce, Rockford, IL, USA), fol-lowing the manufacturer’s instructions. The samples were immediately used or stored at − 20 °C. Identification of purified EV was achieved by morphological examination by transmission electron microscope.
Transmission electron microscopy
To further characterize the EV obtained from GBM neurospheres and to confirm their ultrastructural mor-phology, transmission electron microscopy (TEM) was performed on EV. After collection, EV were resuspended and diluited in PBS and, according to proper dilutions, the samples were adsorbed onto 300-mesh carbon-coated copper grids (Electron Microscopy Sciences) for 5 min in a humidified chamber at room temperature. EV on grids were fixed in 2% glutaraldehyde (Electron Micros-copy Sciences) in PBS for 10 min and then briefly rinsed in Milli-Qwater. Grids with adhered EV were examined with a Zeiss Gemini SEM 500 equipped with a STEM detector at 20 kV and at a 3.0 mm working distance, after negative staining with 2% phosphotungstic acid, brought to pH 7.0 with NaOH [62].
Extracellular vesicles labeling
according to according to the manufacturer’s protocol. Briefly, EV pellets were resuspended in 1 mL Diluent C. To each samples 6 μL PKH26, a lipophilic fluorescent dye, were added using a laminar flow biosafety hood. The exosome suspension was mixed for 30 s with the stain solution and incubated for 5 min at room temperature. The labeling reaction was stopped by adding 2 ml of 1% BSA in sterile PBS. Labeled EV were ultracentrifuged as previously described. A negative technical control with same volume of diluent C and PKH2 as samples was also ultracentrifuged to check if the free dye does not precipi-tate. Afterward, U87MG and T98G cells were incubated for 18 h at 37 °C in a 95% air 5% CO2 atmosphere, with
PKH26-labeled EV (30 µg) from respective neurospheres previously treated with NS398. The coverslips were mounted with Vectashield® Antifade Mounting Medium with DAPI (Vector Laboratories, Inc., Burlingame, CA, USA), and the EV internalization was viewed under a fluorescent microscopy (Nikon, Eclipse 50i, Tokyo, Japan) and the images were acquired at 100× magnification.
Scratch wound assays
Wound-healing assay was used to detect the migration ability of GBM cell lines U87MG and T98G following NS398 exposure. Adherent U87MG and T98G cells were cultured in standard conditions at 6 × 10⁴/cm2 in
mul-tiwell plates, to permit the monolayer formation, until treatment with NS398 (100 μM for 48 h) and wounded with a 200 µl pipet tip. Culture medium was immediately removed (along with any suspended cells), the scratched monolayers were washed with PBS and cultured with a fresh serum supplemented culture medium (10% FCS) at 37 °C in a 5% CO2 humidified atmosphere in the absence
or presence of 100 µM NS398. The wound-closing pro-cess was observed every hours and phase contrast pho-tographs at 8 and 24 h were taken. The experiments were conducted in duplicate, and at leasts three fields for well were captured. The TScratch software was used to meas-ure percentage of wound closmeas-ure; the software automati-cally calculates the portion of area occupied by the cells by a mathematical model. The quantification of a relative scratched monolayer closure (wound closure) was per-formed according to the equation where Tn is a specific time point after the scratching:
Statistical analysis
Statistical analysis was performed by GraphPad Prism 6.0 (GraphPad Software, San Diego, Ca). All data shown are from at least two independent experiments conducted
% Relative wound closure = [% of scratched area at T0−% of scratched area at Tn](×100) [% of scratched area at T0]
in duplicate or triplicate and are expressed as the mean ± SD or mean ± SEM, as specified in the figures’ legends. For comparison between two means, Student’s unpaired t test was used. For comparisons of the mean values among groups, a one-way or two-way ANOVA fol-lowed by Bonferroni post hoc or Dunnett test, as speci-fied, were used. Statistical significance was set at p < 0.05.
Results
Phenotypic analyses of neurosphere‑derived cells
The phenotype of neurosphere-forming cells was rou-tinely evaluated by flow cytometric analysis using anti-bodies directed against the stemness markers β-tubulin III, nestin, and SOX-2, as well as the lineage marker for
glial cells, GFAP. These markers were also analyzed in relative adherent cells to highlight the differences with respect to neurosphere-forming cells (Table 1). In accord-ance with previous reports [8, 63, 64], the percentages
Table 1 Immunophenotypic characterization of GBM adherent cells and relative neurosphere
Percentage (%) and value of Median Fluorescence Intensity (MFI) of β-tubulin III, SOX-2, nestin and GFAP in U87MG and T98G maintained in standard culture conditions (adherent cells) and in DMEM/F12 medium serum free with EGF, b-FGF and B27 supplement for neurosphere generation. Data are from one representative out of two independent experiments in duplicates ± SD
β‑tubulin Sox‑2 Nestin GFAP
U87MG adherent cells % positive cells
51.30 ± 4.21 50.57 ± 3.02 92.41 ± 6.84 69.91 ± 2.38 MFI
45.21 ± 3.78 36.57 ± 2.47 249.38 ± 15.86 139.14 ± 11.70 U87MG neurospheres
% positive cells
89.47 ± 7.23 95.41 ± 8.21 96.31 ± 4.39 59.71 ± 3.40 MFI
210.60 ± 10.30 129.77 ± 10.82 511.61 ± 34.90 60.69 ± 5.11 T98G adherent cells
% positive cells
80.52 ± 4.34 86.84 ± 6.40 89.40 ± 6.96 52.96 ± 4.01 MFI
117.51 ± 9.87 44.58 ± 36.84 99.58 ± 7.43 58.88 ± 1.99 T98G neurospheres
% positive cells
89.88 ± 5.73 97.63 ± 7.70 96.64 ± 4.80 4.11 ± 0.98 MFI
of positive cells for β-tubulin III, SOX-2 and nestin were higher than 80%, together with high MFI values in U87MG neurospheres. The percentage of positive cells in U87MG adherent cells never exceeded 55% for β-tubulin III and SOX-2 and the MFI values were approximately four-five times lower than the relative neurospheres. The percentage of positive adherent cells for nestin ranged between 85 and 98% while the MFI value was half that detected in relative neurospheres. The percentages of T98G positive cells for β-tubulin III, SOX-2 and nestin were not different between neurosphere-forming and adherent cells; however, as illustrated in Table 1, the MFI values in neurospheres were clearly higher when com-pared to adherent cells. The marker of glial differentiation GFAP, even showing a comparable percentage of positive cells among adherent and neurosphere-forming U87MG and T98G cells, appeared strongly down-modulated on neurospheres, as indicated by MFI level and as expected.
COX‑2 expression and activity in GBM cell lines
It has been previously reported the COX-2 expression in several GBM cell lines, including U87MG and T98G,
and the basal levels of this protein varied greatly among them [65, 66]. To further confirm this evidence in our conditions, basal levels of COX-2 protein were evalu-ated in neurospheres generevalu-ated from both U87MG and T98G cell lines. In Fig. 2a, a representative western blot is shown together with the relative densitometric analy-sis expressed as mean ± SEM from three independent experiments. To control the specificity of NS398 action, the modifications of PGE2 levels were measured follow-ing inhibitor addition at concentrations of 10, 100 and 200 μM, according to previous studies where similar lev-els of NS398 have been used in vitro on several types of cancer cells, including GBM cell lines [14, 34, 67]. The treatment with NS398 led to a significant decrease of PGE2 in the extracellular medium of the U87MG-derived neurospheres. The effect was dose-dependent being much more intense at high concentrations of NS398 (p < 0.0001 vs control) compared to 10 µM (p < 0.05 vs control) (Fig. 2b). In neurospheres derived from T98G cells, which basically released greatly lower amounts of PGE2, the addition of COX-2 inhibitor led to a sig-nificantly reduced PGE2 release at 100 µM (p < 0.01 vs
control) and at 200 µM (p < 0.05 vs control) (Fig. 2b). The different expression of COX-2 detected in the U87MG- and T98G-neurospheres could explain the different basal PGE2 levels as well as the different effectiveness of the NS398 inhibitor. The control group was treated with drug vehicle DMSO (0.6% v/v) and indicated for all experi-ments as control.
NS398 influenced neurospheres’ growth and morphology without affecting viability
Firstly, we examined if the NS398 could affect the glioma stem cell (GSC) viability and we observed that the expo-sure to NS398 inhibitor at the concentrations of 10, 100,
and 200 µM did not significantly influence the percent-age of viable U87MG- and T98G-derived neurospheres (Fig. 3a, b, respectively). DMSO, used to dissolve NS398 at 0.6% (v/v) final concentration, did not have any effects on its own. Based on these results and accordingly to the suggestions of Joki et al. [14], the concentration of NS398 100 µM was chosen for the subsequent experiments.
NS398 addition was able to significantly affect either neurospheres’ growth or morphology. Representative images acquired with a phase-contrast microscope (4× magnification) of U87MG- and T98G-derived neu-rospheres, incubated for 48 h with or without NS398 (100 μM) are shown in Fig. 3c, d, respectively. As
evident, NS398-treated neurospheres from both GBM cell lines resulted smaller than control ones, the aver-age area of control-U87MG spheres vs relative T0 was increasing by 12.22% ± 1.82 (mean value ± SEM); con-versely, NS398-treated U87MG neurospheres’ area was reduced by 39.31% ± 3.88 (mean value ± SEM) vs rela-tive T0 (p < 0.05) (Fig. 3c). Similarly, in T98G cultures, where the spheres at T0 appeared smaller than those of the U87MG, a significant reduction of relative mean area after the treatment with COX-2 inhibitor was also detected (-42.51% ± 7.45; * p < 0.05) (Fig. 3d). The effect of the drug could be detected in both cellular lines up to 72 h with a reduction of ~ 43% and ~ 47% on U87MG and T98G cells, respectively. At a longer incubation (range 96-144 h), after subculturing, with fresh medium and without inhibitor, the neurospheres’ mean area did not appear significantly different between control and treat-ment with NS398. This result could be due to the half-life of the drug. Indeed, as previously reported on in vitro models [68], NS398 should be replenished every 3 days. In this regard, experiments with long-term cultures of neurospheres involving the periodic addition of NS398 to cells will be required.
To further assess the effects of NS398 on neurospheres’ morphology, images of U87MG and T98G neurospheres treated or not with NS398 were acquired at scanning
electron microscopy (SEM) at several magnifications. Figure 4 shows SEM representative micrographs of U87MG and T98G neurospheres cultured for 48 h with or without NS398 (100 µM). The results obtained by SEM were overall overlapping with those from light micros-copy: images at low magnification clearly highlighted a reduction of neurospheres’ size in treated cultures when compared to untreated ones. In addition, all NS398-treated neurospheres showed an alteration of the mor-phological features, being smaller, not well structured, with a clear cell disaggregation and extremely irregu-lar outline. The membranes of treated neurospheres appeared much rougher compared to untreated spheres and were characterized by the presence of abundant vesi-cle-like membrane protrusions (Fig. 4a, b).
NS398 induced autophagy in neurosphere cultures
In order to verify whether NS398 could induce the autophagy pathway in GBM stem cells, fluorescence staining with acridine orange (AO) of the disaggregated neurospheres was assessed to visualize acidic compart-ments. In untreated cells, the cytoplasm and nuclei flu-oresced bright green, while the treatment for 48 h with NS398 at 100 μM, caused a marked induction of AVOs in the cell cytoplasm as clearly shown by the bright orange/ red acidic compartments (Fig. 5a, c). Furthermore, the
quantitative FACS analysis of AVOs confirmed a sig-nificant increase in the fluorescence intensity as com-pared to control cells in both GBM cell lines (Fig. 5a, c). To confirm whether NS398 induced autophagic death, the classical autophagy-related proteins were evaluated. According to previous reports [69, 70], both LC3B I and LC3B II resulted upregulated in the cells treated with NS398. In particular, a consensus has emerged whereby overall levels of LC3B-II should be normalized to a load-ing control, such as β-actin [69]. In line with the molec-ular changes associated to autophagic process, Beclin-1 levels were also upregulated in NS398-treated neuro-spheres in comparison to control cells (Fig. 5b, d).
Effect of EV released by U87MG‑ and T98G‑derived neurospheres following NS398 treatment on adherent cell lines
The ability of NS398 to modulate EV shedding from U87MG and T98G neurospheres was evaluated. After exposure of neurospheres for 48 h to NS398 at 100 µM, EV fraction, purified from supernatants and character-ized by transmission electron microscopy (TEM), showed an unbroken bilayer membrane with a typical rounded morphology similar to EV released by DMSO-treated neurospheres (CNTR) (Fig. 6a, b). The tetraspanins
CD63 and CD81 proteins, specific EV markers [71, 72], further confirmed the nature of isolated EV derived from NS398-treated or untreated neurospheres (Fig. 6c, d).
The microscopic analysis showed that PKH26-labeled EV were effectively internalized by adherent GBM cell lines after 18 h of culture. The treatment of neu-rospheres with NS398 did not influence the EV uptake in adherent recipient GBM U87MG and T98G cells, resulting similar in all samples (Fig. 7). Adherent GBM cells were exposed to EV released by neurospheres pre-viously cultured with NS398 at 100 µM for 48 h or with DMSO-drug vehicle (CNTR).
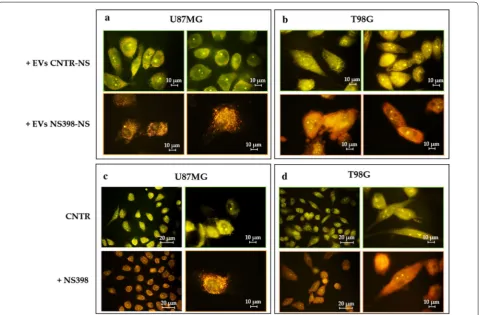
EV secreted by NS398-treated neurospheres were able to induce high levels of AVO’s accumulation high-lighted by a diffuse orange/red fluorescence in both recipient adherent cell lines (100%) (Fig. 8a, b). Con-versely, the addition of EV released by DMSO-treated neurospheres had no effect in terms of AVO formation (0%). In Fig. 8c, d, the results of experiments aimed to evaluate the effects on autophagy of direct treatment with COX-2 inhibitor are shown. It is evident that the direct addition of NS398 led to an AVO level increase in both GBM cell lines which was similar to that observed after addition of EV released by NS398-treated neuro-spheres (100% vs 0% control).
Fig. 5 NS398 induces autophagy in GBM neurospheres. a, c Representative images of U87MG- and T98G-derived neurospheres treated with or without 100 µM NS398 for 48 h and stained with AO. The control cells were treated with DMSO alone (CNTR). Flow cytometric detection of red and green fluorescence of AVOs in U87MG- and T98G-derived neurospheres treated or not (CNTR) with 100 µM NS398 (48 h) is shown. b, d
NS398 inhibitor impaired migration of adherent GBM cell lines
The capability of COX-2 inhibitor to influence tumor cell migration was evaluated using an in vitro artificial wound model. Figure 9 shows representative microscopy images at T0, 8 h, and 24 h, and the relative quantitative analy-sis of wound closure rate. The scratched monolayers of DMSO-treated cells (CNTR) were closed at ~ 25–28 h. Treatment with NS398 significantly delayed the U87MG monostrate repair both at 8 h (22.40 ± 1.08, CNTR vs 6.94 ± 2.4, NS398; p < 0.05) and 24 h (65.44 ± 2.89, CNTR
vs 51.41 ± 2.82, NS398; p < 0.05) (Fig. 9a). Similarly, NS398 treatment negatively influenced the wound clo-sure rate of T98G cells being the effects statistically rel-evant just at 24 h (62.79 ± 14.53, CNTR vs 39.95 ± 2.48, NS398; p < 0.01) (Fig. 9b). Under these conditions, while cell viability was not affected by NS398 treatment, the proliferation rate of both cell lines decreased compared to control cells, although to a different extent. The cell growth of U87MG cells was most affected by NS398, with a reduction rate of 10–12% and 25–30% at 8 and 24 h, respectively, while the number of T98G cells treated with Fig. 6 Characterization of isolated EV released by U87MG- and T98G-neurospheres’ cultures. Representative TEM images of EV from a U87MG- and
b T98G-derived neurospheres cultured in the absence (CNTR) or presence of NS398 (100 µM) (50,000× magnification, scale bar 200 nm). Expression of EV specific markers CD63 and CD81 in EV collected from c U87MG- and d T98G-derived neurospheres treated with NS398 (100 µM, 48 h) or not (CNTR) was detected by Western
NS398 was 5–7% and 10–15% lower than control cultures at 8 and 24 h, respectively. GBM cell lines show differ-ences also in migration rate. Moreover, the scratch assay test showed that T98G grow with a much higher density than U87MG raising the question if cell density can affect the migration rate. However, with this model, we calcu-lated the surface of the wounded area at 8 or 24 h com-pared to the initial area (T0), as measured immediately after scratch and considered 100%, regardless of density of the initial monolayer. The ability of the EV secreted from control (CNTR) and NS398-treated neurospheres to influence GBM adherent cell migration was also evalu-ated. The addition of EV from NS398-treated neuro-spheres significantly delayed the re-epithelialization of both U87MG and T98G scratched monolayers respect to relative T0 (Fig. 9c, d). In U87MG monolayers the per-centage of wound closure rate at 8 h was 14.69 ± 0.41 with EV derived from NS398-treated neurospheres (+EV NS398-NS) vs 32.82 ± 1.58 of EV derived from untreated neurospheres (+EV CNTR-NS) showing a significant difference (p < 0.01). Moreover, the percent-ages of re-epithelialization at 24 h was 34.54 ± 1.34 with
EV NS398-NS vs 60.03 ± 8.58 of EV CNTR-NS (p < 0.05) (Fig. 9c). The inhibitory effect of EV from NS398-treated T98G neurospheres resulted significant at 24 h after scratch (p < 0.0001) (Fig. 9d). These results suggested that both GBM cell lines exposed to EV purified from NS398-treated neurospheres media for 48 h showed a delay in re-epithelization respect to cells exposed to EV from DMSO-treated neurospheres (CNTR).
Discussion
functions through binding and activating prostaglan-din receptors (EPs), together with COX-2 and EP, PGE2 forms a functional COX2/PGE2/EP axis with important biological and pathological functions [24]. In order to counteract the inflammatory process in GBM, the use of selective COX-2 inhibitor drugs is currently evaluating being considered as an adjunct treatment, also owing to their ability to increase GBM sensitiveness to traditional chemotherapy and radiotherapy [12].
To further explore the effects of COX-2 pharmaco-logical inhibition in GBM, we investigated the effect of NS398, a highly selective COX-2 inhibitor, on human U87MG and T98G cell lines. NS398, even if not yet approved by the Food and Drug Administration (FDA) for clinical use, has been largely studied in vitro and in vivo on several types of cancers [77].
In our experimental conditions, neurospheres derived from both cell lines resulted highly influenced by treat-ment with NS398, showing morphological changes, a reduced growth rate, and a relevant level of autophagy. In addition, COX-2 inhibitor exposure could be associ-ated with a surprising functional modification of the EV released by neurospheres. In fact, EV derived from neu-rospheres, pre-treated with NS398, strongly reduced the migration ability and caused a dramatic level of autophagy in the adherent cells of U87MG and T98G, thus causing effects quite similar to those observed fol-lowing direct addition of the inhibitor. These results could be attributed to the potential effect of the inhibitor on the cargo of EV released by neurospheres or the pos-sibility that NS398 added to neurospheres was trapped in the EV themselves which in turn could act as drug delivery vehicle [78]. In this context, further research will need to assess the influence of NS398 on cargo con-tents through next generation sequencing. Of note, our findings suggest that both GBM cell lines were equally influenced by NS398, despite the intrinsic diversity and individual genetic features, such as the TP53 gene sta-tus, MGMT activity and base excision repair (BER) or BRCA1 pathways, which in turn are associated to a dif-ferent sensitivity or resistance to TMZ [55, 58, 59]. In our hands, even if both expression and enzymatic activity of COX-2 were significantly higher in U87MG than T98G, the COX-2/PGE2 inhibitor led to similar effects in terms
of cell growth and viability, autophagy, cell migration. Of interest, Kuipers et al. (2007) showed evidence that both the cell growth and radiation-resistance either of COX-2 positive (U87) or negative (D384, U251) GBM cell lines were effectively inhibited by COX-2 inhibitors, includ-ing NS398 at 200 μM. These results led the authors to conclude that the effects of non-steroidal anti-inflamma-tory drugs (NSAIDs) could be independent on enzyme expression and probably caused by interaction with other targets than COX-2 [34]. In 2013, Gurpinar et al. published a detailed description of the major COX inde-pendent mechanisms of NSAIDs and COX-2 inhibitors, including inhibition of cyclic guanosine monophosphate phosphodiesterases (cGMP PDEs), Wingless-related integration site (Wnt) signaling, peroxisome proliferator-activated receptor δ (PPARδ) activity, phosphatidylin-ositol-3-kinase (PI3K)/3-phosphoinositide-dependent kinase-1 (PDK-1)/Protein Kinase B (Akt) pathway [79]. In line with these findings, our results show that U87MG and T98G are similarly sensitive to NS398 treatment, irrespective of the relevant difference in COX-2 expres-sion and activity. So, further experiments with negative GBM COX-2 lines will be necessary to check whether the mechanism behind the observed effects of NS398 could be COX-2 independent. It should be of interest to also evaluate the influence of NS398 on healthy human brain astrocytes. In addition, given the functional implications of COX-1 in cancer the possible involvement of COX-1 should be evaluated in our experimental conditions [80].
Wu et al. [22] have recently reported that COX-2 inhi-bition with indomethacin, celecoxib, or siRNA against COX-2, enhanced the cytotoxic effect of TMZ on GSC isolated from primary GBM. Based on these findings, the comparable sensitivity observed in the two cell lines to NS398, despite the different sensitivity to TMZ, could be of even greater interest if substantial evidence will be provided about the ability of inhibition of COX-2/ PGE2 system to convert a TMZ-resistant glioma cell to TMZ-sensitive.
Finally, even if in the present work we did not use normal astrocytes, several in vivo and in vitro reports showed that NS398 doesn’t exert cytotoxicity on normal astrocytes and neurons, including human brain astrocytes and neurons. Indeed, studies with this COX-2 inhibitor mostly highlight Fig. 9 NS398 inhibited wound healing ability of GBM cell lines. Representative phase-contrast micrographs and quantification of scratch assays performed in a U87MG and b T98G GBM cell lines treated with NS398 or with drug vehicle DMSO (CNTR), immediately after the scratch at the initial time (T0) and after 8 h and 24 h. Representative phase-contrast micrographs and quantification of scratch assays performed in (c) U87MG and d T98G GBM cell lines after incubation with EV derived from control (CNTR) neurospheres (+EV CNTR-NS) or NS398-treated neurospheres (+EV NS398-NS). Original magnification 10x. The results, expressed as % wound closure vs relative T0 (mean ± SD), are representative of two independent experiments in duplicate. For comparative analysis of groups of data, two-way ANOVA followed by Bonferroni post hoc test was used (*p < 0.05, **p < 0.01, ****p < 0.0001)
its protective effects in neuroinflammation-associated dis-ease models or high toxicity conditions [81–86].
Conclusions
Altogether, our results strongly support the role of the COX-2/PGE2 system in glioma and glioma stem cell biol-ogy. The COX-2 inhibitor influenced in a similar way both investigated GBM cell lines i.e., U87MG and T98G, despite their intrinsic diversity and individual genetic features, which in turn are associated to a different sensitivity or resistance to TMZ. Although further studies are needed to gain a complete picture of the mechanisms involved in the observed effects, overall, our data help to broaden the range of biological effects caused by NS398.
Abbreviations
GBM: Glioblastoma multiforme; GSCs: Glioma stem cells; COX-2: Cyclooxyge-nase-2; PGE2: Prostaglandin E2; NS398: N -[2-(cyclohexyloxy)-4-nitrophenyl]-methanesulphonamide; EV: Extracellular vesicles; NS: Neurospheres; AVO: Acidic vesicular organelles; AO: Acridine orange.
Acknowledgements
The Authors thank Gasperina De Nuntiis (Department of Life, Health & Envi-ronmental Sciences, University of L’Aquila, L’Aquila, Italy) for excellent technical assistance.
Authors’ contributions
All authors declare the contribution in this paper. PP and BC conceived of the study and participated in its design. PP, FL, FRA and IG performed the experi-ments. PP and FL performed the statistical analysis of data, wrote the original manuscript and produced all figures. MGC, PL, VD and BC supervised the writing of the manuscript and provided overall guidance for the experiments. PP, VD, MGC and BC participated to funding acquisition. IG and VD performed the EV isolation from supernatants and electron microscopy analysis. PP, FL, MGC, and BC reviewed and edited the final version of the manuscript. All authors reviewed the final manuscript. All authors read and approved the final manuscript.
Funding
This research was funded by Department of Life, Health & Environmental Sci-ences, University of L’Aquila grant numbers RIA MCM 2018, RIA SP 2018.
Availability of data and materials
The datasets generated and analyzed during the current study are available from the corresponding authors upon reasonable request.
Ethics approval and consent to participate
Not applicable.
Consent for publication
Not applicable.
Competing interests
The authors declare that they have no competing interests.
Received: 11 February 2020 Accepted: 7 May 2020
References
1. Louis DN, Perry A, Reifenberger G, von Deimling A, Figarella-Branger D, Cavenee WK, et al. The 2016 World Health Organization Classification of Tumors of the Central Nervous System: a summary. Acta Neuropathol. 2016;131(6):803–20.
2. Perus LJM, Walsh LA. Microenvironmental heterogeneity in brain malig-nancies. Front Immunol. 2019;10:2294.
3. Ostrom QT, Gittleman H, Xu J, Kromer C, Wolinsky Y, Kruchko C, et al. CBTRUS statistical report: primary brain and other central nervous system tumors diagnosed in the United States in 2009–2013. Neuro Oncol. 2016;18(suppl_5):v1–75.
4. Shergalis A, Bankhead A 3rd, Luesakul U, Muangsin N, Neamati N. Current challenges and opportunities in treating glioblastoma. Pharmacol Rev. 2018;70(3):412–45.
5. Colotta F, Allavena P, Sica A, Garlanda C, Mantovani A. Cancer-related inflammation, the seventh hallmark of cancer: links to genetic instability. Carcinogenesis. 2009;30(7):1073–81.
6. Quail DF, Joyce JA. The Microenvironmental Landscape of Brain Tumors. Cancer Cell. 2017;31(3):326–41.
7. Wong RSY. Role of Nonsteroidal Anti-Inflammatory Drugs (NSAIDs) in cancer prevention and cancer promotion. Adv Pharmacol Sci. 2019;2019:3418975.
8. Palumbo P, Miconi G, Cinque B, Lombardi F, La Torre C, Dehcordi SR, et al. NOS2 expression in glioma cell lines and glioma primary cell cultures: correlation with neurosphere generation and SOX-2 expression. Onco-target. 2017;8(15):25582–98.
9. Palumbo P, Lombardi F, Siragusa G, Dehcordi SR, Luzzi S, Cimini A, et al. Involvement of NOS2 Activity on Human Glioma Cell Growth, Clonogenic Potential, and Neurosphere Generation. Int J Mol Sci. 2018;19(9). 10. Hashemi Goradel N, Najafi M, Salehi E, Farhood B, Mortezaee K.
Cyclooxy-genase-2 in cancer: a review. J Cell Physiol. 2019;234(5):5683–99. 11. Pang LY, Hurst EA, Argyle DJ. Cyclooxygenase-2: a role in cancer stem cell
survival and repopulation of cancer cells during therapy. Stem Cells Int. 2016;2016:2048731.
12. Qiu J, Shi Z, Jiang J. Cyclooxygenase-2 in glioblastoma multiforme. Drug Discov Today. 2017;22(1):148–56.
13. Prayson RA, Castilla EA, Vogelbaum MA, Barnett GH. Cyclooxygenase-2 (COX-2) expression by immunohistochemistry in glioblastoma multi-forme. Ann Diagn Pathol. 2002;6(3):148–53.
14. Joki T, Heese O, Nikas DC, Bello L, Zhang J, Kraeft SK, et al. Expression of cyclooxygenase 2 (COX-2) in human glioma and in vitro inhibition by a specific COX-2 inhibitor, NS-398. Cancer Res. 2000;60(17):4926–31. 15. Onguru O, Gamsizkan M, Ulutin C, Gunhan O. Cyclooxygenase-2
(Cox-2) expression and angiogenesis in glioblastoma. Neuropathology. 2008;28(1):29–34.
16. Buccoliero AM, Caldarella A, Gheri CF, Taddei A, Paglierani M, Pepi M, et al. Inducible cyclooxygenase (COX-2) in glioblastoma-clinical and immunohistochemical (COX-2-VEGF) correlations. Clin Neuropathol. 2006;25(2):59–66.
17. New P. Cyclooxygenase in the treatment of glioma: its complex role in signal transduction. Cancer Control. 2004;11(3):152–64.
18. Shono T, Tofilon PJ, Bruner JM, Owolabi O, Lang FF. Cyclooxygenase-2 expression in human gliomas: prognostic significance and molecular correlations. Cancer Res. 2001;61(11):4375–81.
19. Sminia P, Stoter TR, van der Valk P, Elkhuizen PH, Tadema TM, Kuipers GK, et al. Expression of cyclooxygenase-2 and epidermal growth factor recep-tor in primary and recurrent glioblastoma multiforme. J Cancer Res Clin Oncol. 2005;131(10):653–61.
20. Cook PJ, Thomas R, Kingsley PJ, Shimizu F, Montrose DC, Marnett LJ, et al. Cox-2-derived PGE2 induces Id1-dependent radiation resist-ance and self-renewal in experimental glioblastoma. Neuro-Oncology. 2016;18(10):1379–89.
21. Ma HI, Chiou SH, Hueng DY, Tai LK, Huang PI, Kao CL, et al. Celecoxib and radioresistant glioblastoma-derived CD133 + cells: improvement in radiotherapeutic effects. Laboratory investigation. J Neurosurg. 2011;114(3):651–62.
22. Wu MG, Guan J, Li C, Gunter S, Nusrat L, Ng S, et al. Aberrantly activated Cox-2 and Wnt signaling interact to maintain cancer stem cells in glioblastoma. Oncotarget. 2017;8(47):82217–30.
23. Sato A, Mizobuchi Y, Nakajima K, Shono K, Fujihara T, Kageji T, et al. Blocking COX-2 induces apoptosis and inhibits cell proliferation via the Akt/survivin- and Akt/ID3 pathway in low-grade-glioma. J Neurooncol. 2017;132(2):231–8.
25. Chiu WT, Shen SC, Chow JM, Lin CW, Shia LT, Chen YC. Contribution of reactive oxygen species to migration/invasion of human glioblastoma cells U87 via ERK-dependent COX-2/PGE(2) activation. Neurobiol Dis. 2010;37(1):118–29.
26. Hara A, Okayasu I. Cyclooxygenase-2 and inducible nitric oxide synthase expression in human astrocytic gliomas: correlation with angiogenesis and prognostic significance. Acta Neuropathol. 2004;108(1):43–8.
27. Wang LZ, Wang Z, Li JH, Zhang WG, Ren FB, Yue W. NFATc1 activation promotes the invasion of U251 human glioblastoma multiforme cells through COX-2. Int J Mol Med. 2015;35(5):1333–40.
28. Xu KM, Shu HKG. EGFR activation results in enhanced cyclooxyge-nase-2 expression through p38 mitogen-activated protein kinase-dependent activation of the Sp1/Sp3 transcription factors in human gliomas. Cancer Res. 2007;67(13):6121–9.
29. Tuettenberg J, Grobholz R, Korn T, Wenz F, Erber R, Vajkoczy P. Continu-ous low-dose chemotherapy plus inhibition of cyclooxygenase-2 as an antiangiogenic therapy of glioblastoma multiforme. J Cancer Res Clin. 2005;131(1):31–40.
30. Tafani M, Di Vito M, Frati A, Pellegrini L, De Santis E, Sette G, et al. Pro-inflammatory gene expression in solid glioblastoma microenvironment and in hypoxic stem cells from human glioblastoma. J Neuroinflamma-tion. 2011;8:32.
31. Rolle CE, Sengupta S, Lesniak MS. Mechanisms of immune evasion by gliomas. Adv Exp Med Biol. 2012;746:53–76.
32. Authier A, Farrand KJ, Broadley KW, Ancelet LR, Hunn MK, Stone S, et al. Enhanced immunosuppression by therapy-exposed glioblastoma multiforme tumor cells. Int J Cancer. 2015;136(11):2566–78. 33. Kang KB, Wang TT, Woon CT, Cheah ES, Moore XL, Zhu C, et al.
Enhancement of glioblastoma radioresponse by a selective COX-2 inhibitor celecoxib: inhibition of tumor angiogenesis with extensive tumor necrosis. Int J Radiat Oncol Biol Phys. 2007;67(3):888–96. 34. Kuipers GK, Slotman BJ, Wedekind LE, Stoter TR, Van Den Berg J, Sminia
P, et al. Radiosensitization of human glioma cells by cyclooxygenase-2 (COX-2) inhibition: independent on COX-2 expression and dependent on the COX-2 inhibitor and sequence of administration. Int J Radiat Biol. 2007;83(10):677–85.
35. Futaki N, Takahashi S, Yokoyama M, Arai I, Higuchi S, Otomo S. NS-398, a new anti-inflammatory agent, selectively inhibits prostaglandin G/H synthase/cyclooxygenase (COX-2) activity in vitro. Prostaglandins. 1994;47(1):55–9.
36. Bacchi S, Palumbo P, Sponta A, Coppolino MF. Clinical pharmacology of non-steroidal anti-inflammatory drugs: a review. AntiInflamm Antial-lergy Agents Med Chem. 2012;11(1):52–64.
37. Matsuo M, Yonemitsu N, Zaitsu M, Ishii K, Hamasaki Y, Fukuyama K, et al. Expression of prostaglandin H synthase-2 in human brain tumors. Acta Neuropathol. 2001;102(2):181–7.
38. Matsuo M, Yoshida N, Zaitsu M, Ishii K, Hamasaki Y. Inhibition of human glioma cell growth by a PHS-2 inhibitor, NS398, and a prostaglandin E receptor subtype EP1-selective antagonist, SC51089. J Neurooncol. 2004;66(3):285–92.
39. Lopez-Valero I, Torres S, Salazar-Roa M, Garcia-Taboada E, Hernandez-Tiedra S, Guzman M, et al. Optimization of a preclinical therapy of cannabinoids in combination with temozolomide against glioma. Biochem Pharmacol. 2018;157:275–84.
40. Yu C, Li WB, Liu JB, Lu JW, Feng JF. Autophagy: novel applications of nonsteroidal anti-inflammatory drugs for primary cancer. Cancer Med. 2018;7(2):471–84.
41. Feng F, Zhang M, Yang C, Heng X, Wu X. The dual roles of autophagy in gliomagenesis and clinical therapy strategies based on autophagic regulation mechanisms. Biomed Pharmacother. 2019;120:109441. 42. Guo JY, White E. Autophagy, metabolism, and cancer. Cold Spring Harb
Symp Quant Biol. 2016;81:73–8.
43. Trejo-Solis C, Serrano-Garcia N, Escamilla-Ramirez A, Castillo-Rodriguez RA, Jimenez-Farfan D, Palencia G, et al. Autophagic and apoptotic pathways as targets for chemotherapy in glioblastoma. Int J Mol Sci. 2018;19(12):E3773.
44. Yang K, Niu L, Bai Y, Le W. Glioblastoma: targeting the autophagy in tumo-rigenesis. Brain Res Bull. 2019;153:334–40.
45. Palumbo P, Lombardi F, Augello FR, Giusti I, Luzzi S, Dolo V, et al. NOS2 inhibitor 1400 W induces autophagic flux and influences extracellular
vesicle profile in human glioblastoma U87MG cell line. Int J Mol Sci. 2019;20(12):3010.
46. Ryskalin L, Gaglione A, Limanaqi F, Biagioni F, Familiari P, Frati A, et al. The Autophagy Status of Cancer Stem Cells in Gliobastoma Multiforme: From Cancer Promotion to Therapeutic Strategies. Int J Mol Sci. 2019;20(15). 47. Shao N, Mao J, Xue L, Wang R, Zhi F, Lan Q. Carnosic acid potentiates the
anticancer effect of temozolomide by inducing apoptosis and autophagy in glioma. J Neurooncol. 2019;141(2):277–88.
48. Yan Y, Xu Z, Dai S, Qian L, Sun L, Gong Z. Targeting autophagy to sensitive glioma to temozolomide treatment. J Exp Clin Cancer Res. 2016;35:23. 49. Buccarelli M, Marconi M, Pacioni S, De Pascalis I, D’Alessandris QG, Martini
M, et al. Inhibition of autophagy increases susceptibility of glioblastoma stem cells to temozolomide by igniting ferroptosis. Cell Death Dis. 2018;9(8):841.
50. Kriel J, Muller-Nedebock K, Maarman G, Mbizana S, Ojuka E, Klumperman B, et al. Coordinated autophagy modulation overcomes glioblastoma chemoresistance through disruption of mitochondrial bioenergetics. Sci Rep. 2018;8(1):10348.
51. Lo Dico A, Martelli C, Diceglie C, Lucignani G, Ottobrini L. Hypoxia-induc-ible factor-1 alpha activity as a switch for glioblastoma responsiveness to temozolomide. Front Oncol. 2018;2(8):249.
52. Pleet ML, Branscome H, DeMarino C, Pinto DO, Zadeh MA, Rodriguez M, et al. Autophagy, EVs, and infections: a perfect question for a perfect time. Front Cell Infect Microbiol. 2018;8:362.
53. Xu J, Camfield R, Gorski SM. The interplay between exosomes and autophagy—partners in crime. J Cell Sci. 2018;131(15):JCS215210. 54. Galluzzi L, Pietrocola F, Bravo-San Pedro JM, Amaravadi RK, Baehrecke
EH, Cecconi F, et al. Autophagy in malignant transformation and cancer progression. EMBO J. 2015;34(7):856–80.
55. Kim S, Jo S, Lee H, Kim TU, Kim IC, Yim JH, et al. Lobarstin enhances chemosensitivity in human glioblastoma T98G cells. Anticancer Res. 2013;33(12):5445–51.
56. Ohba S, Mukherjee J, See WL, Pieper RO. Mutant IDH1-driven cellular transformation increases RAD51-mediated homologous recombination and temozolomide resistance. Cancer Res. 2014;74(17):4836–44. 57. Yi GZ, Liu YW, Xiang W, Wang H, Chen ZY, Xie SD, et al. Akt and
beta-catenin contribute to TMZ resistance and EMT of MGMT negative malig-nant glioma cell line. J Neurol Sci. 2016;367:101–6.
58. Lee SY. Temozolomide resistance in glioblastoma multiforme. Genes Dis. 2016;3(3):198–210.
59. Montaldi AP, Godoy PR, Sakamoto-Hojo ET. APE1/REF-1 down-regulation enhances the cytotoxic effects of temozolomide in a resistant glioblas-toma cell line. Mutat Res Genet Toxicol Environ Mutagen. 2015;793:19–29. 60. Galli R, Binda E, Orfanelli U, Cipelletti B, Gritti A, De Vitis S, et al. Isolation
and characterization of tumorigenic, stem-like neural precursors from human glioblastoma. Cancer Res. 2004;64(19):7011–21.
61. Garnier D, Renoult O, Alves-Guerra MC, Paris F, Pecqueur C. Glioblastoma Stem-Like Cells, Metabolic Strategy to Kill a Challenging Target. Front Oncol. 2019;9:118.
62. Giusti I, Di Francesco M, Cantone L, D’Ascenzo S, Bollati V, Carta G, et al. Time-dependent release of extracellular vesicle subpopulations in tumor CABA I cells. Oncol Rep. 2015;34(5):2752–9.
63. Liu MY, Xie F, Zhang Y, Wang TT, Ma SN, Zhao PX, et al. Molecular hydro-gen suppresses glioblastoma growth via inducing the glioma stem-like cell differentiation. Stem Cell Res Ther. 2019;10(1):145.
64. Ludwig K, Kornblum HI. Molecular markers in glioma. J Neurooncol. 2017;134(3):505–12.
65. Ferreira MT, Gomes RN, Panagopoulos AT, de Almeida FG, Veiga JCE, Colquhoun A. Opposing roles of PGD2 in GBM. Prostaglandins Other Lipid Mediat. 2018;134:66–76.
66. Pyrko P, Soriano N, Kardosh A, Liu YT, Uddin J, Petasis NA, et al. Downregu-lation of survivin expression and concomitant induction of apoptosis by celecoxib and its non-cyclooxygenase-2-inhibitory analog, dimethyl-celecoxib (DMC), in tumor cells in vitro and in vivo. Mol Cancer. 2006;5:19. 67. McFadden DW, Riggs DR, Jackson BJ, Cunningham C. Additive effects
of Cox-1 and Cox-2 inhibition on breast cancer in vitro. Int J Oncol. 2006;29(4):1019–23.
•fast, convenient online submission •
thorough peer review by experienced researchers in your field • rapid publication on acceptance
• support for research data, including large and complex data types •
gold Open Access which fosters wider collaboration and increased citations maximum visibility for your research: over 100M website views per year •
At BMC, research is always in progress.
Learn more biomedcentral.com/submissions
Ready to submit your research? Choose BMC and benefit from: 69. Kimura S, Fujita N, Noda T, Yoshimori T. Monitoring autophagy in
mam-malian cultured cells through the dynamics of LC3. Methods Enzymol. 2009;452:1–12.
70. Mizushima N, Yoshimori T. How to interpret LC3 immunoblotting. Autophagy. 2007;3(6):542–5.
71. Ricklefs FL, Maire CL, Reimer R, Duhrsen L, Kolbe K, Holz M, et al. Imag-ing flow cytometry facilitates multiparametric characterization of extracellular vesicles in malignant brain tumours. J Extracell Vesicles. 2019;8(1):1588555.
72. Thery C, Witwer KW, Aikawa E, Alcaraz MJ, Anderson JD, Andriantsito-haina R, et al. Minimal information for studies of extracellular vesicles 2018 (MISEV2018): a position statement of the International Society for Extracellular Vesicles and update of the MISEV2014 guidelines. J Extracell Vesicles. 2018;7(1):1535750.
73. Annabi B, Laflamme C, Sina A, Lachambre M-P, Beliveau R. A MT1-MMP/ NF-kappaB signaling axis as a checkpoint controller of COX-2 expression in CD133 + U87 glioblastoma cells. J Neuroinflamm. 2009;6:8.
74. Taniura S, Kamitani H, Watanabe T, Eling TE. Induction of cyclooxy-genase-2 expression by interleukin-1beta in human glioma cell line, U87MG. Neurol Med Chir (Tokyo). 2008;48(11):500–5 (discussion 5). 75. Xu K, Wang L, Shu HKG. COX-2 overexpression increases
malig-nant potential of human glioma cells through Id1. Oncotarget. 2014;5(5):1241–52.
76. Jiang J, Qiu J, Li Q, Shi Z. Prostaglandin E2 signaling: alternative target for glioblastoma? Trends Cancer. 2017;3(2):75–8.
77. Bergqvist F, Ossipova E, Idborg H, Raouf J, Checa A, Englund K, et al. Inhi-bition of mPGES-1 or COX-2 results in different proteomic and lipidomic profiles in A549 lung cancer cells. Front Pharmacol. 2019;10:636. 78. Kalimuthu S, Gangadaran P, Rajendran RL, Zhu L, Oh JM, Lee HW, et al.
A new approach for loading anticancer drugs into mesenchymal stem cell-derived exosome mimetics for cancer therapy. Front Pharmacol. 2018;9:1116.
79. Gurpinar E, Grizzle WE, Piazza GA. COX-independent mechanisms of cancer chemoprevention by anti-inflammatory drugs. Front Oncol. 2013;3:181.
80. Pannunzio A, Coluccia M. Cyclooxygenase-1 (COX-1) and COX-1 inhibi-tors in cancer: a review of oncology and medicinal chemistry literature. Pharmaceuticals (Basel). 2018;11(4):E101.
81. Chistyakov DV, Grabeklis S, Goriainov SV, Chistyakov VV, Sergeeva MG, Reiser G. Astrocytes synthesize primary and cyclopentenone prostaglan-dins that are negative regulators of their proliferation. Biochem Biophys Res Commun. 2018;500(2):204–10.
82. Hains BC, Yucra JA, Hulsebosch CE. Reduction of pathological and behav-ioral deficits following spinal cord contusion injury with the selective cyclooxygenase-2 inhibitor NS-398. J Neurotrauma. 2001;18(4):409–23. 83. Kawano T, Anrather J, Zhou P, Park L, Wang G, Frys KA, et al. Prostaglandin
E2 EP1 receptors: downstream effectors of COX-2 neurotoxicity. Nat Med. 2006;12(2):225–9.
84. Kim CH, McBride DW, Sherchan P, Person CE, Gren ECK, Kelln W, et al. Crotalus helleri venom preconditioning reduces postoperative cerebral edema and improves neurological outcomes after surgical brain injury. Neurobiol Dis. 2017;107:66–72.
85. Revathikumar P, Bergqvist F, Gopalakrishnan S, Korotkova M, Jakobsson PJ, Lampa J, et al. Immunomodulatory effects of nicotine on interleukin 1beta activated human astrocytes and the role of cyclooxygenase 2 in the underlying mechanism. J Neuroinflammation. 2016;13(1):256. 86. Verma S, Kumar M, Nerurkar VR. Cyclooxygenase-2 inhibitor blocks the
production of West Nile virus-induced neuroinflammatory markers in astrocytes. J Gen Virol. 2011;92(Pt 3):507–15.
Publisher’s Note