Testing the Predicting Ability of Technical Analysis Classical Patterns in
the Egyptian Stock Market
Osama El-Ansary1 & Dina Mohssen1 1
Faculty of Commerce, Cairo University, Giza, Egypt
Correspondence: Dina Mohssen, Faculty of Commerce, Cairo University, Giza, Egypt.
Received: June 29, 2017 Accepted: July 14, 2017 Online Published: August 1, 2017
doi:10.5430/afr.v6n3p94 URL: https://doi.org/10.5430/afr.v6n3p94
Abstract
As an emerging market, Egyptian stock market is characterized by inefficiency which is confirmed empirically in this research. This provoked us to test the ability of technical analysis classical patterns in predicting the future returns through calculating the expected price target consequently the expected future return and compare it with the actual return.
Statistical techniques and models including Box Pierce (Ljung-Box), Variance ratio test, Runs test, and t-test bootstrapping technique have been applied to test the research proposed hypotheses. The empirical results revealed that the Egyptian stock market is inefficient as returns don’t follow random walk and are dependent, it is found also that the actual returns have significantly exceeded the expected returns of the detected patterns indicating that classical patterns can perfectly predict the direction of the price movements rather than the exact price targets.
Keywords: Technical Analysis, Price patterns, Emerging Market, Bootstrapping technique
1. Introduction
Technical analysis is a timing tool that is being used by traders and investors in the stock markets, forex and commodity markets, emerging and developed markets for the purpose of achieving abnormal returns.
Based on efficient market hypothesis and random walk theory, there is no chance for traders and investors to make abnormal returns, and the future returns are not function of the past returns. The prices already reflect all available information, so that any attempts to outperform the market is subject to failure as prices quickly adjust to new information especially with the existence of the internet that made the dissemination of news to be very fast. It is impossible to consistently beat the market. (Ali; Mustafa & Zaman 2001; Cahn & Arrif 2002; Stout 2003; Sakalauskas & Kriksciuniene 2009).
However, it is not the case in the real investment environment, obtaining information is not a simple process, it is a costly process that there is still hidden unpublic information upon which insider traders can use to achieve profits on behalf of the public. There is no ultimate rationality in the decision-making process and there is no pure efficient market which in turn opens the door for exploring strategies and techniques to beat the market as much as possible. Grossman & Stiglitz 1980; Black 1986; Bernstein 1998 and Stout 2003).
Even the available information may be interpreted differently by different investors and traders, otherwise there wouldn’t be buyers and sellers on the same stock at the same time. This indicates that some traders are positive about the stock and willing to buy, while others are negative about the stock or even in need for liquidity and want to sell.
A previous study detected an overreaction effect in the stock market prices when applied on CRSP monthly return data. The overreaction effect was confirmed when P/E ratio and January phenomena have been observed in the selected stocks especially for the loser portfolio, that is formed of stocks with extreme negative return (De Bondt & Thaler, 1985).
The value added of this research that it is one of very few researches that have been conducted on the Egyptian stock market. As the best of our knowledge, no study related to technical analysis has been excessively focused on the Egyptian stock market to test the psychological effect of the price patterns for predicting future returns. It is observed also that the majority of the conducted studies in the area of technical analysis focus on specific price pattern/patterns and test their predicting ability on the selected sample; however, we tested the predicting ability of all detected price pattern types as much as possible. The Majority of the studies use specific soft wares to detect the price patterns which enables researchers to speed up the analysis process; however, this method loses flexibility and subjectivity in detecting the patterns. Technical analysis is about psychology where flexibility and subjectivity are needed when analyzing price movements.
The objective of the research is to prove the statistical significance of the classical price patterns effect on the Egyptian stock market returns. The research aim at testing whether the expected returns of the detected price patterns signals significantly equal to or exceed the actual returns. This would enhance the investment performance of the traders and investors.
There are some limitations in the research that include: 1. It took us long time to perform the analysis of technical rules at the time that some other researchers use expert systems to identify the price patterns and indicators in an objective way by entering fixed specific rules to the system so that the system considers the pattern as formulated only when the entered conditions or rules are satisfied to avoid the subjective selection; however, as mentioned before we believe that technical analysis is about sentiment and subjectivity and there is no need to be very objective in analyzing price movements. 2. Unlike international markets, the Egyptian stock market lacks that much historical data set that results in plenty of observations and increases the accuracy of the results.
This study proceeds as follows: section one is an introduction to the research, section two presents the literature review, section three is the theoretical background, section four provides details about research methodology and empirical results, section five presents the main conclusions of the research, finally section six presents the recommendations and future researches.
2. Literature Review
Technical analysis is based on the past prices data that is sometimes accompanied with the volume data for the purpose of predicting future price movements, achieving abnormal returns and reducing the risk of capital loss. It is being used now heavily by fund managers in most countries including the United states and is an important investment decision-making tool for short term traders. Technical Analysis has been defined in the literature as a science in terms of recording historical price changes in graphical form, and has been defined also as an art in terms of its great talent in discovering and identifying trend in an early stage letting traders and investors join the trend at the beginning and hold until an evidence for reversing the current trend (Pring 2002, P.3; Edward; Magee & Bassetti 2006, P.4; Fang; Qin and Jacobsen 2014; Shynkevich 2016).
2.1 Technical Analysis and Behavioral Finance
Although finance theory had denied the idea of technical analysis being affected by the Efficient Market Hypothesis, a new approach of finance theory, behavioral finance, shed the light on the importance of considering people and their behavior, consequently considering technical analysis which is the study of the behavior and psychology of the traders and investors.
Behavioral finance is considered a blind between psychology and finance that tend to explain the irrationality in the investor decision-making process. It became the basis for technical analysis, where the investors' sentiment and psychology that have been unproven for a long time can now be explained by technical analysis in terms of series of repeated patterns and trends showing their greed and fear (Murphy 1986; Kirkpatrick and Dahlquist 2007; Jasemi; Kimiagarri & Memariani 2011)
2.2 Technical Analysis is a Matter of Signals and Signs
Based on Jasemi et al. (2011) research “technical analysis is about signals and signs where signs are generated by the stock price alteration and signals are restricted to three states of ascending, descending and neutral”.
2.3 The Predicting Ability of Technical Analysis
The interest of conducting researches on the predicting power of technical analysis increased since 1990 on different periods of time and different markets including the currency market, stock markets, bond, and commodity markets.
Previous researches questioned the ability of consistently achieving abnormal return through technical analysis assuming that the deviation of prices from random walk behavior is not a proof for profit opportunities. It was believed that chart reading is of no real value to the stock market investors and traders (Bessembinder and Chan, 1995). Fang et al. (2014); Fama and Blume (1966) and Jensen and Bennington (1970); Fama (1965, 1970)
However, a growing body of literature has been recognized recently that technical analysis could generate abnormal returns. For example (Zapranis & Tsinaslanidis 2012; Cervello-Royo; Guijarro & Michniuk 2015) for classical price patterns, (Marshall & Cahan 2005; Gustafsson 2012; Ülkü & Prodan 2013; Boboc & Dinică 2013; Baetje & Menkhoff 2016; Chen; Su & Lin 2016; El-Ansary & Atuea 2017) for technical indicators and (Brock; Lakonishok & LeBaron 1992; Bessembinder & Chan 1995) for both technical patterns and indicators. There was a common conclusion that returns achieved using technical rules significantly exceeded the returns generated through buy and hold strategy and that technical rules can help in predicting future returns.
Ko; Lin; Su and Chang (2014) could enhance the performance of investment portfolio that is based on the book to market ratio strategy through supplementing the filtering process of the stocks by technical analysis rules. a previous study found that technical rules can help in predicting the future returns of us Bond market, especially corporate bonds with low credit rate and short maturity. It has been found also that the predicting ability is reduced overtime that has been attributed to the improved efficiency of US Bond market (Shynkevich, 2016). Supporting Shynkevich, 2016 study it has been found that technical trading rules can provide opportunities for achieving abnormal returns in the forex market but not persistently, recommending traders to update their portfolios and technical rules from time to time to be able to beat the market (Zarrabi, Snaith, and Coakley, 2017). A recent study has developed an innovative strategy based on the flag pattern and exponential moving average that could achieve abnormal return even after adjusting for data snooping and considering transaction cost (Arévalo, R.; García, J.; Guijarro, F. and Peris, A. 2017)
2.4 Literature Review for the Egyptian Stock Market
Very few studies related to technical analysis have been conducted where the Egyptian stock was its main concern. Although practitioners use different schools of technical analysis in an attempt to achieve abnormal return, academic researchers were concerned more with the technical indicators due to the difficulty of testing the other schools of technical analysis, especially the visual price patterns. This is because the analysis of visual patterns is subjective and may be affected by the analyst’s personality.
A previous study (El Geziry and Abdel Rahman, 2013) examined the predicting ability of sentiment indicators for the future returns in the Egyptian Stock Market. Although the results indicated that there is significant predictive power for the sentiment indicators using regression analysis model, it is weak as the model explains only 0.097 of the return. It has been discovered that the predictive capability of the historical returns has higher significance than the sentiment indicators only as it explained 0.825 of the return and that combining both in a multiple regression model has the most significant capability for predicting the future returns where it explained 0.859 of the return. This indicates that combining different indicators signals and supplementing them with other analytical tools may yield better returns and enhance the investment decision.
A recent evidence supported the above studies and confirmed the ability of technical indicators in achieving abnormal returns (El-Ansary and Atuea, 2017). It is concluded that the average returns of Money flow index, RSI and K-Stochastic oscillator are significantly higher than the average return of buy and hold strategy in the short and long term, bull and bear market, on the individual level when applied on 27 of the constituents of EGX30, and on the aggregate level when applied on the EGX30 Index itself. The return was significantly higher than buy and hold strategy before as well as after the Egyptian revolution.
3. Theoretical Background
There are different schools of technical analysis including: first: The classical school that is related to simple support and resistance levels, trend lines, price formations, candlesticks and point and figure patterns. Second: technical indicators that are based on statistical calculations involving price, volume, breadth and sentiment indicators. Third: Elliot waves and cycles (Murphy 1986; Edward et al 2006; Pring 2002; Kirkpatrik & Dahlquist, 2007)
finalizes when a breakout occurs from the upper or lower boundary of such a pattern” (Kirkpatrik & Dahlquist, 2007, P.302). Those patterns have a fractal characteristic, meaning that it is able to be formed in different time horizon or length and still have same characteristics and effects. There are many price formations in the technical analysis books; however, the following are the most popular and most frequent patterns in the stock markets: Trend line breakout, Channels, double tops and bottoms, head & shoulder and inverted head and shoulder, trading range, triangles, rising and falling wedges, saucer or cup and handle pattern.
Those patterns are considered a halt in the chart that is either followed by reversal or continuation for the original trend. The signal occurs when the pattern is broken from either the upper or the lower bound and the majority of them have specific rules for calculating its expected price target, usually the height of the pattern or of its base in case of triangle formations.
4. Research Methodology
4.1 Data Source, Population, and Sample
4.1.1 Data source
Historical prices have been used that are obtained from Mubasher Software, which is Egyptian software include updated data about Egyptian and Arab stock markets.
4.1.2 Population
The population is the historical data of Egyptian stock market Indexes and listed companies
4.1.3 Sample
- We used the daily closing prices of the EGX30 Index to test the efficiency of the market and used also the historical data represented in form of charts on a daily basis for the constituents of EGX30 Index to analyze and detect the available classical price patterns.
- We explored the charts of each of the 30 constituents for the period started from the beginning of 2005 through the beginning of 2016 as available, searching for every clear classical pattern from our point of view and determining the expected price target to compare it with the actual price movement, in other words comparing the expected returns of the price patterns with the actual returns. The actual return is the return occurred from the closing price after the breakout of the pattern till the reversal of the move by another pattern.
- EGX30 index has been selected as it is the most popular index for investors and traders in the Egyptian stock market. It includes the most active 30 traded companies of the whole listed ones.
- The tested companies are listed in the following table:
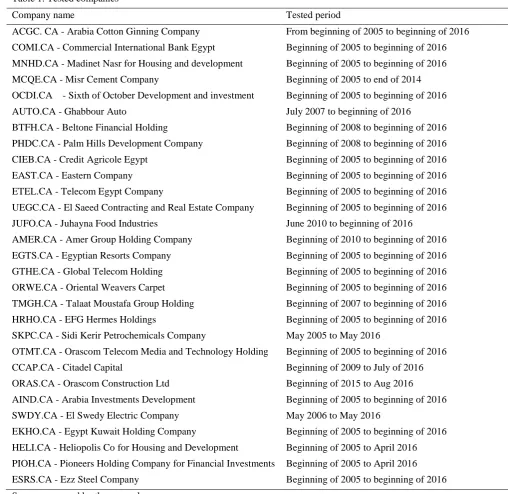
Table 1. Tested companies
Company name Tested period
ACGC. CA - Arabia Cotton Ginning Company
COMI.CA - Commercial International Bank Egypt
MNHD.CA - Madinet Nasr for Housing and development
MCQE.CA - Misr Cement Company
OCDI.CA - Sixth of October Development and investment
AUTO.CA - Ghabbour Auto
BTFH.CA - Beltone Financial Holding
PHDC.CA - Palm Hills Development Company
CIEB.CA - Credit Agricole Egypt
EAST.CA - Eastern Company
ETEL.CA - Telecom Egypt Company
UEGC.CA - El Saeed Contracting and Real Estate Company
JUFO.CA - Juhayna Food Industries
AMER.CA - Amer Group Holding Company
EGTS.CA - Egyptian Resorts Company
GTHE.CA - Global Telecom Holding
ORWE.CA - Oriental Weavers Carpet
TMGH.CA - Talaat Moustafa Group Holding
HRHO.CA - EFG Hermes Holdings
SKPC.CA - Sidi Kerir Petrochemicals Company
OTMT.CA - Orascom Telecom Media and Technology Holding
CCAP.CA - Citadel Capital
ORAS.CA - Orascom Construction Ltd
AIND.CA - Arabia Investments Development
SWDY.CA - El Swedy Electric Company
EKHO.CA - Egypt Kuwait Holding Company
HELI.CA - Heliopolis Co for Housing and Development
PIOH.CA - Pioneers Holding Company for Financial Investments
ESRS.CA - Ezz Steel Company
From beginning of 2005 to beginning of 2016
Beginning of 2005 to beginning of 2016
Beginning of 2005 to beginning of 2016
Beginning of 2005 to end of 2014
Beginning of 2005 to beginning of 2016
July 2007 to beginning of 2016
Beginning of 2008 to beginning of 2016
Beginning of 2008 to beginning of 2016
Beginning of 2005 to beginning of 2016
Beginning of 2005 to beginning of 2016
Beginning of 2005 to beginning of 2016
Beginning of 2005 to beginning of 2016
June 2010 to beginning of 2016
Beginning of 2010 to beginning of 2016
Beginning of 2005 to beginning of 2016
Beginning of 2005 to beginning of 2016
Beginning of 2005 to beginning of 2016
Beginning of 2007 to beginning of 2016
Beginning of 2005 to beginning of 2016
May 2005 to May 2016
Beginning of 2005 to beginning of 2016
Beginning of 2009 to July of 2016
Beginning of 2015 to Aug 2016
Beginning of 2005 to beginning of 2016
May 2006 to May 2016
Beginning of 2005 to beginning of 2016
Beginning of 2005 to April 2016
Beginning of 2005 to April 2016
Beginning of 2005 to beginning of 2016
Source: prepared by the researchers
4.2 Statistical Techniques
4.3 The Research Hypotheses
H.1: The Egyptian stock market is inefficient.
H.2: Signals of Technical Analysis Classical patterns can significantly predict the future price movements of the Egyptian stock market
4.4 The Research Empirical Results
4.4.1 Regarding hypothesis one that states that: The Egyptian stock market is inefficient.
The Egyptian stock market is one of the emerging markets that are characterized by inefficiency. El Geziry and Abdel Rahman (2013) have already proven that the return series are not normally distributed and that the historical returns can significantly predict the future returns. Those results indicate that the Egyptian stock market is inefficient. It is proven recently also by Arshad; Rezvi and Ghani (2016) That the Egyptian stock market is ranked at very low level of efficiency relative to other tested countries, Organization of Islamic Conference (OIC) members, in short term. They found that major events such as 11th of September attacks, the global financial crisis, and the Arab spring had catastrophic implications for the Egyptian stock market which led to higher levels of inefficiency. They attributed this to the highly volatile market, limited provision of information to the market participants accompanied by limited financial intermediaries; however, in the long run, Egypt could achieve an economic boom and the market was able to recover. We would like to confirm the inefficiency of the market as follows:
Hypothesis one will be confirmed through proving that the daily returns don’t follow random walk we applied Box pierce (Ljung-Box) test, Lo & Mackinlay’s single variance ratio test following Gustafsson (2012); Marshall and Cahan (2005), we applied also Runs test and the results are as follows:
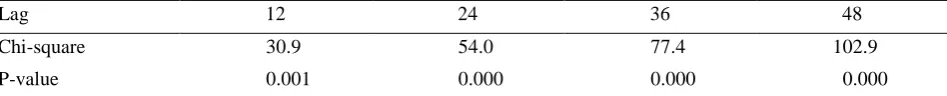
The results of Box pierce test are shown in the following table:
Table 2. The results of Box-Pierce (Ljung-Box) Chi-square statistic:
Lag 12 24 36 48
Chi-square 30.9 54.0 77.4 102.9
P-value 0.001 0.000 0.000 0.000
Source: prepared by the researchers
It is indicated from the above table that the p-value of all lag numbers is less than 0.01 with a confidence level of 95%, which means that we accept the stated sub-hypothesis H1.1 that the daily returns of EGX30 index don’t follow random walk theory. This means that returns are dependent confirming the inefficiency of the Egyptian stock market.
The results of the variance ratio test are shown in the following tables:
Table 3. The joint test result of the variance ratio
Joint tests value df Prob.
Max [z] (at period 2)* 12.34687 758 0.000
Source: prepared by the researchers
Table 4. Individual tests of variance ratio:
Period Variance ratio Std. Error z-statistic Prob.
2
4
8
16
0.47347
0.26074
0.14394
0.08197
0.04264
0.06863
0.08891
0.11231
-12.34687
-10.77049
-9.628313
-8.182002
0.000
0.000
0.000
0.000
Source: prepared by the researcher
If the value of variance ratio =1 this means that the market is efficient and that returns follow random walk. The value of z statistic is significant when exceeds |2|.
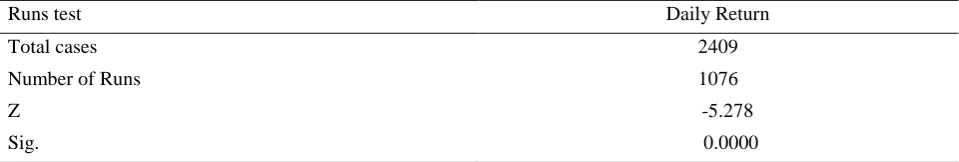
The results of Runs test are shown in the following table:
We conducted the Runs test to measure the degree to which the data are biased or follow random walk. Significant p-value indicates that the return data are biased (dependent) and don’t follow random walk. The results of the test are as following:
Table 5. Runs test
Runs test Daily Return
Total cases
Number of Runs
Z
Sig.
2409
1076
-5.278
0.0000
Source: prepared by the researchers.
In the above table, the number of runs refers to the common events (ie. common return direction), in other words up/down trends in the market.
The above table indicated that p-value is lower than 0.01 at a confidence level of 95% meaning that return data are biased or dependent, and that there are 1067 group of common cases confirming the probability that return of one day follow returns of previous days. Accordingly, we can conclude that returns don’t follow random walk.
We can conclude from the above conducted tests that returns in the Egyptian stock market are generally dependent and don’t follow random walk, which in turn confirms the inefficiency of the market. This result indicates also that we can predict future returns based on the past returns which is one of the main tenets of technical analysis. Technical analysis is all about predicting future price movements based on the historical prices and repeated patterns. It is about studying the behavior and psychology of the investors and traders in the market believing that humans usually behave commonly in the same historical circumstances. Their thoughts and expectations are translated into buy and sell transactions forming repeated price patterns that can be predictable (Kirkpatrick & Dahlquist, 2007, p.17). That is why we were interested in testing the predicting ability of those price patterns that in turn will help traders and investors achieve abnormal returns and reduce the risk of capital loss.
4.4.2 Regarding hypothesis two that states that: Signals of Technical Analysis classical patterns can significantly predict the future price movements of the Egyptian stock market
In order to test the second hypothesis, we analyzed the charts of EGX30 index constituents detecting the classical patterns of technical analysis. Then calculated the expected targets of the detected patterns based on technical analysis rules. Usually, the price target is to calculate the height of the pattern or the height of its base and add it to the breakout price level if it is a bullish pattern or deduct it from the breakdown price level if it is a bearish pattern. The buy or sell signal will be considered after breaking out/down and closing above/below the pattern. The actual return is calculated from the breakout level till new buy or sell signal appears following Marshall and Cahan (2005). For the ease of analysis, we considered all returns whether positive or negative as positive returns.
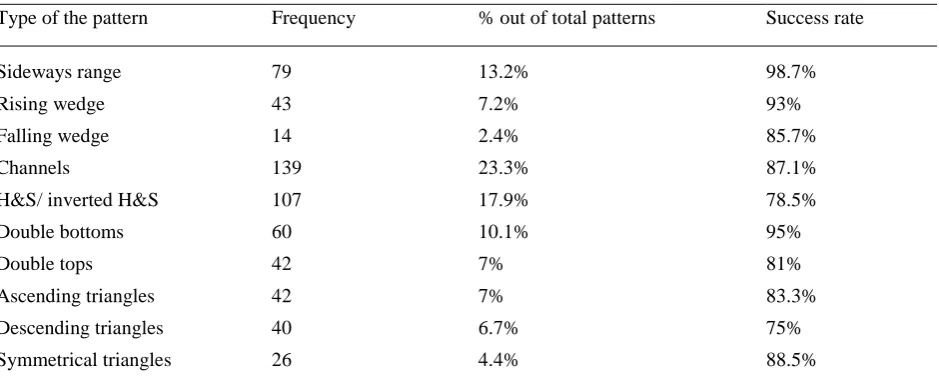
Number of detected patterns were 598 patterns, where 86.5% of total patterns succeeded to achieve or exceed the expected targets. The average actual return was around 44% while the average expected return was around 18.4%. Bearish patterns slightly exceeded the bullish ones as represented 58.6% of total patterns, where 81.4% of the bearish patterns succeeded to achieve or exceed the expected returns, while the success rate of the bullish pattern was 93.6%.
Table 6. Classifications of classical patterns and their success rate:
Type of the pattern Frequency % out of total patterns Success rate
Sideways range
Rising wedge
Falling wedge
Channels
H&S/ inverted H&S
Double bottoms
Double tops
Ascending triangles
Descending triangles
Symmetrical triangles
79
43
14
139
107
60
42
42
40
26
13.2%
7.2%
2.4%
23.3%
17.9%
10.1%
7%
7%
6.7%
4.4%
98.7%
93%
85.7%
87.1%
78.5%
95%
81%
83.3%
75%
88.5%
Source: prepared by the researchers.
It is clear from above table that the success rate of patterns is generally high; however, channels are the most frequent pattern representing 23.3% of the whole detected patterns with success rate 85.7%, followed by the H&S pattern with a success rate of 78.5%, while the pattern with the highest success rate is the sideways range 98.7% representing 13.2% of the total patterns followed by double bottoms with success rate of 95%.
It is clear from the above table also that the Egyptian stock market includes a great variety of predictable price patterns that can be used to achieve abnormal return or reduce capital loss as much as possible. It has been observed that the reaction of traders or investors after the breakout/breakdown of similar patterns is the same that is called in technical analysis books the fractal effect (Kirkpatrick & Dahlquist, 2007, p.18).
It has been observed also that triangles and double tops patterns have a low frequency in the Egyptian stock market relative to other patterns, but have a high success rate.
After determining the available patterns in the selected sample of the Egyptian stock market, and calculating the expected and actual returns that are resulted from generated signals of the patterns, we used t-test bootstrapping technique to compare the expected returns of the patterns with the actual returns.
We started with F statistics of Levene’s test so that we can determine whether we will assume equal variances or not. The following table shows the results
Table 7. Levene’s test for equality of variances Levene’s test for equality of variances
F Sig.
119.43 0.000
Source: prepared by the researchers.
The above table of F statistics for Levene’s test showed a significant P value, so we used the t-test result where equal variances are not assumed in the bootstrapping test. The following table clarifies the results.
Table 8. Bootstrap t-test between the expected and actual returns resulted from classical technical patterns signals
Mean difference
Bootstrap
Bias Std. error Sig. (2-tailed)
Equal variances assumed 0.25705 -0.00028 0.02120 0.001
Equal variances not assumed 0.25705 -0.00028 0.02120 0.001
Source: prepared by the researchers.
than 0.01 at 95% confidence level, and according to the mean returns of each (expected and actual returns) mentioned before, it is clear that the actual return is significantly higher than the expected return. This means that the expected price target of the pattern is usually the minimum target to be achieved.
5. Conclusion
We performed efficiency tests for the Egyptian Stock Market and found that daily returns of EGX30 don’t follow a random walk theory and that return of day (t+1) is a function of return of day (t-n). In other words, future returns can be predicted through past returns. Accordingly, it is concluded that Egyptian stock market is characterized by inefficiency supporting the results of El Geziry and Abdel Rahman (2013) and Arshad et al. (2016). We can conclude also that the Egyptian stock market is a good ground to apply technical analysis for the purpose of achieving abnormal returns due to its inefficiency. Although the Egyptian stock market doesn’t have that large data set of international markets, we analyzed around 10 years period of time starting from 2005 to the beginning of 2016 as available which can yield a satisfactory result to be inferred.
We applied the t-test bootstrapping technique to compare the expected return of the classical patterns signals that is calculated through special rules of technical analysis with the actual return. We inspected the patterns visually without the help of any available software that can determine the patterns automatically by setting the rules required to form each pattern, so that it took us long time for executing our analysis; however, we preferred not to use objective approaches for inspecting the patterns to keep flexibility required in analyzing the psychology behind each pattern.
Generally, we could conclude that the classical technical patterns can significantly predict the direction of the price movements which supports the studies of many researchers such as: (Brock et al. 1992; Bessembinder and Chan 1995; Zapranis and Tsinaslanidis 2012; Cervello-Royo et al. 2015). The results indicated that the actual returns of classical patterns significantly exceed the expected returns, this means that classical patterns can predict the direction of the future price movements rather than accurately predicting exact price targets. The expected price targets of the patterns are usually the minimum targets to be achieved. Accordingly, classical technical patterns signals can significantly help traders and investors achieve abnormal returns or save their capital loss through predicting the future action of the crowd and consequently the future price movements and initial price targets.
We observed that patterns such as (H&S, inverted H&S, triangles (ascending, descending and symmetrical triangles), rising/ falling wedge, sideways range, double tops, double bottoms, upward/ downward channels) are frequently formed in the Egyptian stock market and has a general success rate of 85.5%. The word Success here means that the actual returns achieve or exceed the expected returns. We observed also that bearish patterns had a high success rate which is an indication that applying short selling in the Egyptian stock market will yield profits for the traders. Among detected patterns, sideways range and double bottom patterns had the highest success rate, while channels and H&S patterns were the most frequent.
It has been observed also that the fractal concept exists in the technical analysis price patterns where the same pattern has the same psychology and price reaction after the breakout/down regardless the length of the pattern or the time period where it has been detected. For example, the H&S pattern has the same psychology during the formation and after the breakdown, whether it is formed in few days, few months or even few years. All the difference is that the longer the time it took the pattern to be formed the higher the expected target is. Breaking down H&S patterns whether in the long or short term reflects the negative impression and expectations of traders and investors and denotes a coming drawdown. This is applicable also to all other price patterns.
From the above concluded results we can initiate the following recommendations and future researches:
6. Recommendations and Future Researches
6.1 Recommendations
6.2 Future Researches
Further researches may need to be conducted while considering the important economic and political events affected the Egyptian stock market
A comparison between Egyptian and other emerging markets can be conducted while testing the predicting ability of price patterns to enrich the research
A comparison between technical analysis patterns prediction power with fundamental analysis prediction power will be of a value added to the literature
References
Ali, S. S.; Mustafa, K. & Zaman, A. (2001). Testing semi-strong form efficiency of stock market. The Pakistan
Development Review, 40(4), papers and proceedings Part II, Seventeenth Annual General Meeting and
Conference of Pakistan society of development Economists Islamabad, Jan 14-16, pp. 651-674.
Arévalo, R.; García, J.; Guijarro, F. & Peris, A. (2017). A dynamic trading rule based on filtered flag pattern recognition for stock market price forecasting. Experts Systems With Applications, 81, 177-192. https://doi.org/10.1016/j.eswa.2017.03.028
Arshad, S.; Rezvi, S. A. R. & Ghani, G. M. (2016). Investigating stock market efficiency: A look at OIC member countries. Research in international business and finance, 36, 402-413. https://doi.org/10.1016/j.ribaf.2015.09.026
Baetje, F. & Menkhoff, L. (2016). Equity premium prediction: Are economic and technical indicators unstable?
International journal of forecasting, 32, 1193-1207. https://doi.org/10.1016/j.ijforecast.2016.02.006
Bernstein, P. (1999). Why the Efficient Market Offers Hope to Active Management. In Economics and Portfolio
Strategy, 12(2), 129-136. https://doi.org/10.1111/j.1745-6622.1999.tb00014.x
Bessembinder, H. & Chan, K. (1995). The profitability of technical trading rules in the Asian Stock Markets. Pacific
B-Basin Finance Journal, 3, 257-284. https://doi.org/10.1016/0927-538X(95)00002-3
Black, F. (1986). Noise. Journal of Finance, 41(3), 529-543. https://doi.org/10.1111/j.1540-6261.1986.tb04513.x
Boboc, I-A. & Dinican, M-C. (2013). An Algorithm for Testing the Efficient Market Hypothesis. PLoS ONE, 8(10), e78177., vol. 8, issue.10. https://doi.org/10.1371/journal.pone.0078177
Brock, W.; Lakonishok, J. & LeBaron, B. (1992). Simple technical trading rules and the stochastic properties of stock returns. Journal of finance, 47(5), 1731-1764. https://doi.org/10.1111/j.1540-6261.1992.tb04681.x
Chan, D. & Ariff, M. (2002). Speed of share price adjustment to information. Managerial Finance, 28(8), 44-65. https://doi.org/10.1108/03074350210768004
Chen, CH.; Su, XQ. & Lin, JB. (2016). The role of information uncertainty in moving average technical analysis: A study of individual stock-option issuance in Taiwan. Finance Research Letters, 18, 263-272. https://doi.org/10.1016/j.frl.2016.04.026
Cervello-Royo, R.; GuiJarro, F. & Michniuk, K. (2015). Stock market trading rule based on pattern recognition and technical analysis: Forecasting the DJIA Index with intraday data. Expert systems with Applications, 42(14), 5963-5975. https://doi.org/10.1016/j.eswa.2015.03.017
De Bondt, W. F. M & Thaler, R. (1985). Does the Stock Market Overreact? The Journal of Finance, 40(3), 793-805. https://doi.org/10.1111/j.1540-6261.1985.tb05004.x
Edward, R. D.; Magee, J. & Bassetti, W. H. C. (2006). Technical analysis of stock trends. 9th edition, CRC press, Tailor and Francic Group. https://doi.org/10.1201/b14301
El-Ansary, O. & Atuea, M. (2017). Testing the Effect of Technical Analysis Strategies on Achieving Abnormal Return: Evidence from Egyptian Stock Market. Accounting and Finance Research, 6(2). https://doi.org/10.5430/afr.v6n2p26
El Geziryn, K. (Professor of Finance-Supervisor) & Abdel Rahman, N. (2013). The Impact of Investor Sentiment on Stock Market Return: The Case of Egypt. Dissertation for Ph.D. Degree Cairo University.
FAMA, E. F. (1965). The Behavior of Stock Market Prices. Journal of Business, 38(1). https://doi.org/10.1086/294743
FAMA, E. F. & Blume, M. E. (1966). Filter Rules and Stock Market Trading. The Journal of Business, 39(1), 226-241. https://doi.org/10.1086/294849
Fang, J.; Qin, Y. & Jacobsen, B. (2014). Technical market indicators: An overview. Journal of behavioral and
experimental finance, 4, 25-56. https://doi.org/10.1016/j.jbef.2014.09.001
Grossman, S. J. & Stiglitz, J. E. (1980). On the Impossibility of Informationally Efficient Markets. The American
Economic Review, 70(3), 393-408.
Gustafsson, D. (2012). The validity of Technical Analysis for The Swedish Stock Exchange: Evidence from Random Walk tests and back testing analysis. Jonkoping University, Jonkoping International Business School- JIBS, Economics, Finance and Statistics, Independent thesis Advanced level, Degree of Master. Available in: urn:nbn:se:hj:diva-18427.
Jasemi, M.; Kimiagarri A. & Memariani, A. (2011). A modern neural network model to do stock market timing on the basis of the ancient investment technique of Japanese Candlestick. Journal of Expert Systems with
Applications, 38(4), 3884–3890. https://doi.org/10.1016/j.eswa.2010.09.049
Jensen, M. C. & Binington, G. A. (1970). Random walks and Technical Theories: Some Additional Evidence.
Journal of Finance, 25(2), 469-482. https://doi.org/10.1111/j.1540-6261.1970.tb00671.x
Kirkpatrick, C. D. & Dahlquist, J. R. (2007). Technical Analysis: The complete resource for financial Market Technicians. Pearson Education, Inc, FT press. https://doi.org/10.5860/choice.48-5201
Marshall, B. R. & Cahan, R. H. (2005). Is technical analysis profitable on a stock market which has characteristics that suggest it may be inefficient? Research in International Business and Finance, 19(3), 384-398. https://doi.org/10.1016/j.ribaf.2005.05.001
Murphy, J. (1986). Technical analysis of the financial markets: A comprehensive guide to trading methods and applications. New York Institute of Finance: Prentice Hall Press. https://doi.org/10.5860/choice.36-4016
Pring, M. J. (2002). Technical Analysis Explained: the successful investors guide to spotting investment trends and
turning points. Fourth edition, McGraw-Hill companies.
Sakalauskas, V. & Kriksciuniene, D. (2009). Application of Neural Networks for Investigating Day-of-the-Week-Effect in Stock Market. Tools and Applications with Artificial intelligence, SCI 166, 77-87. https://doi.org/10.1007/978-3-540-88069-1_7
Shynkevich, A. (2016). Predictability in bond returns using technical trading rules. Journal of Banking and Finance, 70, 55-69. https://doi.org/10.1016/j.jbankfin.2016.06.010
Stout, L. A. (2003). The Mechanisms of Market Inefficiency: An Introduction to the New Finance. UCLA School of Law, Law & Econ, Research Paper No. 03-23. http://dx.doi.org/10.2139/ssrn.470161
Ülkü, N. & Prodan, E. (2013). Drivers of technical trend following rules' profitability in world stock markets.
International Review of Financial Analysis, 30, 214–229. https://doi.org/10.1016/j.irfa.2013.08.005
Zapranis A, Tsinaslanidis P. E. (2012). A novel, rule-based technical pattern identification mechanism: identifying and evaluating saucers and resistant levels in the US stock market. Expert Syst Appl, 39(7), 6301–6308. https://doi.org/10.1016/j.eswa.2011.11.079
Zarrabi, N.; Sanith, S. & Coakley, J. (2017). FX technical trading rules can be profitable sometimes! International