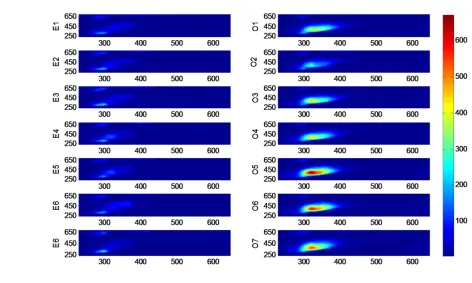
3D front-face fluorescence spectroscopy for characterization of extra virgin olive oil and olive oil according to the spectral pattern
Full text
Figure


Related documents
Indoor environment in retrofitted buildings, that are supposed to perform in the manner of modern construction, is more similar to the boundary conditions but there
Meaningful correlation between the administration of Extra Virgin Olive Oil (EVOO) with the expression of Vascular Endothelial Growth Factor (VEGF) and arteriole number on
Shall be elected for a one (1) year term at the May or November Intergroup Representatives meeting and begin term at the July or January Meeting (Alternate elections for
The effects of the oxidation process induced by thermal treatment on some extra-virgin olive oil samples from different region were investigated by FTIR spectroscopy combined
Event Distances: 1000m Freestyle 500m Freestyle 200m Freestyle 100m Freestyle
Although the phenolic compounds in olive oil vary widely, extra virgin olive oil has a higher phenolic content than refined virgin olive oil [7,15] this difference was reflected
2 The effect of machinery groups, packing materials and light intensities on the extra virgin olive oil (EVOO) quality indexes were studied, where EVOO for one season of
The complete phenolic extracts of extra virgin olive oil and the characteristics of effective components of olive oil on hormone replacement of bone loss were
