Comparative analysis of Chemical Oxygen Demand removal rates
of continuous and sludge bed biogas processes applied to
organic waste
K. N. Nwaigwe
1*, C. Ononogbo
2,
E. E. Anyanwu
2, C. C. Enweremadu
1 (1. Department of Mechanical and Industrial Engineering, University of South Africa, Science Campus Florida, 1710, South Africa;2. Department of Mechanical Engineering, Federal University of Technology Owerri, PMB 1526, Nigeria)
Abstract: The Chemical Oxygen Demand (COD) end value of effluent discharged from a bioreactor into the environment is a
critical indicator of its capacity to pollute the environment. A comparative parametric analysis of COD removal rate using three different biogas digesters is presented. The three bioreactors are Upflow Anaerobic Sludge Blanket (UASB), Upflow Bioreactor with Central Substrate Dispenser (UBCSD), and Continuous Stirred-Tank Reactor (CSTR) known as Module I, Module II and Module III respectively. In order to select the most fitting bioreactor type among the three considered, experimentation was carried out using organic municipal waste (OMW) as substrate. A 10-day hydraulic retention time (HRT) was used, while cattle rumen microbes were used to improve digestion rate. UBCSD showed the highest level of percentage COD removal of 95.2%, followed by the CSTR with a value of 80.8%; while the UASB offered the lowest level of percentage COD removal of 79.0%. This outcome indicates that effluent from the UBCSD digested substrate is more suitable and safer for use as organic fertilizer in agricultural practices. It similarly implies that a bioreactor with enhanced mixing capacity is safer for digestion.
Keywords: Chemical Oxygen Demand, biogas digesters, parametric analysis, hydraulic retention time
Citation:. Nwaigwe, K. N., C. Ononogbo, E. E. Anyanwu, and C. C. Enweremadu. 2017. Comparative analysis of Chemical
Oxygen Demand removal rates of continuous and sludge bed biogas processes applied to organic waste. Agricultural Engineering International: CIGR Journal, 19(2): 84–92.
1 Introduction
Biogas reactor development has moved from the earliest designs of the first anaerobic bioreactor in Bombay, India (1859) to conventional bioreactors such as the fixed gas and floating gas bioreactors. There are over 30 million household digesters in China, followed by India with 3.8 million, 0.2 million in Nepal and 60,000 in Bangladesh (Jiang et al., 2011; Thu et al., 2012; Austin and Morris, 2011). The abundance of biogas digesters in the developed countries is also encouraging. In the USA, about 162 farm scale plants were operational by 2010,
Received date: 2016-11-17 Accepted date: 2017-05-17
* Corresponding author:Kevin N. Nwaigwe, Research Fellow,
Department of Mechanical & Industrial Engineering, University of South Africa, Science Campus Florida, 1710, South Africa. Tel: +27627568992, Email: [email protected].
while Canada had as much as 17 plants. In Europe, the number of operational biogas digesters by the end of 2011 was more than 4000 in Germany, 350 in Austria, 72 in Switzerland, 65 in the United Kingdom, with Denmark having about 20 while Sweden has about 12 biogas digesters (Levis et al., 2010; Wilkinson, 2011; Raven and Gregersen, 2007).
hydraulic retention time (HRT) required for digestion has given rise to continuous stirred tank reactors (CSTR), upflow bioreactors, plug flow digesters, anaerobic contact digesters and many others. The overall objective of bioreactor development progression is to maximize biogas production from available substrates within the shortest possible hydraulic retention time. Biogas is a mixture of methane and carbon dioxide with small quantities of other gases such as hydrogen sulphide (McKendry, 2002; Hiremath et al., 2009; National Research Council (US), 1977; Singh, 1973; Singh, 1974; Sathianathan, 1975; Meynell, 1976; Santerre and Smith, 1982).
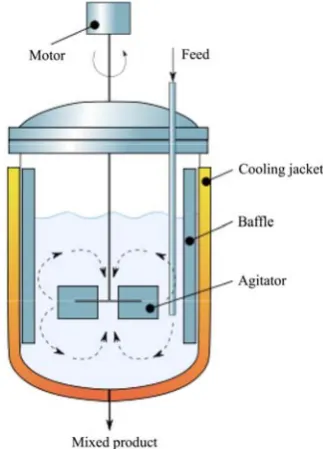
The Continuous Stirred-Tank Reactor (CSTR) (Figure 1) is a common ideal reactor type. A CSTR often refers to a model used to estimate the key unit operation variables when using a continuous agitated-tank reactor to reach a specified output. The mathematical model works for all fluids: liquids, gases, and slurries. The behavior of a CSTR is often approximated or modeled by that of a Continuous Ideally Stirred-Tank Reactor (CISTR). Cibrorowski (2004) reports that agitation in CSTR increases the rate of heat and mass transfer in digesters resulting in a generation of biogas with methane content as high as 76.9%.
Figure 1 Continuous stirred- tank reactor (CSTR)
The Upflow Anaerobic Sludge Blanket (UASB) Reactor (Figure 2) is another type of bioreactor which has a cylindrical configuration. The specific features in the
reactor are a sludge bed zone, sludge blanket zone and a granular zone. It does not require heavy mechanical agitation rather the agitation it experiences is that from produced gas (Cibrorowski, 2004). Unlike fluidized bed reactors there is no need for high rate of effluent recirculation. Its advantage over anaerobic filter and fixed film reactors is seen in the area of the absence of loss of reactor volume through filter material. It does not require a separate settler tank with pump as seen in anaerobic contact digester.
Figure 2 Upflow Anaerobic Sludge Blanket (UASB) Reactor
In order to maximize mixing and fouling within the digestion chamber, Agulana et al. (2012) developed the Upflow Bioreactor with Central Substrate Dispenser (UBCSD) (Figure 3). This is expected to assist in enhancing effluent stabilization, biogas production, and consequently pave way for reduction in maintenance requirement problems.
Figure 3 Upflow bioreactor with central substrate dispenser (UBCSD)
in standard Upflow Reactors and other reactors such as Continuous Stirred Tank Reactors (CSTR), Fluidized Bed Reactors, and Sludge Tank Reactor systems. Its configuration also differs from the others. There are two kinds of flow situations observed in this type of bioreactor; a downward flow of substrate by gravity and a cross-flow of substrate achieved by the central dispensing unit (CSD) (Nwaigwe et al., 2013). Several parameters are of importance in biogas digestion. They include pH of substrate, waste composition/Volatile Solids (VS), Carbon/Nitrogen ratio of substrate (C/N), Total Solids Content (TS)/Organic Loading Rate (OLR), Retention (or Residence) Time (RT) and flow/mixing characteristics. However after digestion, the content of the wastewater from the digester is of importance as it can be a strong pollutant. The end values of the COD and Biochemical Oxygen Demand (BOD) discharged to the environment is of primary importance (Nwaigwe and Enweremadu, 2015). Other parametric assessment of bioreactors for improved efficiency and safer environment include the investigation of the effect of clinoptilolite on the performance of membrane bioreactor (MBR). The results of short term filtration showed that the trend of transmembrane pressure (TMP) increase in terms of flux will be slower in hybrid membrane bioreactor with clinoptilolite (HMBR) leading to improvement of biological wastewater treatment quality and ease of membrane operation (Rezaei and Mehrnia, 2014). In a work towards experimental evidence for osmotic pressure-induced fouling in a membrane bioreactor, a lab-scale membrane bioreactor (MBR) was continuously operated to investigate the membrane fouling (Lin et al., 2014). The chemical potential of water varied along with cake depth. The formed cake layer was found to be much
hydrated and elastic. These findings provided the direct
evidence for the existence of osmotic pressure mechanism. In a work aimed to investigate the efficiency of nutrient removal in a modified membrane bioreactor (MBR) used for treatment of wastewater containing high level of ammonium, Rezaei et al. (2015) compared nutrient removal from synthetic wastewater in the control membrane bioreactor without clinoptilolite (CMBR) and zeolite membrane bioreactor with clinoptilolite (ZMBR).
In ZMBR, about 24% more N-NH4 removal was achieved
owing to combination of nitrification and cation exchange. It was also found that ZMBR application resulted in 10% increase in nutrient removal in comparison with CMBR. In contrast, no significant difference was observed in chemical oxygen demand (COD) removal. Only low amounts of nitrate and phosphate were removed during the first days of experiments. The results demonstrated that clinoptilolite is highly effective in reducing ammonium content of wastewaters.
Chemical Oxygen Demand (COD) is a measurement commonly used to determine substrate quality. Organic material content enjoys the greatest percentage in the overall composition of municipal solid wastes. The organic fraction is 45 to 50% (Kuniholm, 2002). As these substances oxidize or stabilize, they combine with some of the oxygen dissolved in the water. The amount of oxygen used is therefore a good indicator of the amount of waste present. The COD values indicate the amount of oxygen (in milligrams per liter of product) needed to oxidize or stabilize these wastes. Biochemical oxygen demand (BOD) and chemical oxygen demand (COD) are two different ways to measure how much oxygen the wastewater from a digester will consume when it enters the environment. Industries normally focus more on COD and municipalities more on BOD removal. Efforts must be made to reduce these values to protect the environment (Nwaigwe and Enweremadu, 2015).
Ability to reduce COD and BOD values is a key factor in selecting biodigester types for digestion of substrates. COD removal efficiency of most substrates varies between 51-79% (Kuniholm, 2002). Similarly, the combination of a bioreactor and microfiltration system allowed for a high COD reduction of 95% (Castrillon et al., 2002; Holler and Trösch, 2001). In a study of electrochemical treatment of biodigester effluent followed by anaerobic digestion, a COD removal from an initial
value of 1536 mg L-1 to 240 mg L-1 was achieved (Shrutti
number of biological treatment processes are utilized in the treatment of organic wastes (Demirel et al., 2005; Malaspina et al. 1996).
In this present work, a comparative study of COD removal rate using three bioreactor configuration types of Module I, Module II and Module III upflow anaerobic sludge blanket (UASB) reactor, upflow bioreactor with central substrate dispenser (UBCSD), and the continuous stirred tank reactor (CSTR), respectively, will be undertaken. The aim is to classify the different reactor types in terms of efficiency of end effluent discharged into the environment, thereby aiding guided selection for safer environment. In a previous published aspect of this work, investigation of COD removal rate using UBCSD showed an average COD removal rate of up to 95% indicating a very high efficiency for the digester (Nwaigwe and Enweremadu, 2015). In another published aspect of this work, (Nwaigwe et al. 2013), a comparison of the yield potentials of the three bioreactors of UASB, UBCSD and CSTR using organic municipal waste had been reported.
2 Materials and Methods
The experiment was conducted using an integrated assembly of three different bioreactors (Agulanna et al. 2012) being operated at the same time and subjected to the same working conditions for the sole purpose of comparing their performance parameters. These reactors are the upflow anaerobic sludge blanket (UASB) reactor, the upflow bioreactor with central substrate dispenser (UBCSD) and the continuous stirred tank reactor (CSTR). The major components within the integrated assembly include the reservoir tank, feeder tank, central substrate dispenser, twin bioreactors and effluent disposal systems, valves, centrifugal and recirculation pumps, gas collectors, pressure gauges, heating elements and control panel. The tank is positioned at a height considerably higher than the level at which the bioreactors are placed so that the substrate can be inducted into the UASB, the twin bioreactor vessels UBCSD and the CSTR under the influence of gravity; the basic function of the dispensing unit is to generate an up-flow, down-flow and cross-flow of the substrate within the twin bioreactors. During
operation, it receives the substrate material and under pump pressure, causes its recirculation within the twin bioreactors so that adequate mixing of the substrate will continuously be achieved (Nwaigwe et al., 2013).
The internal volume of UASB, UBCSD and CSTR is 76 liters, 64.8 liters and 76 liters respectively, however the same volume of slurry was fed into all the digesters so as to maintain uniform operating volume and condition. Organic Municipal Waste (OMW), used as substrate, was
milled into powdered form to produce a 500 μm mesh
size. A 25 kg quantity of this ground OMW was used to prepare the slurry with 250 liters of distilled water. The substrate was prepared by the insertion of a mixer into the tank containing the mixture of OMW and distilled water. The mixer was operated for about 30 minutes to achieve homogeneity. Basically, to help enhance the microbial activities during the operation of the bioreactor, a measured quantity (2 kg) of some substances from the rumen of the digestive system of a freshly slaughtered cow was mixed with 5 liters of distilled water and after
undergoing filtration through 100μm sieve, was
introduced into the prepared substrate. The resulting mixture of the slurry and the substance from cattle rumen was then pumped into the feeder tank from the reservoir tank by the aid of the feed pump and received by the bioreactors. The reactors were allowed to run without interruption for a period of 10 days at a pre-determined mesophilic temperature of 370°C and a recording of the biogas production was made every six hours. While the gas was collected at the collector tank, the effluent from each reactor was collected through the dispenser and analyzed for COD removal. This process was repeated severally and average values recorded.
3 Results and Discussion
3.1 Results
CSTR in terms of COD reduction. Module I refer to UASB, module II refers to UBCSD while module III refers to CSTR.
Table 1 Comparative COD removal in the bioreactors
Time, days
COD Reduction in
UASB, mg L-1 COD Reduction in UBCSD, mg L-1 COD Reduction in CSTR, mg L-1
0 120,320 120,320 120,320 1 117,552 114,641 118,154 2 111,301.70 107,158 114,691.40 3 108,012.30 89,321.70 103,777 4 89,321.70 69,563.80 98,715.80
5 80,821 54,176 80,822
6 73,130.40 42,192.60 66,171.20 7 49,020.80 32,859.60 49,020.80 8 36,315.50 18,033.70 40,134.80 9 24,343 14,044.70 23,155.80 10 24,343 5,775.40 23,155.80
Figure 4 Plot of COD versus HRT (days) for module I
Figure 5 Plot of COD versus HRT (days) for module II
Figure 6 Plot of COD versus HRT (days) for module III
Similarly, Figures 7-9 show the trend of percentage COD reduction during the 10-day HRT.
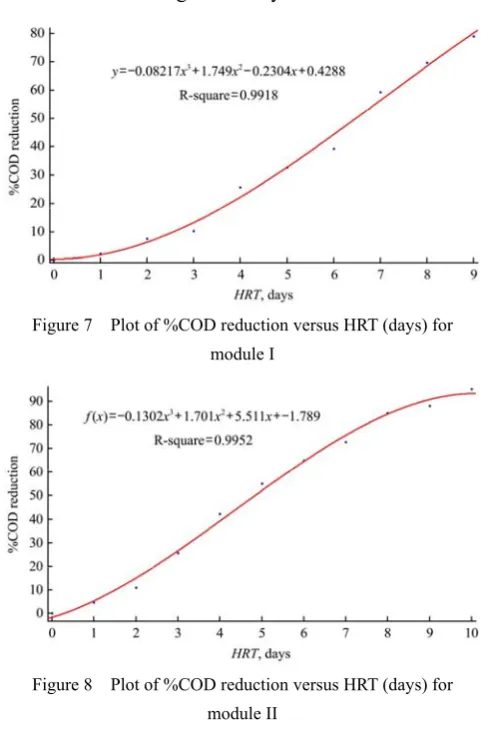
Figure 7 Plot of %COD reduction versus HRT (days) for module I
Figure 8 Plot of %COD reduction versus HRT (days) for module II
Figure 9 Plot of %COD reduction versus HRT (days) for module III
The percentage COD removed (%COD) is given by
Equation (1):
% COD = (COD(0)–COD(t))/COD(0) (1)
where, COD(0) is the initial COD or the COD at t=0, its
numerical value is = 120320 mg L-1; while
COD(t) = the
COD at any time t.
Carrying out a MATLAB plot of InCOD versus HRT
equations generated, closely conform to the model developed by Ghosh and Liu (1997) based on Fenton’s reaction in first order kinetics shown in Equation (2):
InCOD(t) = –kt +InCOD(0) (2)
where, k is a first order kinetic constant.
Figure 10 Plot of InCOD versus HRT (days) for module I
Figure 11 Plot of InCOD versus HRT (days) for module II
Figure 12 Plot of InCOD versus HRT (days) for module III
These MATLAB plots were achieved with the R-square values of 0.9005, 0.9178 and 0.8740 for modules I, II and III, respectively.
The MATLAB plot of InCOD versus HRT (days) for
module I (Figure 10) gives Equation (3):
y =–0.147x+12.094 (3)
where, y =InCOD(t), x = t and R-square value = 0.9005.
Hence, substituting for y and x in (3), we have:
InCOD(t)=–0.147t+12.094 (4)
Therefore, comparing (2) and (4), we have that:
InCOD(0)=12.094 and k=0.147 (5)
The MATLAB plot of InCOD versus HRT (days) for
module II (Figure 11) gives the following equation:
f(x)=–0.2857x+12.1 (6)
where, f(x)=InCOD(t), x=t and R-square value=0.9178.
Hence, substituting for f(x) and x, we have:
InCOD(t)=–0.2857t+12.1 (7)
Comparing (2) and (7), we have that:
InCOD(0)=12.1 and k=0.2857 (8)
The MATLAB plot of InCOD versus HRT (days) for
module III (Figure 12) gives the following equation:
f(x)=–0.1708x+11.96 (9)
where, f(x)=InCOD(t), x=t and R-square value=0.8740.
Hence, substituting for f(x) and x, we have:
InCOD(t)=–0.1708t+11.96 (10)
Comparing (2) and (10), we have that:
InCOD(0)=11.96 and k=0.1708 (11)
However, comparing the graphical values of InCOD(0)
which are 12.094, 12.1 and 11.96 for modules I, II and III, it is seen that there is a close resemblance between them and the natural logarithm of the experimental value of the initial COD. Recall that the experimental initial COD value is given as:
COD(0)Exp=120320 mg L-1
Applying the natural logarithm of the experimental
COD [COD(0)Exp], we have:
InCOD(0)Exp= In120320 = 11.698 (12)
This close resemblance between the experimental and graphical values of initial COD validates the model as given by Equation (2).
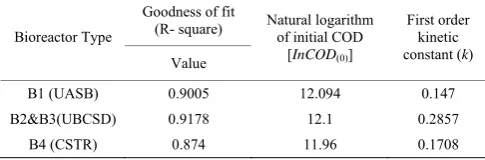
Table 2 Kinetic parameters in InCOD plot versus HRT (days)
Goodness of fit (R- square) Bioreactor Type
Value
Natural logarithm of initial COD
[InCOD(0)]
First order kinetic constant (k)
B1 (UASB) 0.9005 12.094 0.147
B2&B3(UBCSD) 0.9178 12.1 0.2857 B4 (CSTR) 0.874 11.96 0.1708
From the above results, each reactor module showed a progressively reduced COD content with respect to time in days (Figures 4-6). The COD reduced from its initial
value of 120,320 mgL-1 to 24,343 mg L-1 for module I; to
module III at the HRT of 10 days. It is important to note that the difference in reactor volumes has no effect in these results as the reacting volume is the same in all the reactors. It is noted that module II achieved its best value
on the 10th day as against the 9th day for modules I and III.
This implies that with enhanced mixing of substrates, biogas yield is sustained longer. As long as yield is sustained, COD removal is improved. From Figures. 7-9, the percentage COD (%COD) reduction increased with
HRT (days) until the ninth (9th) day when it assumed its
maximum of 79% and 80.8% for modules I and III respectively, while the improvement continued for module II until the tenth (10th) day when it assumed its maximum of 95.2%. These graphs were plotted with R-square values of 0.9918, 0.9952 and 0.9946 for modules I, II and III, respectively. This trend is expected as all bioreactors ultimately reduce the COD level between the feeding of the reactor, digestion and discharge of effluent. The extra improvement for module II is attributable to the extra action of mixing of the substrates within the digestion chamber. This action improves both biogas yield and COD removal.
Module II, the UBCSD, has the highest level of percentage COD removal of 95.2%, followed by module III, the CSTR, with the value of 80.8%; while module I, the UASB, offered the lowest level of percentage COD removal of 79.0% (Figures 7-9). Given these values, module II (UBCSD) proved to be the most efficient reactor amongst the three in terms of substrate stabilization capacity. Interestingly, the %COD reduction achieved in the UBCSD is in close proximity to published reports (Castrillon et al., 2002; Holler et al., 2001) that the combination of a bioreactor and microfiltration allowed a high COD reduction of 95%.
3.2 Discussion
A high COD level of any organic waste depicts its toxicity and can be used as an index to state whether it is a pollutant or not. A given number of biological treatment processes are utilized in the treatment of organic wastes (Demirel et al., 2005; Malaspina et al., 1996). The initial high COD value of the slurry is an indication of its potential to be inimical to the environment if disposed directly into the environment without treatment. This is
the case with many organic wastes. Part of the advantage in converting these wastes into useful energy is the resultant reduction in their toxicity as the microbes within the bioreactor help in reducing their toxicity as they go into reactions.
The three reactors showed very high and efficient reduction of COD as a result of the anaerobic digestion within their chambers. The more the mixing action within the digester, the better the COD removal as well as biogas yield (Nwaigwe et al., 2013). The results from this experimentation show clearly that there is improved digestion with improved mixing and fouling.
If effluent with high COD levels is discharged into a stream or river, it will accelerate bacterial growth in the river and consume the oxygen levels in the river. The oxygen may diminish to levels that are lethal for most fish and many aquatic insects. As the river re-aerates due to atmospheric mixing and as algal photosynthesis adds oxygen to the water, the oxygen levels will slowly increase downstream. Similarly, effluent with high COD is inimical to plant growth. Given this knowledge, effluents discharged from these bioreactors can be safely
discharged as initial COD values of 120,320 mg L-1
contained in the substrate was reduced to 24,343 mg L-1,
5,775.4 mg L-1 and 23,155.8 mg L-1 for UASB, UBCSD
and CSTR respectively. Percentage reduction using these bioreactors is very high with the UBCSD offering the most efficient removal rate.
Since organic wastes have proven to be good as fertilizers, (The Moorhead Group, 2017), using these wastes at reduced COD levels is most desirable. The lower the COD levels, the better. Hence, wastes utilized as substrates in a bioreactor with attendant reduced COD of the effluent can be safely used as organic fertilizer.
The values for the first order kinetic constant (k) of
COD for Modules I, II and III are 0.147, 0.2857 and
0.1708, respectively. k is an important parameter which is
used as a measure of the rate at which the substrate COD is reduced and is found to be highest in module II (UBCSD) followed by module III (CSTR), and the least value was achieved in module I (UASB). A careful
consideration, however, of the k values obtained in
shows that substrate stabilization improves as k increases.
Besides, since the effluent in the UBCSD was found to be more stabilized than was achieved in the UASB and CSTR, its sludge has the tendency of posing the least environmental threat. Therefore, it exhibits the capacity to generate effluent that can serve as better fertilizer than the other reactors. However, all bioreactors have the capacity to treat the substrate introduced into it into a better effluent capable of serving as organic fertilizer.
4 Conclusion
The advances of anaerobic digestion (AD) technology have been supported by legislation. Most European countries are aiming to limit MSW disposal to landfills to no more than 5% of the collected material and have increased taxes on landfilling. This will ensure that waste is properly treated for combustibles and organics rather than being buried in the ground. The use of bioreactors with improved mixing and fouling is one way of achieving this. The 15% renewable energy utilization target as well as schemes such as "green pricing" in The Netherlands and some other European countries allow AD facilities to sell biogas for electricity generation at a premium. Similarly, in the United Kingdom, under the Non- Fossil Fuel Obligation (NFFO) act, electricity is sold at a premium from AD system. Another factor that has triggered opting for energy recovery from waste is international agreements with respect to greenhouse gas emissions.
The use of the Central Substrate Dispenser (CSD) in bioreactor technology for a double vessel upflow configuration has in a very remarkable way proved to be highly effective for the improvement of the dynamics of the working substrate. Consequently, the enhancement of the substrate flow has paved way for the achievement of considerably high level of biogas production and waste stabilization. However, the secret behind the success of this new technology, is that the CSD assists immensely in the maintenance of substrate homogeneity; prevention of temperature gradient and fouling of the digestion process. These are problems that are usually associated with bioreactors, and if not properly handled, can cause poor biogas performance.
However, considering the importance of the treatment of MSW using anaerobic digestion (AD) technology; and having tested and proven the high efficiency and capacity of the UBCSD to help achieve this goal, it is important to ensure that the operating parameters of the digester such as temperature, speed of agitation, pH, organic loading rate (OLR), must be optimized and controlled so as to enhance the microbial activity and thus increase the anaerobic degradation efficiency of the system. For a commercial scale consideration of the UBCSD, it is advisable to employ the use of multiple vessels connected in series or parallel with a common feeder tank, than to engage in the enlargement of a single vessel that may be exposed to the danger of exhibiting serious flow problems which may require the design of complicated parts in order to meet up with the substrate flow requirements.
References
Abubakar, B. S. U. I., and N. Ismail. 2012. Anaerobic digestion of cow dung for biogas production. ARPN Journal of Engineering and Applied Sciences, 7(2): 169–172.
Agulanna, C. N., G. N. Onuoha, E. E. Anyanwu, E. N. Ejike, and N. V. Ogueke. 2012. Experimental studies of anaerobic digestion of organic fraction of municipal solid waste using a bioreactor with integral flow features. Journal of Emerging Trends in Engineering and Applied Sciences, 3(3): 461–469.
Amigun, B., and H. V. Blottnitz. 2009. Capital cost prediction for biogas installations in Africa: Lang factor approach. Environmental progress and sustainable energy, 28(1): 134–142.
Amigun, B., R. Sigamoney, and H. V. Blottnitz. 2008. Commercialisation of biofuel industry in Africa: a review. Renewable and Sustainable Energy Reviews, 12(3): 690–711. Austin, G., and G. Morris. 2011. Bioenergy for sustainable
development in Africa, eds. R. Janssen, and D. Rutz. Part II, 103–115. Germany: Springer Science and Business Media. Castrillon, L., I. Vázquez, E. Maranon, and H. Sastre. 2002.
Anaerobic thermophilic treatment of cattle manure in UASB reactors. Waste management and research, 20(4): 350–356. Cibrorowski, P. 2004. Anaerobic digestion in the dairy industry. In
Minnesota Pollution Control Agency, Air Innovation Conference. Available at www.epa.gove. Accessed 15 July 2014.
Demirel, B., O. Yenigun, and T. T. Onay. 2005. Anaerobic treatment of dairy wastewaters: a review. Process Biochemistry, 40(8): 2583–2595.
and COD removal of distillery spent wash by electrocoagulation followed by photocatalytic method. International Journal of Advance Research in Engineering, Science & Technology, 3(8): 30–33.
Hiremath, R. B., B. Kumar, P. Balachandra, N. H. Ravindranath, and B. N. Raghunandan. 2009. Decentralised renewable energy: Scope, relevance and applications in the Indian context. Energy for Sustainable Development, 13(1): 4–10. Holler, S., and W. Trösch. 2001. Treatment of urban wastewater in
a membrane bioreactor at high organic loading rates. Journal of Biotechnology, 92(2): 95–101.
Jiang, X., S. G. Sommer, and K. V. Christensen. 2011. A review of the biogas industry in China. Energy Policy, 39(10): 6073–6081.
Kuniholm, P. F. 2002. Basic Landfill Bioreactor Kinetic Model. In Proc. WASTECON SWANA 40th
Solid Waste Association of
North America Annual International Solid Waste Exposition, 269–274. Long Beach, CA, USA.
Levis, J. W., M. A. Barlaz, N. J. Themelis, P. Ulloa. 2010. Assessment of the state of food waste treatment in the United States and Canada. Waste Management, 30: 1486–1494. Lin, H., M. Zhang, F. Wang, Y. He, J. Chen, H. Hong, A. Wang,
and H. Yu. 2014. Experimental evidence for osmotic pressure-induced fouling in a membrane bioreactor. Bioresource Technology, 158: 119–126.
Liu, T., and S. Ghosh. 1997. Phase separation during anaerobic fermentation of solid substrates in an innovative plugflow reactor. Water Science and Technology, 36(6-7): 303–310. Malaspina, F., C. M. Cellamare, L. Stante, and A. Tilche. 1996.
Anaerobic treatment of cheese whey with a downflow-upflow hybrid reactor. Bioresource Technology, 55(2): 131–139. McKendry, P. 2002. Energy production from biomass (part 2):
conversion technologies. Bioresource Technology, 83(1): 47–54.
Meynell, P. J. 1976. Methane: Planning A Digester. Detriot: Prism publishers.
National Research Council (US). 1977. Methane Generation from Human, Animal, and Agricultural Wastes. Washington, D. C.: National Academy of Sciences.
Nwaigwe, K. N. and C. C. Enweremadu. 2015 Analysis of chemical oxygen demand (COD) removal rate using upflow bioreactor with central substrate dispenser (UBCSD). In Proc. 4th International Conference on Advances in Engineering Sciences and Applied Mathematics, 67–70. Malaysia. December 9, 2015.
Nwaigwe, K. N., N. V. Ogueke, C. Ononogbo, and E. E. Anyanwu.
2013. Performance study of anaerobic digestion of organic municipal waste in upflow bioreactor with central substrate dispenser. International Mechanical Engineering Congress and Exposition, paper No: V06AT07A008-V06AT07A008. San Diego: American Society of Mechanical Engineers. Omer, A. M., and Y. Fadalla. 2003. Biogas energy technology in
Sudan. Renewable Energy, 28(3): 499–507.
Parawira, W. 2009. Biogas technology in sub-Saharan Africa: status, prospects and constraints. Reviews in Environmental Science and Biotechnology, 8(2): 187–200.
Raven, R. P. J. M., K. H. Gregersen. 2007. Biogas plants in Denmark: successes and setbacks. Renewable and Sustainable Energy Reviews, 11(1): 116–132.
Rezaei, M., and M. R. Mehrnia. 2014. The influence of zeolite (clinoptilolite) on the performance of a hybrid membrane bioreactor. Bioresource Technology, 158: 25–31.
Rezaei, M., M. R. Mehrnia, M. H. Sarrafzadeh, and M. A. Aroon. 2015. Effect of clinoptilolite addition on nutrient removal in a membrane bioreactor. Desalination and Water Treatment, 54(11): 2920–2927.
Santerre, M. T., and K. R. Smith. 1982. Measures of appropriateness: the resource requirements of anaerobic digestion (biogas) systems. World Development, 10(3): 239–261.
Sathianathan, M. A. 1975. Bio-Gas: Achievements and Challenges. Association of Voluntary Agencies for Rural Development. India: Sagar Printers and Publishers.
Shruthi, M., B. M. Krishna, K. S. Lokesh, and U. N. Murthy. 2013. Electrochemical treatment of biodigester effluent (BDE) followed by anaerobic digestion. International Journal of ChemTech Research, 5(3): 1376–1378.
Singh, R. B. 1973. Bio-gas Plant: Designs with Specifications. India: Gobar Gas Research Station.
Singh, R. B. 1974. Bio-gas Plant: Generating Methane from Organic Wastes. India: Gobar Gas Research Station.
The Moorhead Group. 2017. Thermophilic digestion plant. Available at: http://www.moorheadgroup.com. Accessed 16 January 2017.
Thu, C. T. T., P. H. Cuong, N. V. Chao, N. X. Trach, and S. G. Sommer. 2012. Manure management practices on biogas and non-biogas pig farms in developing countries–using livestock farms in Vietnam as an example. Journal of Cleaner Production, 27: 64–71.