Food choices: concordance in Australian
children aged 11–12 years and
their parents
Prudence Vivarini,1 Jessica A Kerr, 1,2 Susan A Clifford, 1,2 Anneke C Grobler, 1,2 Pauline W Jansen, 1,3,4 Fiona K Mensah, 1,2 Louise A Baur, 5 Kay Gibbons, 1,6 Melissa Wake 1,2,7
To cite: Vivarini P, Kerr JA, Clifford SA, et al. Food choices: concordance in Australian children aged 11–12 years and their parents. BMJ Open 2019;9:147–156. doi:10.1136/ bmjopen-2017-020898
►Prepublication history and additional material for this paper are available online. To view these files, please visit the journal online (http:// dx. doi. org/ 10. 1136/ bmjopen- 2017- 020898).
Received 30 November 2017 Revised 5 October 2018 Accepted 4 April 2019
For numbered affiliations see end of article.
Correspondence to Professor Melissa Wake; melissa. wake@ mcri. edu. au © Author(s) (or their employer(s)) 2019. Re-use permitted under CC BY-NC. No commercial re-use. See rights and permissions. Published by BMJ.
ABSTRACT
Objectives Snack foods—typically high in salt, sugar, fat and/or energy—are likely important to the obesity epidemic. In the context of a population-based health assessment involving parent–child dyads at child age 11–12 years, we report cross-generational concordance in intake at a controlled snack food observation.
Design Cross-sectional study (Child Health CheckPoint), nested within the Longitudinal Study of Australian Children.
Setting Assessment centres in seven Australian cities, February 2015–March 2016.
Participants Of all participating CheckPoint families (n=1874), 1299 children (50.3% girls) and 1274 parents (85.9% mothers) with snack data were included. Survey weights and methods were applied to account for the clustered multistage sample design.
Outcome measures Partway through the 3.5-hour assessment, parents and children attended Food Stop
separately for a timed 15 min ‘snack break’. One of four standardised box size/content combinations was randomly provided to all participants on any given day. Total food mass, energy, nutrients and sodium consumed was measured to the nearest 1 g. Pearson’s correlation coefficients and adjusted multivariable linear regression models assessed parent–child concordance in each variable.
Results Children consumed less grams (151 g [SD 80] vs 165 g [SD 79]) but more energy (1393 kJ [SD 537] vs 1290 kJ [SD 658]) than parents. Parent–child concordance coefficients were small, ranging from 0.07 for sodium intake to 0.17 for carbohydrate intake. Compared with children with parents’ energy intake on the 10th centile, children whose parents were on the 90th centile ate on average 227 kJ more. If extrapolated to one similar unsupervised snack on a daily basis, this equates to an additional 83 050 kJ per year, which could have a cumulative impact on additional body fat.
Conclusions Although modest at an individual level, this measured parent-child concordance in unsupervised daily snack situations could account for substantial annual population differences in energy, fat and sodium intake for children aged 11–12 years.
Trial registration number ISRCTN12538380.
INTRODUCTION
Prepackaged snack foods are among the leading causes of modern dietary imbalances1
and contribute to high rates of obesity.2 Snack
foods are readily available and highly palat-able, and children (and adults) may not readily understand their nutritional value or lack thereof.3 Generally, these foods are high
in sugar, fat and energy, contain few micronu-trients and may be substituted for healthier foods in one’s diet.4 5 Australia, similar to
many countries such as the USA, Sweden and the Netherlands, recommends that children and adults consume a maximum of 14%–17% of their daily energy intake from these ‘extra’ foods.6 7 Unfortunately, people typically get
around 30% of their energy intake from snack foods.8–12
Given that childhood diet patterns tend to persist into adolescence and adulthood,13 14 it
is important to understand the mechanisms underlying children’s food choices in order to reduce diet-related morbidity and mortality. Children may be both positively and nega-tively influenced by their parent’s eating behaviour through a number of mecha-nisms.15 16 Parents select the food that is
avail-able to their children within the home. They may also model eating behaviour that chil-dren learn to imitate or may influence their
Strengths and limitations of this study
► This study uses an objective measure to assess food intake, rather than self-reporting methodology used in previous parent–child concordance studies.
► This is the largest study, to the best of our knowl-edge, to assess food intake using an objective mea-sure at the population level.
► By separating children from their parents while they are eating, we are able to assess children’s indepen-dent snack food choices free of immediate parental influence.
► Participants chose from a limited diversity of snacks, so choices may not reflect true snack preferences when choosing from a wider range of sources.
on September 22, 2020 by guest. Protected by copyright.
children’s intake through varying general parenting and/ or specific eating practices (eg, authoritative parenting, indulgent feeding and pressure to eat).17–19 All these
vari-ables, along with any genetic influences, may shape chil-dren’s eating behaviour, such that eating patterns become ingrained and present even when eating occurs away from the parent and/or family environment. That is, as chil-dren gain autonomy, their food intake, and in particular snack intake, more regularly occurs away from their home environment and away from parental presence.20 Such
independent food choices may contribute to children’s future weight and health trajectory, particularly given that children are more likely to select palatable, high-en-ergy snack foods when away from parents.21 22 Strong
concordance might indicate that snack intake could be mainly targeted via family interventions. However, low concordance would support interventions that also target the child as an autonomous individual and/or their non-home environments.
Previous population studies have reported small-to-moderate parent–child concordance of dietary choices.23–29 Though the majority of these studies focus
on preschool or school aged children (3–14 years),25–28
one focused on adult offspring (18–23 years)29 and two
included very broad age ranges (1–30 years),23 24 but
created tighter age groups for analyses. Overall, concor-dance estimates appear to be stronger at the nutrient level than at the food group level.23–29 One of these
studies indicated that, as the age of children increases, parent–child dietary concordance decreases.23 Although
this result may reflect children’s increasing autonomy and a reduction in parental influence as they age, it was only obtained for the measure of overall diet quality and not for nutrient-level analyses.23
In a systematic review of 15 studies, Wang et al reported mean correlation coefficients between parents’ and chil-dren’s dietary intake of 0.17 for energy intake and 0.19 for fat intake.30 However, these studies predominantly
used self-report measures such as 24-hour recalls or food diaries, known to yield imprecise and even physiologically implausible food intake estimates31 32 due to recall
diffi-culty, subjectivity and under-reporting.33–37 Furthermore,
such studies have predominantly assessed overall dietary intakes rather than focusing specifically on snack choice.
Precision in understanding parent–child similarities in snack choices most likely requires objective tools that can accurately measure the quantity, energy and macronu-trients consumed. Because of the challenges associated with measuring snacking in large free-living populations, objective measures have so far only been used in relatively small homogenous samples of adults and children.38–43
None has looked at the association between children’s choices and those of their parents, and most have assessed behaviours around eating, such as parenting techniques and self-served portion size.
The Child Health CheckPoint, nested within Growing Up in Australia (also known as the Longitudinal Study of Australian Children [LSAC]), offers a unique opportu-nity to study parent–child concordance of food choice objectively in the context of a population-based sample undergoing a health assessment. Partway through the CheckPoint was the 15 min Food Stop, visited by each parent and child separately, offering free choice from a standardised box of preweighed snack food items. In this quasinatural ‘rest-stop’ setting, we aimed to determine the correlations between child and parent consumption of total snack food mass, energy, macronutrients and sodium.
METHODS
Study design and participants
Details of the initial study design and recruitment are outlined elsewhere.44 45 Briefly, LSAC recruited a
nation-ally representative cohort of 5107 infants46 (B cohort)
using a two-stage sampling design with postcode as primary sampling unit and followed families up in bien-nial data collection waves up to 2015. The initial recruit-ment rate in 2004 was 57.2%, of whom 73.7% (n=3764) were retained to LSAC wave 6 in 2014. A more detailed description of the CheckPoint study design is available elsewhere.46 47
B cohort participants in the wave 6 visit were invited to share their contact details with the CheckPoint team. In late 2014 and 2015, families that consented were then sent an information pack via post and received
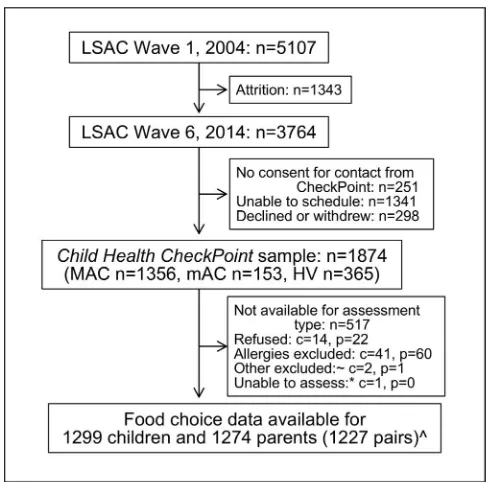
Figure 1 Participant flow from recruitment into LSAC to participation in Food Stop. ~Participants excluded due to unreliable data. *Unable to access due to missing all items. ^Data from 10 non-biological child-parent data pairs excluded from concordance analyses. c, number of children; HV, home visit assessment; LSAC, Longitudnal study of Australian children; MAC, Main assessment center; mAc, mini assessment center; n, number of families; p, number of attending adults.
on September 22, 2020 by guest. Protected by copyright.
an information and recruitment phone call. The Child Health CheckPoint—LSAC’s detailed cross-sectional biophysical assessment—was nested between LSAC waves 6 and 7 (child age 11–12 years) and took place between February 2015 and March 2016 (see detailed descrip-tion of CheckPoint methods47). Ultimately, 1874 families
participated (figure 1). The CheckPoint offered a special-ised 3.5-hour visit to a Main Assessment Centre in seven capital cities/larger regional towns, a 2.5-hour visit to a Mini Assessment Centre in eight smaller regional centres and 1.5-hour home visits to a further 365 families who could not attend any centre (figure 1). Food Stop was only included at the Main Assessment Centres.
Consent
The attending parents/caregivers provided written informed consent for themselves and their children to participate in the study.
Food Stop procedure
Food Stop was a 15 min station offered roughly midway through the 3.5-hour preset circuit at the CheckPoint’s Main Assessment Centre visits. CheckPoint sessions were held between 08:30 and 18:45, with children arriving at Food Stop between 11:15 and 18:00 and parents between 10:30 to 17:15.
Food Stop was designed as a randomised controlled trial (ISRCTN12538380) of four box combinations to assess the effects of snack box size and the number of snack items on food intake in children and parents. Each study day was randomly assigned to one of the four box combi-nations: a small box containing 15%–20% of a child or adult’s recommended daily intake (RDI) of energy (box combination 1), a large box containing 15%–20% of RDI of energy (box combination 2), a small box containing 25%–30% of RDI of energy (box combination 3) or a large box containing 25%–30% of RDI of energy (box nation 4). Thus, each dyad received the same box combi-nation, but (because based on RDI of energy) parents received more energy per box within that combination than did the child (online supplementary table 1 details size and contents of each box combination). Participants with food allergies were offered a specific allergy box and excluded from this analysis.
Prior to CheckPoint attendance, parents were mailed an information booklet that briefly described each station, including Food Stop and its intent to measure food intake. Because each child and parent participated in the CheckPoint circuit separately, parents arrived at Food Stop approximately 2 hours and children approximately 3 hours from arrival. Both children and parents had vene-section performed in a preceding station, Young Bloods (5 min prior to Food Stop for children, 30 min prior to Food Stop for parents), during which they were asked to give a hunger rating from 1 to 7 (1=not, 7=very).
On entering the Food Stop area, a research assistant provided the participant with a prepacked snack box. Each box was discreetly labelled with the participants’
identification number so that leftover foods could be recorded. The research assistant informed participants that: (A) they had a 15 min break before their next Check-Point assessment, (B) this was an opportunity to eat any of the foods provided in the snack box, to relax and/or to finish their CheckPoint questionnaire, (C) not to take any of the food items away from the area and (D) to leave all rubbish and half-eaten food in the snack box when they left Food Stop. Most individuals participated in Food Stop by themselves. During busy school holiday periods, an unrelated child and parent were frequently in Food Stop at the same time but seated separately and very occa-sionally three or four participants attended Food Stop at the same time. After 15 min, a researcher escorted the participant to their next station. The Food Stop researcher stored the snack box with any packaging or uneaten food still inside.
Food Stop measures
An independent researcher later inspected each partic-ipant’s snack box for completely eaten, partially eaten or unopened food items and recorded this information using REDCap (Research Electronic Data Capture), an electronic database. The nutritional characteristics of the food items were determined from food packaging (online supplementary table 1). Partially eaten food items were weighed using calibrated weight scales (BSK500BSS) accurate to the nearest 1 g. To determine the energy and nutrients consumed from partially eaten food items, the percentage eaten (determined by weight) was multiplied by the total energy or nutrients indicated on the food packaging.
Additional sample characteristics
Relative socioeconomic position was calculated using Socio-Economic Indexes for Areas scores, determined from the postcode of the participant’s primary address and compiled from data collected in the 2011 Austra-lian census. Specifically, we selected the Index of Rela-tive Socioeconomic Disadvantage (Disadvantage Index), which describes relative social and economic disadvan-tage of Australian suburbs.48 Higher scores indicate less
disadvantage, with a national mean of 1000 and SD of 100. Height, to the nearest 0.1 cm, was measured using a portable rigid stadiometer (Invicta IP0955, Leicester, UK), without shoes or socks, in light clothing and in duplicate. A third measurement was taken if the differ-ence of the first two measurements exceeded 0.5 cm; final height was the mean of all measurements made. Weight, to the nearest 0.1 kg, was measured with an InBody230 bioelectrical impedance analysis scale (Biospace Co Ltd, Seoul, South Korea). Body mass index (BMI) was calcu-lated as weight (kg) divided by height (m) squared. For children, an age-adjusted and sex-adjusted BMI z-score was calculated using the US CDC growth reference charts.49 These measures have been described in further detail elsewhere.47
on September 22, 2020 by guest. Protected by copyright.
Statistical analysis
Concordance between parents and children was assessed by: (1) Pearson’s correlation coefficients with 95% CIs and (2) linear regressions with the child variable as dependent variable and the parent variable as indepen-dent variable adjusted for parent and child age and BMI, Disadvantage Index and box combination. In models including both sexes, regression analyses were further adjusted for parent and child sex.
Summary statistics and proportions were estimated by applying survey weights and survey procedures that took clustering in the sampling frame into account using Stata V.14.2 survey procedures.50 Survey weights were
calculated taking into account the selection probability of each child and were adjusted for non-response, loss to follow-up and benchmarked to population numbers in major (poststratification) categories of the population of children born in 2004. More detail on the calculation of weights is provided elsewhere.51
Patient and public involvement
Because LSAC is a population-based longitudinal study, no patient groups were involved in its design or conduct. To our knowledge, the public was not involved in the study design, recruitment or conduct of the LSAC study or its CheckPoint module. Parents received a summary health report for their child and themselves at or soon after the assessment visit. They consented to take part knowing that they would not otherwise receive individual results about themselves or their child.
RESULTS Sample
Figure 1 shows the participant retention through LSAC to the Child Health CheckPoint and participation in Food Stop. Of 1356 families who attended a main assessment centre, 1299 children and 1274 parents attended the Food Stop and had valid data recorded. Table 1 summarises the participant characteristics. As expected, the mean age of children was 12 years old, and parents were in midlife (mean 43.9 years±SD 5.6).
While the sex distribution in children was even, fathers made up only 14.1% of the parent population. The mean BMI z-score of children in the sample was 0.37 SD above the population reference values. Similarly, mean parental BMI was in the overweight category, consistent with national data showing that most Australian adults are overweight or obese.52 Mean duration at Food Stop
for both children and parents was slightly less than the assigned 15 min for children (12.4 min±SD 3.8) and parents (12.0 min±SD 4.4).
Food, energy and nutrient intake
Table 2 shows means, SD and CIs for all food intake vari-ables in the sample of children and parents. In all food intake variables, the distribution ranged from 0.0 g (for participants who ate no food items from their assigned
snack box) to the maximum available (for those who ate all food items). Despite energy intake being higher in children (1393 kJ) than in parents (1290 kJ), the mean total food mass intake was lower in children (151 g) than in parents (165 g), reflecting children’s choices of lighter but more energy dense food items.
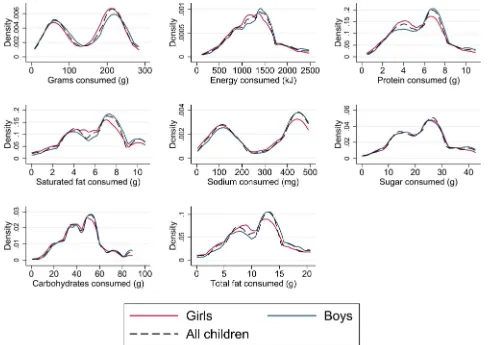
Figures 2 and 3 represent the distribution of total food, energy and nutrient intake in children and parents, stratified by sex. Similar distributions were seen for boys and girls and for mothers and fathers. Energy intake was approximately normally distributed in the sample popu-lation of children and parents, but intake of grams and specific nutrients showed bimodal distributions that are attributable to specific food items. For example, the peaches contributed a relatively large proportion (150 g) to the total weight of the box (online supplementary table 1): those who ate the peaches were always in the higher peak, and those who did not were always in the lower peak, of the distribution regardless of what other foods were consumed. Similarly, the cheese contributed a relatively large proportion of the total sodium and saturated fat (online supplementary table 1), leading to bimodal distributions of these variables according to whether participants did or did not consume the cheese. Protein, sugar, carbohydrates and total fat intake were
Table 1 Participant characteristics
Characteristic
Children (n=1259– 1299)
Parents (n=1231– 1274)
Age (years) 12.0 (0.4) 43.9 (5.6) Height (cm) 153.2 (7.9) 166.2 (8.0)
BMI (kg/m2) – 28.2 (6.4)
BMI z-score 0.37 (1.00) – Disadvantage Index 1012 (60) 1012 (61) Time since last
eaten (hours)
4.6 (2.2) 4.0 (2.5)
Hunger rating
(1=not, 7=very) 4.2 (1.4) 2.8 (1.5) Time at Food Stop
(min) 12.4 (3.8) 12.0 (4.4)
Male sex, % 49.7 14.1
Box combination, %
1* 26.6 (n=348) 26.5 (n=338) 2† 21.9 (n=279) 22.5 (n=278) 3‡ 25.4 (n=322) 24.8 (n=309) 4§ 26.1 (n=350) 26.2 (n=349)
Values are mean (SD) except where specified as %. *Box combination 1: small box containing 15%–20% of RDI. †Box combination 2: large box containing 15%–20% of RDI. ‡Box combination 3: small box containing 25%–30% of RDI. §Box combination 4: large box containing 25%–30% of RDI. BMI, body mass index; Disadvantage Index, the Index of Relative Socioeconomic Disadvantage; n, number; RDI, recommended daily intake.
on September 22, 2020 by guest. Protected by copyright.
more evenly distributed across food items and thus did not show such obvious bimodal distributions.
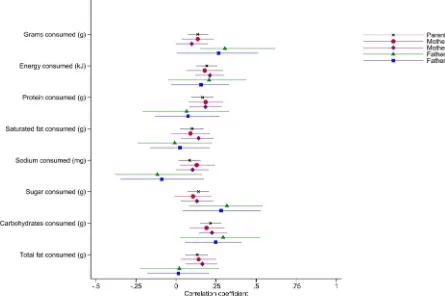
Parent–child concordance
Figure 4 shows Pearson’s correlation coefficients strat-ified by parent and child sex, with horizontal lines indicating the 95% CI; online supplementary table 2 provides the underlying estimates for reference. The graphical presentation highlights the similar size of effect for all variables. Father–child (both father–son
and father–daughter) estimates showed wider CIs than the estimates for mothers, reflecting the small numbers of fathers in the sample.
Table 3 shows unadjusted Pearson’s correlation coef-ficients and adjusted linear regression coefcoef-ficients for the 1227 parent–child dyads. Every intake variable showed a significant, positive correlation between child–parent dyads. All were modest, ranging from 0.08 (95% CI 0.01 to 0.15) for sodium intake to 0.22 (95%
Table 2 Summary of food intake variables in children and parents
Consumption
Children (n=1299) Parents (n=1274)
Mean SD 95% CI Mean SD 95% CI
Grams (g) 151 80 145 to 157 165 79 159 to 170
Energy (kJ) 1393* 537 1353 to 1432 1290 658 1245 to 1336
Protein (g) 6.0 2.5 5.8 to 6.2 5.6 2.9 5.4 to 5.8
Saturated fat (g) 6.3 2.8 6.2 to 6.5 5.0 3.3 4.7 to 5.2
Sodium (mg) 309 171 297 to 321 305 192 292 to 318
Sugar (g) 24.0 10.3 23.2 to 24.7 21.2 11.6 20.4 to 22.0
Carbohydrates (g) 50.0 19.8 48.5 to 51.5 43.8 21.1 42.3 to 45.2
Total fat (g) 11.6 5.0 11.3 to 11.9 11.0 6.6 10.6 to 11.5
*Equivalent to 30% of children’s basal metabolic rate (BMR)=4689 kJ. n, number of participants included in analysis.
Figure 2 Distribution of food intake variables in children.
on September 22, 2020 by guest. Protected by copyright.
CI 0.15 to 0.28) for carbohydrate intake. In the adjusted linear regression analyses, the associations remained small but generally strong. For instance, for each gram higher parent total fat intake, child fat intake was 0.08 grams higher (p=0.003).
Table 4 extrapolates from table 3. While correlations were small at the population level, this modest degree of parent–child concordance in children’s daily snacks away from parents could account for substantial differ-ences in energy, fat and sodium intake for children aged 11–12 years. For example, a child whose parent’s snack energy intake was on the 90th percentile ate on average 227.4 kJ more than a child whose parent’s snack energy was on the 10th percentile—this projected additional consumption is equivalent to 5% of children’s basal metabolic rate. If extrapolated to one similar unsuper-vised snack on a daily basis, this may equate to the child consuming an additional 83 050 kJ per year, which could have a substantial cumulative impact on additional body fat over a period of years.
DISCUSSION Principal findings
This is the first population-based study to describe the intake of total food, energy, nutrient and sodium
consumed from standardised snack boxes provided separately, in a controlled setting, to children aged 11–12 years and their parents. Every food intake variable was positively correlated in parent–child dyads, with no obvious differences seen for mother–son versus mother– daughter dyads (numbers of fathers were too small to draw conclusions). Although modest at an individual level, this degree of parent–child concordance in a single daily snack, free of parental supervision could account for substantial differences in energy, fat and sodium intake over the course of a year for the population of Australian children aged 11–12 years.
Strengths and limitations
To the best of our knowledge, this is the largest and only population-based study to assess snack food intake using an objective measure. Objectively measured laboratory meals have been used in studies limited by small sample sizes and have predominantly been used to investigate environmental factors influencing food intake,38 39 41
rather than parent–child concordance. Previous studies looking at parent–child concordance of food intake have used self-report measures to assess dietary intake, which do not provide objective food intake data, but instead rely on subjective reports from participants. Our study is unique in avoiding the inaccuracies and under-reporting
Figure 3 Distribution of food intake variables in parents.
on September 22, 2020 by guest. Protected by copyright.
of food intake when self-report measures are used.33–37
By looking specifically at children’s snack choices inde-pendent of their parent, our study removes the influ-ence of direct parental modelling and of parents trying to guide their child’s eating by direct (eg, ‘You should
eat something otherwise you’ll be hungry in an hour’) or indirect prompts (eg, ‘This is very good, you’ll like that too’) prompts. It therefore evaluates the extent to which food choices are transmitted either by genetic predispo-sition or learnt eating behaviour, that is, behaviour that will continue to occur with or without immediate parental presence.
The narrow selection of snacks available in the snack box may limit its ability to predict true snack intake in Australian children and their parents when able to choose snack options from a wider range of sources. The snack box provided was limited to non-perishable food items that could be stored and moved easily to and from assessment centres around a very large country. This consisted of prepackaged items with easily obtained nutritional information and excluded items such as fresh fruit and vegetables. Additionally, given that participants were observed in a study centre rather than their usual environment, their intake might not fully reflect their usual snacking behaviour. Last, when it was not possible for individuals to be in Food Stop alone, they had their snack in the same room as, but separate from one (and occasionally more than one), unrelated individuals. In a final sensitivity analyses, we reran our analyses only with the children who ate entirely alone; results were virtually unchanged.
While participants were not formally fasted and received snack boxes at varying times of the day with non-uni-form duration of fasting, adjustments made for hunger rating demonstrated no significant effect on parent–child
Figure 4 Parent–child concordance, as represented by Pearson’s correlations.
Table 3 Parent–child concordance, as correlations and regression adjusted for covariates
Consumption
Pearson’s
correlation (n=1227)
Linear regression* (n=1218)
CC 95% CI RC P value
Grams (g) 0.14 0.07 to 0.20 0.14 <0.001 Energy (kJ) 0.19 0.12 to 0.26 0.13 <0.001 Protein (g) 0.17 0.09 to 0.23 0.12 <0.001 Saturated fat (g) 0.10 0.02 to 0.17 0.08 0.01 Sodium (mg) 0.08 0.01 to 0.15 0.07 0.03 Sugar (g) 0.14 0.07 to 0.20 0.11 <0.001 Carbohydrates (g) 0.22 0.15 to 0.28 0.17 <0.001 Total fat (g) 0.13 0.06 to 0.20 0.08 0.003
Note: values were virtually identical in sensitivity analyses including only the children who participated in Food Stop alone (data available on request).
*Adjusted for child and parent age, sex and BMI, Disadvantage Index and box combination.
BMI, body mass index; CC, Pearson’s correlation coefficient; RC, estimated regression coefficient; n, number of biological child-parent pairs with this measure.
on September 22, 2020 by guest. Protected by copyright.
concordance. However, as food and energy intake is known to vary from meal to meal and from day to day in a given individual,53 54 a single snack may be insufficient
to accurately estimate true food choices in children and their parents.
Strengths and weaknesses in relation to other studies
The small correlations found in our study support previous studies examining parent–child correlation of food intake. The slightly higher associations between parents and children in energy and nutrient intake (0.2– 0.3) in previous population studies23–29 may reflect that
few studies have specifically evaluated children’s inde-pendent food choices away from their parents. In one study of Dutch households with children aged 1–30 years, Feunekes et al24 found that the resemblance between
children’s and their parents’ fat and energy intake was higher for foods eaten within the home than elsewhere, indicating a greater role for alternate influences on food choices when away from the family environment. Our study’s small correlations support these findings. In other words, when eating away from the family and without parental control, children may be less likely to choose similarly to their parents, reducing already small associations.
Meaning and implications for clinicians and policymakers The immediate conclusion is that the nutritional amount and quality of independent snack choices must be influ-enced by factors other than parents, such as individual preferences, the presence of peers, availability of food, previous experiences and food advertising.21 55 All of
these may need to be targeted if seeking to improve snack quality and quantity. Nonetheless, at the population level, this modest degree of parent–child concordance in daily snack situations even when away from direct parental supervision could account for substantial differ-ences in energy, fat and sodium intake for children aged 11–12 years over time, and this could suffice for changes in body composition and body mass. While it is unclear whether these are genetically driven or learnt behaviours, targeting parent snack behaviours remains a potential avenue for influencing older children’s eating behaviour.
Unanswered questions and future research
This study warrants further research into the complex mechanisms driving parental influence on children’s independent snack intake. Such research will require large sample sizes so it is adequately powered to detect low concordances for individual parent-child pairs, as reported in the current and previous studies. Tackling poor nutrition in childhood and its associated morbidity likely requires an integrated, multifaceted approach, which may include modifiable mechanisms such as learnt behaviour transmitted from parent to child.
Author affiliations
1Murdoch Children's Research Institute, Parkville, Victoria, Australia
2Department of Paediatrics, The University of Melbourne, Parkville, Victoria, Australia
3Child and Adolescent Psychiatry/Psychology, Erasmus University Medical Centre,
Rotterdam, The Netherlands
4Department of Psychology, Education and Child Studies, Erasmus University,
Rotterdam, The Netherlands
5Discipline of Child and Adolescent Health, The University of Sydney, Sydney, New
South Wales, Australia
6Institute of Health and Sport, Victoria University, Melbourne, Victoria, Australia 7Department of Paediatrics and Liggins Institute, University of Auckland, Auckland,
New Zealand
Acknowledgements This paper uses unit record data from Growing Up in
Australia, the Longitudinal Study of Australian Children. The study is conducted in partnership between the Department of Social Services (DSS), the Australian Institute of Family Studies (AIFS) and the Australian Bureau of Statistics (ABS). Research Electronic Data Capture (REDCap) electronic data capture tools were used in this study. More information about this software can be found at: www. project- redcap. org. The authors thank the Longitudinal Study of Australian Children and CheckPoint study participants, staff and students for their contributions.
Contributors PV is the lead author of the manuscript and assisted in initial data
collection. JAK is a study investigator who oversaw the Food Stop conception, execution and analyses and provided advice and critical review of this manuscript. SAC is the study project manager, coordinated data collection and provided critical review of this manuscript. ACG assisted with statistical analysis and contributed to the writing of the manuscript. FKM and LAB are study investigators and contributed to the writing and editing of this manuscript. PWJ and KG are collaborators with CheckPoint and provided critical review of the manuscript. MW is the principal investigator of the Child Health CheckPoint, planned the analyses and provided critical review of the manuscript.
Funding This work was supported by the National Health and Medical Research
Council (NHMRC) of Australia (Project Grants 1041352 and 1109355), The Royal Children’s Hospital Foundation (2014-241), the Murdoch Children’s Research Institute (MCRI), The University of Melbourne, the National Heart Foundation of Australia (100660) and the Financial Markets Foundation for Children (2014-055 and 2016-310). The following authors were supported by the NHMRC: Senior Table 4 Child additional intake according to parent intake centiles
Food
Parent Food Stop intake Parent–child
adjusted regression coefficient
(from table 3)
Child projected additional intake on going from lower to higher parent percentile: per day / per year* Mean
Difference across percentiles
10th–90th 25th–75th 10th–90th 25th–75th
Grams (g) 165 214 128 0.14 30.0 / 10 963 17.9 / 6540
Energy (kJ) 1290 1749 877 0.13 227.4 / 83 050 114.0 / 41 653
Sodium (mg) 305 552 331 0.07 38.6 / 14 115 23.2 / 8459
Total fat (g) 11.0 18.8 8.4 0.08 1.5 / 550 0.68 / 247
*Assumes one unsupervised snack of this size each day over a year (365.25 days).
on September 22, 2020 by guest. Protected by copyright.
Research Fellowships to MW (1046518) and Career Development Fellowship to FKM (1111160). MW was supported by Cure Kids New Zealand. PWJ was supported by the Dutch Diabetes Foundation, grant number: 2013.81.1664. The MCRI administered the research grants for the study and provided infrastructural support (IT and biospecimen management) to its staff and the study but played no role in the conduct or analysis of the trial. DSS played a role in study design; however, no other funding bodies had a role in the study design and conduct; data collection, management, analysis and interpretation; preparation, review or approval of the manuscript; and decision to submit the manuscript for publication. Research at the MCRI is supported by the Victorian Government's Operational Infrastructure Support Program.
Disclaimer The findings and views reported in this paper are those of the author
and should not be attributed to DSS, AIFS or the ABS.
Competing interests All authors have completed the ICMJE uniform disclosure
form at www. icmje. org/ coi_ disclosure. pdf and declare financial support for the submitted work from the National Health and Medical Research Council of Australia, The Royal Children’s Hospital Foundation, the Murdoch Children’s Research Institute, The University of Melbourne, the National Heart Foundation of Australia and the Financial Markets Foundation for Children. MW received personal fees from the Australian Department of Social Services. MW and FKM were supported by the NHMRC, and MW by Cure Kids New Zealand. MW received grants from NZ Ministry of Business, Innovation & Employment and A Better Start/Cure Kids New Zealand and support from Sandoz to present at a symposium outside the submitted work.
Patient consent for publication Not required.
Ethics approval The CheckPoint data collection protocol was approved by The
Royal Children’s Hospital (Melbourne, Australia) Human Research Ethics Committee (33225D) and the Australian Institute of Family Studies Ethics Committee (14-26).
Provenance and peer review Not commissioned; externally peer reviewed.
Data sharing statement The Longitudinal Study of Australian Children datasets
and technical documents are available to researchers at no cost via a licence agreement. Data access requests are co-ordinated by the National Centre for Longitudinal Data. More information is available at https:// dataverse. ada. edu. au/ dataverse/ lsac.
Open access This is an open access article distributed in accordance with the
Creative Commons Attribution Non Commercial (CC BY-NC 4.0) license, which permits others to distribute, remix, adapt, build upon this work non-commercially, and license their derivative works on different terms, provided the original work is properly cited, appropriate credit is given, any changes made indicated, and the use is non-commercial. See: http:// creativecommons. org/ licenses/ by- nc/ 4. 0/.
REFERENCES
1. Maillot M, Drewnowski A. Energy allowances for solid fats and added sugars in nutritionally adequate U.S. diets estimated at 17-33% by a linear programming model. J Nutr 2011;141:333–40.
2. Mesas AE, Muñoz-Pareja M, López-García E, et al. Selected eating behaviours and excess body weight: a systematic review. Obes Rev 2012;13:106–35.
3. Pelletier AL, Chang WW, Delzell JE, et al. Patients' understanding and use of snack food package nutrition labels. J Am Board Fam
Pract 2004;17:319–23.
4. Kant AK. Consumption of energy-dense, nutrient-poor foods by adult Americans: nutritional and health implications. The third National Health and Nutrition Examination Survey, 1988-1994. Am J Clin Nutr 2000;72:929–36.
5. Kant AK. Reported consumption of low-nutrient-density foods by American children and adolescents: nutritional and health correlates, NHANES III, 1988 to 1994. Arch Pediatr Adolesc Med 2003;157:789–96.
6. Dietary Guidelines Advisory Committee. Scientific report of the 2015 dietary guidelines advisory committee: In. USDA and US Department of Health and Human Services. Washington (DC): USDA and US Department of Health and Human Services, 2015.
7. Barbieri HE, Lindvall C. Swedish nutrition recommendations objectified (SNO). Uppsala: National Food Administration, 2003. 8. National Health and Medical Research Council. Obesity and
Overweight. 2012. https://www. nhmrc. gov. au/ health- topics/ obesity- and- overweight.
9. Smith A, Schmerlaib Y, Kellett E. The Australian guide to healthy eating: background information for nutrition educators: Commonwealth Department of Health and Family Services, 1998.
10. Rangan AM, Randall D, Hector DJ, et al. Consumption of 'extra' foods by Australian children: types, quantities and contribution to energy and nutrient intakes. Eur J Clin Nutr 2008;62:356–64. 11. Rangan AM, Schindeler S, Hector DJ, et al. Consumption of 'extra'
foods by Australian adults: types, quantities and contribution to energy and nutrient intakes. Eur J Clin Nutr 2009;63:865–71. 12. Fayet F, Mortensen A, Baghurst K. Energy distribution patterns in
Australia and its relationship to age, gender and body mass index among children and adults. Nutrition & Dietetics 2012;69:102–10. 13. Gasser CE, Kerr JA, Mensah FK, et al. Stability and change in dietary
scores and patterns across six waves of the longitudinal study of australian children. Br J Nutr 2017;117:1137–50.
14. Mikkilä V, Räsänen L, Raitakari OT, et al. Consistent dietary patterns identified from childhood to adulthood: the cardiovascular risk in Young Finns Study. Br J Nutr 2005;93:923–31.
15. Vollmer RL, Mobley AR. Parenting styles, feeding styles, and their influence on child obesogenic behaviors and body weight. A review.
Appetite 2013;71:232–41.
16. Shloim N, Edelson LR, Martin N, et al. Parenting styles, feeding styles, feeding practices, and weight status in 4-12 year-old children: A systematic review of the literature. Front Psychol 2015;6:6.
17. Scaglioni S, Arrizza C, Vecchi F, et al. Determinants of children's eating behavior. Am J Clin Nutr 2011;94:2006S–11.
18. Savage JS, Fisher JO, Birch LL. Parental influence on eating behavior: conception to adolescence. J Law Med Ethics 2007;35:22–34.
19. Blaine RE, Kachurak A, Davison KK, et al. Food parenting and child snacking: a systematic review. Int J Behav Nutr Phys Act 2017;14:146.
20. Nielsen SJ, Siega-Riz AM, Popkin BM. Trends in energy intake in U.S. between 1977 and 1996: similar shifts seen across age groups.
Obes Res 2002;10:370–8.
21. Salvy SJ, Elmo A, Nitecki LA, et al. Influence of parents and friends on children's and adolescents' food intake and food selection. Am J
Clin Nutr 2011;93:87–92.
22. Klesges RC, Stein RJ, Eck LH, et al. Parental influence on food selection in young children and its relationships to childhood obesity.
Am J Clin Nutr 1991;53:859–64.
23. Beydoun MA, Wang Y. Parent-child dietary intake resemblance in the United States: evidence from a large representative survey. Soc Sci Med 2009;68:2137–44.
24. Feunekes GI, Stafleu A, de Graaf C, et al. Family resemblance in fat intake in The Netherlands. Eur J Clin Nutr 1997;51:793–9.
25. Elfhag K, Tholin S, Rasmussen F. Consumption of fruit, vegetables, sweets and soft drinks are associated with psychological dimensions of eating behaviour in parents and their 12-year-old children. Public
Health Nutr 2008;11:914–23.
26. Pérusse L, Tremblay A, Leblanc C, et al. Familial resemblance in energy intake: contribution of genetic and environmental factors. Am
J Clin Nutr 1988;47:629–35.
27. Talvia S, Räsänen L, Lagström H, et al. Longitudinal trends in consumption of vegetables and fruit in Finnish children in an atherosclerosis prevention study (STRIP). Eur J Clin Nutr 2006;60:172–80.
28. Oliveria SA, Ellison RC, Moore LL, et al. Parent-child relationships in nutrient intake: the framingham children's study. Am J Clin Nutr 1992;56:593–8.
29. Lahmann PH, Williams GM, Najman JM, et al. Mother-adult offspring resemblance in dietary intake: a community-based cohort study in Australia. Am J Clin Nutr 2017;105:185–93.
30. Wang Y, Beydoun MA, Li J, et al. Do children and their parents eat a similar diet? Resemblance in child and parental dietary intake: systematic review and meta-analysis. J Epidemiol Community Health 2011;65:177–89.
31. Archer E, Blair SN. Implausible data, false memories, and the status quo in dietary assessment. Adv Nutr 2015;6:229–30.
32. Ioannidis JP. Implausible results in human nutrition research. BMJ 2013;347:f6698.
33. Archer E, Hand G, Blair S. Validity of U.S. nutritional surveillance: National health and nutrition examination survey caloric energy intake data, 1971–2010. PLoS ONE 2013;8(10.
34. Tooze JA, Subar AF, Thompson FE, et al. Psychosocial predictors of energy underreporting in a large doubly labeled water study. Am J
Clin Nutr 2004;79:795–804.
35. Novotny JA, Rumpler WV, Riddick H, et al. Personality characteristics as predictors of underreporting of energy intake on 24-hour dietary recall interviews. J Am Diet Assoc 2003;103:1146–51.
36. Livingstone MB, Prentice AM, Coward WA, et al. Validation of estimates of energy intake by weighed dietary record and diet history in children and adolescents. Am J Clin Nutr 1992;56:29–35.
on September 22, 2020 by guest. Protected by copyright.
37. Livingstone MB, Robson PJ. Measurement of dietary intake in children. Proc Nutr Soc 2000;59:279–93.
38. Rolls BJ, Roe LS, Halverson KH, et al. Using a smaller plate did not reduce energy intake at meals. Appetite 2007;49:652–60.
39. DiSantis KI, Birch LL, Davey A, et al. Plate size and children's appetite: effects of larger dishware on self-served portions and intake. Pediatrics 2013;131:e1451–e1458.
40. Fisher JO. Effects of age on children's intake of large and self-selected food portions. Obesity 2007;15:403–12.
41. Fisher JO, Liu Y, Birch LL, et al. Effects of portion size and energy density on young children's intake at a meal. Am J Clin Nutr 2007;86:174–9.
42. Harris H, Mallan KM, Nambiar S, et al. The relationship between controlling feeding practices and boys' and girls' eating in the absence of hunger. Eat Behav 2014;15:519–22.
43. Moens E, Braet C. Predictors of disinhibited eating in children with and without overweight. Behav Res Ther 2007;45:1357–68. 44. Edwards B. Growing Up in Australia: The Longitudinal Study of
Australian Children: Entering adolescence and becoming a young adult. Family Matters 2014;95:5–14.
45. Sanson A, Johnstone R. Growing Up in Australia takes its first steps. Family Matters 2004;67:46–53.
46. Wake M, Clifford S, York E, et al. Introducing Growing Up in Australia's Child Health CheckPoint: A physical health and
biomarkers module for the Longitudinal Study of Australian Children. Family Matters 2014;95:15.
47. Clifford SA, Davies S, Wake M, et al. Child Health CheckPoint: Cohort summary and methodology of a physical health and biospecimen module for the Longitudinal Study of Australian Children. BMJ Open 2019;9(suppl 3):3–22.
48. Australian Bureau of Statistics. Census of population and housing: Socio-Economic Indexes for Areas (SEIFA) 2011. 2011. Cat no. 2033.0.55.001.
49. Kuczmarski RJ, Ogden CL, Grummer-Strawn LM, et al. CDC growth charts: United States. Adv Data 2000;314:1–27.
50. Heeringa SW, B; Berglund P. Applied Survey Data Analysis. Boca Raton: CRC Press, 2010.
51. Ellul S, Hiscock R, Mensah FK, et al. Longitudinal Study of Australian Children's Child Health CheckPoint Technical Paper 1: Weighting and non-response. Melbourne: Murdoch Children’s Research Institute, 2018.
52. Australian Bureau of Statistics. Overweight and Obesity in Adults in Australia: A Snapshot, cat. no. 4842.0.55.001. Canberra: Australian Bureau of Statistics, 2012.
53. Birch LL, Johnson SL, Andresen G, et al. The variability of young children's energy intake. N Engl J Med 1991;324:232–5.
54. Tarasuk V, Beaton GH. Day-to-day variation in energy and nutrient intake: evidence of individuality in eating behaviour? Appetite 1992;18:43–54.
55. French SA, Story M, Jeffery RW. Environmental influences on eating and physical activity. Annu Rev Public Health 2001;22:309–35.
on September 22, 2020 by guest. Protected by copyright.