O R I G I N A L A R T I C L E
Open Access
Optimisation of ultrasound liver perfusion
through a digital reference object and
analysis tool
Ángel Alberich-Bayarri
1,2*, Jose Tomás-Cucarella
1, Alfredo Torregrosa-Lloret
2, Javier Sáiz Rodriguez
3and
Luis Martí-Bonmatí
1Abstract
Background:Conventional ultrasound (US) provides important qualitative information, although there is a need to evaluate the influence of the input parameters on the output signal and standardise the acquisition for an
adequate quantitative perfusion assessment. The present study analyses how the variation in the input parameters influences the measurement of the perfusion parameters.
Methods:A software tool with simulator of the conventional US signal was created, and the influence of the different input variables on the derived biomarkers was analysed by varying the image acquisition configuration. The input parameters considered were the dynamic range, gain, and frequency of the transducer. Their influence on mean transit time (MTT), the area under the curve (AUC), maximum intensity (MI), and time to peak (TTP) parameters as outputs of the quantitative perfusion analysis was evaluated. A group of 13 patients with hepatocarcinoma was analysed with both a commercial tool and an in-house developed software.
Results:The optimal calculated inputs which minimise errors while preserving images’readability consisted of gain of 15 dB, dynamic range of 60 dB, and frequency of 1.5 MHz. The comparison between the in-house developed software and the commercial software provided different values for MTT and AUC, while MI and TTP were highly similar.
Conclusion:Input parameter selection introduces variability and errors in US perfusion parameter estimation. Our results may add relevant insight into the current knowledge of conventional US perfusion and its use in lesions characterisation, playing in favour of optimised standardised parameter configuration to minimise variability.
Keywords:Biomarkers, Liver, Perfusion imaging, Phantoms (imaging), Ultrasonography
Key points
Input parameters of the ultrasound devices impact
on the final results of quantitative perfusion analysis using microbubble-based contrast agents.
Virtual phantoms modelling ultrasound perfusion
acquisitions allow to assess the influence of the input parameters in perfusion measurements by the
creation of digital reference objects with known output values.
The lowest correlation when different software were
used was obtained for mean transit time and area under the curve parameters due to different
washout analysis, while maximum intensity and time to peak were similar and showed a high correlation with ground truth.
Background
Ultrasonography (US) is a well-established and highly accessible medical imaging modality. It has significantly evolved over time, incorporating the use of contrast agents to improve tissue and lesion contrast as well as * Correspondence:[email protected]
1
Biomedical Imaging Research Group (GIBI2^30), Hospital Universitari i Politècnic La Fe, Avda. Fernando Abril Martorell 106, Torre A, 46026 Valencia, Spain
2Quantitative Imaging Biomarkers in Medicine, QUIBIM SL, Valencia, Spain
Full list of author information is available at the end of the article
tial space and all models consist of a uni-compartment approach. A key aspect to the TIC-based quantification is the assumption that the variation in intensity is pro-portional to the concentration of the contrast agent and therefore related to blood flowing properties [8]. Nevertheless, signal is also influenced by technical pa-rameters related to the image acquisition procedure, such as gain, dynamic range, or transducer frequency, and by patient-related characteristics.
Regarding the technical parameters, currently, the US quantification of tissue perfusion has important chal-lenges. Nowadays, efforts are being made for the stand-ardisation of US devices for dynamic contrast-enhanced examinations by using calibration methods and guide-lines [9–11]. Factors such as the system configuration, the position and orientation of the probe, and the injec-tion rate of the microbubble-based contrast agent influ-ence the quantitative analysis. There are also significant variations in the TIC results as a consequence of the loss of spatial coherence due to transducer repositioning dur-ing the dynamic examination [12]. Even during the same acquisition, areas within the same organ, and therefore with similar perfusion profile, may generate different TICs [8, 9, 13–19]. Those technical factors that may contribute to inaccuracies and errors in US quantitative measures can be related to the US equipment settings and aspects related to the type and preparation of the microbubble-based contrast agent [20]. Patient-related factors include different physiological conditions of the subject which imply different propagation/attenuation factors and also the breathing and breath-hold collabor-ation. Both technical and patient-related factors limit the consideration of US perfusion parameters as quantitative imaging biomarkers.
The aim of our work was to analyse the relationship between the system input parameters and the variability in the perfusion measurements in order to optimise the acquisition of images and US perfusion analysis.
Methods
In order to simulate the US signal and the behaviour of the contrast agent and evaluate the influence that different
acteristics and evaluate the optimum input parameters minimising the variability of the perfusion parameters.
After the optimum input parameters were calculated, these were introduced in a real US system and the perfu-sion results obtained in a group of patients were com-pared to the values provided by an already existing commercial solution (Contrast Dynamics Software®, Sie-mens AG, Erlangen, Germany), which was considered as the reference pattern, despite the details of the propri-etary calculation algorithms applied to the images were unknown.
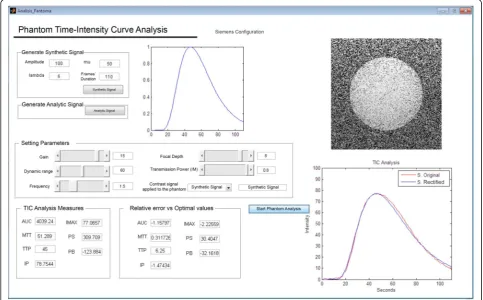
Development of US perfusion virtual phantom
A US perfusion virtual phantom was synthesised by simulating the US signal in order to analyse the influ-ence of the acquisition parameters in the measurement of the mean transit time (MTT), the area under the curve (AUC), the maximum intensity (MI), and the time to peak (TTP) under stable conditions.
The ranges of the available input parameters in real US acquisition devices were specified for the US simulator [21]. Sequences of images were synthesised in the simula-tor in order to observe how input parameters influence MTT, AUC, MI, and TTP calculations by changing gain, dynamic range, focus, frequency, and mechanical index settings (Fig.2).
v tð Þ ¼ k
Z
R zð Þa t−2z c
e−2z∝ð Þfo eiwoð Þt−2cz dz
ð1Þ
where the voltage at timet was related to the sum of all signals received at that temporal instant, z is the depth achieved by the signal, R(z) are reflection regions crossed by the signal,αrepresents the attenuation of the
signal because of the medium, andfois the transmitting frequency.
After demodulation of the received echoes, the trans-ducer converts pressure measurements into voltage. Subsequently, the signal is quantified and represented as a greyscale. Spatial registration is required to analyse the simulated data-compressed images of 8-bit. The
Fig. 1Schematic diagram of the process for theoretically obtaining the optimum input parameters minimising output variability.AUCarea under
the curve,Ddownslope,MImaximum intensity,MTTmean transit time,PIperfusion index,TICtime-intensity curve,TTPtime to peak,Uupslope,
USultrasound
In these expressions,Vmaxis the maximum echo amp-litude of the raw radiofrequency data which was set at 215 – 1 (maximum positive amplitude of signed 16-bit integer),V is the echo-amplitude, LCDR is the dynamic
range of log-compression expressed in dB, and uint8 represents the unsigned 8-bit integer quantification type-cast operator.
For the normal procedure of the simulator, the com-pression and linearisation logarithm was applied to the image sequence received from the virtual phantom.
In order to simulate the input curves and the volume dose of contrast agent, the local density random walk (LDRW) model [20] was applied. The LDRW model rep-resents the concentration of contrast over time, as it can be observed in Eq.4.
C tð Þ ¼m Qe
λ
ffiffiffiffiffiffiffiffiffiffiffiffiffiffiffiffiffiffiffiffiffiffiffiffiffi
λ
2πμte
−λ
2ð Þμtþμt s
ð4Þ
wherem is the injected mass of the contrast agent,Q
is the volumetric flow, λ is a parameter related to the
circulation which takes a few seconds after the intra-venous injection of the contrast agent. This period lasted about 30–35 s. The second phase, named as por-tal or venous phase in the liver, was then initiated, last-ing up to 120 s. Final plateau late phase corresponded to contrast elimination [5]. The signal from the microbubble-based contrast agent disappeared com-pletely after 240–360 s. Algorithms for the identifica-tion of these curve phases were implemented. This allowed the calculation of MTT, AUC, MI, and TTP.
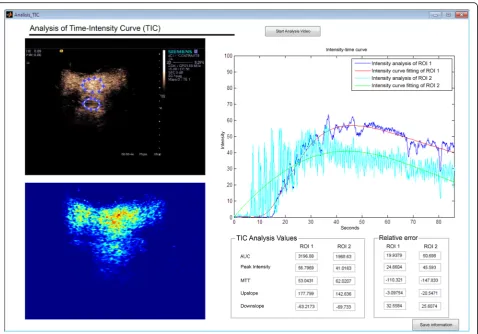
All the developed methods were implemented in a user interface whose primary function was to analyse the perfusion properties of the contrast bolus in the organism.
Once the study was loaded, a region was delimited in the tissue or lesion under study (Fig. 4). The curve ob-tained was adjusted to a Gaussian distribution by LDRW model.
The analysis tool allowed to analyse log-compressed greyscale video in “.avi” format, exported off-line from US devices.
Optimisation of input parameters
In order to evaluate the dependency of the results on the input parameters and, therefore, to choose an optimum acquisition protocol, four different experi-ments were performed by varying specific parameters while maintaining the other at constant values. The de-tails of the experiments and the steps of variation of the different parameters can be appreciated in Table 1. A total of 109 combinations of the different parameters was evaluated.
The output signals of the experiments were measured, and the errors in MTT, AUC, MI, and TTP were ana-lysed. The input parameters were optimised considering
the minimum possible error among all the measure-ments obtained.
In vivoanalysis in patients
A total of 13 patients (8 males and 5 females, mean age 58 ± 7 years, paired to age) diagnosed with cirrhosis and liver hepatocarcinoma by previous magnetic resonance imaging and pathology were consecutively included in the study after receiving Ethics Committee approval for the project. Each enrolled subject signed the informed consent. Recruitment period was of 6 months. All the US acquisitions were performed using an Acuson S2000 system (Siemens, Erlangen, Germany). The process of
Fig. 4User interface of the perfusion analysis tool. The user interface contains axes to visualise the time-intensity curve (TIC) and the results of the analysis in two different ROI. It also includes the possibility of visualising the ultrasound video for regions of interest delineation
Table 1Input parameters and corresponding variations introduced to the system
Experiment number Parameter Range of variation Step
1 Gain - 20 to 20 dB 1 dB
2 Dynamic range 30 to 90 dB 5 dB
3 Gain and dynamic range - 20 to 20 dB 1 dB
30 to 90 dB 5 dB
by an experienced radiologist with more than 30 years of experience with liver US. The region studied consisted of the one where the lesion was present. Finally, the video data of the US perfusion sequence was acquired and stored in“.avi”format.
Data was analysed using both the in-house developed US perfusion analysis tool and the clinically approved commercial software, which was considered as the refer-ence. The regions of interest were visually verified to be positioned in the same location. The calculation of the optimum parameters was performed by an algorithm randomly selecting input parameter combinations; for this, a random command provided a random number that was used to select the position of the vector of starting variables.
Statistical analysis
Data normality was verified by means of the Kolmogorov-Smirnov test. For the comparison against a ground truth consisting of a commercial software, the relative error was calculated. The relative error of the measurements obtained from the analysis comparing to the synthesised parameters in the digital reference ject (considered as the reference or ground truth) was ob-tained by calculating the difference between measurement and ground truth and dividing it by the latter, finally multiplying by 100 to obtain a percentage. For better un-derstanding the relationships between pairs of results using both in-house and commercial methods, Pearson correlation, linear regression, and Bland-Altman tech-niques were used. Apvalue lower than 0.05 was consid-ered as the threshold for statistical significance for all tests. SPSS (version 24; SPSS, IBM, Chicago, IL) was used for the analysis.
Results
Optimisation of acquisition
The maximum errors obtained, considering all the range of input parameters, were 3.30% for MTT, 17.02% for AUC, 11.4% for MI, and 1.05% for TTP. For the variation in gain, frequency, and dynamic range, an almost null of approximately 0% for all the parameters was obtained at 0
In vivoanalysis methodology validation
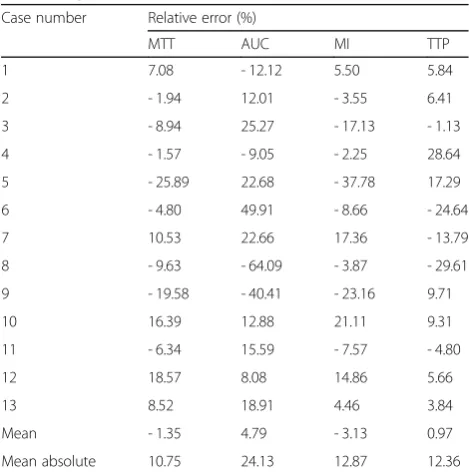
There was a moderate variation between the measure-ments obtained with both software solutions. The values obtained for the MTT, AUC, MI, and TTP parameters followed a normal distribution. The relative errors ob-tained can be appreciated in Table2. The average relative error between the in-house implemented methodology and the commercial solution in the calculated parameters was below 5%. When absolute values of the relative errors were considered, the average absolute difference between both analysis solutions reached 24% for the AUC param-eter, while it was below 13% for all the remaining parameters.
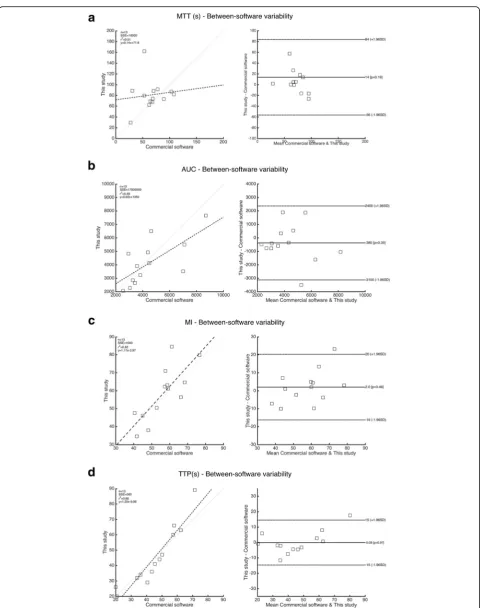
The AUC (r= 0.70, p= 0.007), MI (r= 0.79, p= 0.001), and TTP (r= 0.97,p< 0.001) variables presented a signifi-cant correlation between the in-house and the commercial
Table 2Relative errors calculated between the in-house and the commercial software for the analysed parameters, including mean relative error for every parameter and mean relative error considering the absolute values
Case number Relative error (%)
MTT AUC MI TTP
1 7.08 - 12.12 5.50 5.84
2 - 1.94 12.01 - 3.55 6.41
3 - 8.94 25.27 - 17.13 - 1.13
4 - 1.57 - 9.05 - 2.25 28.64
5 - 25.89 22.68 - 37.78 17.29
6 - 4.80 49.91 - 8.66 - 24.64
7 10.53 22.66 17.36 - 13.79
8 - 9.63 - 64.09 - 3.87 - 29.61
9 - 19.58 - 40.41 - 23.16 9.71
10 16.39 12.88 21.11 9.31
11 - 6.34 15.59 - 7.57 - 4.80
12 18.57 8.08 14.86 5.66
13 8.52 18.91 4.46 3.84
Mean - 1.35 4.79 - 3.13 0.97
Mean absolute 10.75 24.13 12.87 12.36
MTTmean transit time,AUCarea under the curve,MImaximum intensity,TTP
tools. Nevertheless, MTT presented significant differences in some patients, with no significant correlation (r= 0.21,
p= 0.48). The linear regression and Bland-Altman graph-ical comparison of the two methods can be appreciated in Fig. 5. For MTT and AUC, the bias was of 14 s and 380 a.u., respectively, while for MI and TTP were highly close to the line of equality, being 2 a.u. and - 0.09 s. The limits of agreement were also higher for MTT and AUC.
Discussion
Exciting advances have been produced in the contrast agent field for medical imaging in the past two decades, particularly in the development of compounds with bet-ter enhancement, signal properties, pharmacokinetics, and safety. The interaction between these agents and the human body can be actually analysedin vivoby US, using new methods that allow the acquisition of images of remarkable quality to monitor organs and lesions in order to detect and characterise disorders with high ac-curacy. US perfusion techniques are therefore expand-ing the range of clinical applications of this imagexpand-ing modality.
Contrast-enhanced US offers important advantages over existing imaging modalities, as it is highly available without any safety issues [24, 25]. However, the clinical value of this perfusion technique is compromised by the relatively large variations in the imaging procedures, protocols, and quantification results due to the lack of standardisation.
In this paper, we have examined gain, dynamic range, and frequency contribution to the variations in contrast behaviour and signal intensity, thus directly influencing the quantitative perfusion measurements. Beyond system settings, which was the goal of the optimisation study, other factors like microbubble-based contrast agent properties and patient management were considered constant [20]. With this optimisation, a standardisation of the acquisition configuration profile that minimised the error in the US perfusion quantitative analysis was achieved.
To our knowledge, a virtual phantom for US perfusion simulation like the described in the present manuscript has not been previously developed. This approach allowed the evaluations of the influence of the system in-put parameters on the quantification outin-put (i.e., on the TIC) as all other influential factors, like those related to patient conditions and contrast agent properties, were preserved to have the minimum variations between ex-aminations [5, 20]. In the case of patients, the prepar-ation phase was the same across the patients in order to avoid influence of external factors in the results.
The optimum configuration obtained was found to minimise the error of the results while preserving images readability in clinical routine. For all the experiments,
the focus was considered to be placed below the region of interest and the mechanical index was fixed to 0.08 to avoid microscopic air bubbles. The mechanical index is correlated to the probability of formation of microscopic air bubbles and is inversely proportional to the square root of the US frequency: by increasing the intensity of the US, mechanical index increases, with a higher prob-ability to have microscopic air bubbles. The focus param-eter was specified far from the region of interest, since it significantly modifies the amplitude of the signal, follow-ing conventional procedures in US perfusion. Under these optimised conditions, the highest relative error was ob-tained for MTT, followed by AUC, TTP, and MI, by com-paring the values obtained with the previously imposed ones in the virtual phantom creation. Nevertheless, all relative errors were below 1.50%.
After the acquisition standardisation, tests were per-formed in patients with diagnosed liver hepatocarci-noma. In these in vivo studies, it was found that for a proper and correct diagnosis it was necessary to increase the gain to 15 dB for a better detection and visualisation of the lesions and, therefore, a better diagnosis. No other parameters needed to be modified.
The studies were analysed both with the commercial software and with the in-house developed application. Although in the same numerical range, different values were obtained in several patients for the MTT and AUC parameters, while MI and TTP were close to the refer-ence. This variability can be explained by the different strategies that both software tools use for the calculation of the washout, since both MTT and AUC are related to this phase. The Bland-Altman analysis clearly showed that a systematic difference exist between both software tools for MTT and AUC. In the case of our software, MTT was considered as the range of times correspond-ing to the full width at half maximum of peak enhance-ment, as usually performed for enhancement analysis in perfusion studies across other modalities like magnetic resonance imaging. For the calculation of the AUC, the whole washout decay curve was considered in our soft-ware. End of washout phase was considered when the signal slope was equal to 0 after the arterial peak. The criteria for the algorithm included in the commercial software is unknown, and although it was considered as the reference standard, its use today is only allowed in the research field due to the lack of the 510 (k) clearance from the United States Food and Drug Administration. MI and TTP parameters, which are uniquely calculated from the arterial phase, were highly similar.
providing perfusion parameters useful in a clinical context.
The study presented some limitations that should be commented. Related to the stability of the US contrast agent, preparation, conservation, and administration time affect quantification. Some studies reported a significant in-cidence of spontaneous gas diffusion phenomena on tem-poral evolution of the contrast microbubble size [23]. Bubbles have a wide range of distributions in terms of size and coating parameters, which are largely unknown [18,
19]. Second, image preparation and analysis consisted of collecting scan-converted video data and not Digital Im-aging and COmmunications in Medicine (DICOM) files. Third, due to breathing movement, the liver was slightly displaced during acquisitions, thus introducing some vari-ability in resulting images. Co-registration of motion was applied, but no significant improvements were due to the complexity of the co-registration in the liver. A US spatial registration technique should be proposed as an improve-ment to our analysis methodology. However, due to the high variability in liver parenchyma, this can be considered a future challenge. As fourth and fifth limitations, the cohort recruited consisted of a small patient sample size and the decision to use a specific commercial soft-ware instead of another was based on technology avail-ability at our centre. Finally, the influence of patient size and amount of subcutaneous/visceral fat were not collected in this study. This factor, together with the hepatocarcinoma location within the liver (superficial, closer to the probe or deeper in the liver parenchyma) may have influenced perfusion results due to different expected intensities in the US probe. This topic is now under consideration by our research group.
In conclusion, a US perfusion simulator method-ology was engineered by means of creating a digital reference object acting as a virtual phantom. A tool for TIC analysis that was developed in-house permit-ted the quantification of perfusion properties. Both so-lutions allowed the evaluation of the optimum US input parameters to minimise variability and obtain a high reproducibility in the perfusion measurements. Our results may add relevant insight into the current knowledge of US perfusion acquisition standardisation and its use in oncology.
Abbreviations
AUC:Area under the curve; LDRW: Local density random walk; MI: Maximum
intensity; MTT: Mean transit time; TIC: Time-intensity curve; TTO: Time to peak; US: Ultrasonography
Funding
The authors state that this work has not received any funding.
Availability of data and materials
The datasets used and/or analysed during the current study will be available from the corresponding author on reasonable request.
Authors’contributions
AAB drafted the first version of entire manuscript and collaborated in feedback analysis, LMB led the data collection part for the analysis of the images, ATLL reviewed the manuscript, JTC analysed the US perfusion data, and JSR reviewed the final version. All authors read and approved the final manuscript.
Ethics approval and consent to participate
The research ethics committee at La Fe Health Research Institute approved this study.
Consent for publication
Not applicable.
Competing interests
AAB and LMB are founders of the spin-off company QUIBIM SL. The other authors declare that they have no competing interests.
Publisher’s Note
Springer Nature remains neutral with regard to jurisdictional claims in published maps and institutional affiliations.
Author details
1Biomedical Imaging Research Group (GIBI2^30), Hospital Universitari i
Politècnic La Fe, Avda. Fernando Abril Martorell 106, Torre A, 46026 Valencia, Spain.2Quantitative Imaging Biomarkers in Medicine, QUIBIM SL, Valencia,
Spain.3Department of Electronics Engineering, Polytechnics University of Valencia, Valencia, Spain.
Received: 28 August 2018 Accepted: 4 January 2019
References
1. Parker JM, Weller MW, Feinstein LM et al (2013) Safety of ultrasound
contrast agents in patients with known or suspected cardiac shunts. Am J Cardiol 112:1039–1045.
2. Dhamija E, Paul SB (2014) Role of contrast enhanced ultrasound in hepatic
imaging. Trop Gastroenterol 35:141–151.
3. Wang XY, Kang LK, Lan CY (2014) Contrast-enhanced ultrasonography in
diagnosis of benign and malignant breast lesions. Eur J Gynaecol Oncol 35: 415–420.
4. Wang S, Yang W, Zhang H, Xu Q, Yan K (2015) The role of
contrast-enhanced ultrasound in selection indication and improveing diagnosis for transthoracic biopsy in peripheral pulmonary and mediastinal lesions. Biomed Res Int 2015:231782.
5. Green MA, Mathias CJ, Willis LR, et al (2007) Assessment of Cu-ETS as a PET
radiopharmaceutical for evaluation of regional renal perfusion. Nucl Med Biol 34:247–255.
6. Daghini E, Primak AN, Chade AR, et al (2007) Assessment of renal
hemodynamics and function in pigs with 64-section multidetector CT:
comparison with electron-beam CT. Radiology 243:405–412.
7. Martin DR, Sharma P, Salman K, et al (2008) Individual kidney blood flow
measured with contrast-enhanced first-pass perfusion MR imaging.
Radiology 246:241–248.
8. Tang MX, Mulvana H, Gauthier T, et al (2011) Quantitative
contrast-enhanced ultrasound imaging: a review of sources of variability. Interface Focus 1:520–539.
9. Gauthier TP, Averkiou MA, Leen EL (2011) Perfusion quantification using
dynamic contrast-enhanced ultrasound: the impact of dynamic range and gain on time-intensity curves. Ultrasonics 51:102–106.
10. Möller I, Janta I, Backhaus M, et al (2017) The 2017 EULAR standardised
procedures for ultrasound imaging in rheumatology. Ann Rheum Dis. 76: 1974–1979.
11. Pitre-Champagnat S, Coiffier B, Jourdain L, Benatsou B, Leguerney I, Lassau
N (2017) Toward a standardization of ultrasound scanners for dynamic contrast-enhanced ultrasonography: methodology and phantoms.
Ultrasound Med Biol.https://doi.org/10.1016/j.ultrasmedbio.2017.06.032
12. Shunichi S, Hiroko I, Fuminori M, Waki H (2009) Definition of contrast
enhancement phases of the liver using a perfluoro-based microbubble
for monitoring therapy. Ultrasound Med Biol 36:68–77.
18. Kuenen MP, Mischi M, Wijkstra H (2011) Contrast-ultrasound diffusion
imaging for localization of prostate cancer. IEEE Trans Med Imaging 30: 1493–1502.
19. Garcia D, Le Tarnec L, Muth S, Montagnon E, Porée J, Cloutier G(2013) Stolt’s
f-k migration for plane wave ultrasound imaging. IEEE Trans Ultrason Ferroelectr Freq Control 60:1853–1867.
20. Brands J, Vink H, Van Teeffelen JW (2011) Comparison of four mathematical
models to analyze indicator-dilution curves in the coronary circulation. Med
Biol Eng Comput 49:1471–1479.
21. Zhou JH, Cao LH, Zheng W, Liu M, Han F, Li AH (2011) Contrast-enhanced
gray-scale ultrasound for quantitative evaluation of tumor response to chemotherapy: preliminary results with a mouse hepatoma model. AJR Am J Roentgenol 196:W13-17.
22. Wei K, Jayaweera AR, Firoozan S, Linka A, Skyba DM, Kaul S (1998)
Quantification of myocardial blood flow with ultrasoundinduced destruction of microbubbles administered as a constant venous infusion. Circulation 97: 473–483
23. Riascos P, Velasco-Medina J (2005) Efectos Biológicos y Consideraciones de
Seguridad en Ultrasonido. Available viahttps://www.yumpu.com/es/
document/view/15350629/efectos-biologicos-y-consideraciones-de-seguridad-en-ultrasonido
24. de Jong N, ten Cate FJ, Vletter WB, Roelandt JR (1993) Quantification of
transpulmonary echocontrast effects. Ultrasound Med Biol 19:279–288
25. Quaia E (2011) Assessment of tissue perfusion by contrast-enhanced