METHODOLOGY
Efficient estimation of the maximum
metabolic productivity of batch systems
Peter C. St. John, Michael F. Crowley and Yannick J. Bomble
*Abstract
Background: Production of chemicals from engineered organisms in a batch culture involves an inherent trade-off between productivity, yield, and titer. Existing strategies for strain design typically focus on designing mutations that achieve the highest yield possible while maintaining growth viability. While these methods are computationally tractable, an optimum productivity could be achieved by a dynamic strategy in which the intracellular division of resources is permitted to change with time. New methods for the design and implementation of dynamic microbial processes, both computational and experimental, have therefore been explored to maximize productivity. However, solving for the optimal metabolic behavior under the assumption that all fluxes in the cell are free to vary is a chal-lenging numerical task. Previous studies have therefore typically focused on simpler strategies that are more feasible to implement in practice, such as the time-dependent control of a single flux or control variable.
Results: This work presents an efficient method for the calculation of a maximum theoretical productivity of a batch culture system using a dynamic optimization framework. The proposed method follows traditional assumptions of dynamic flux balance analysis: first, that internal metabolite fluxes are governed by a pseudo-steady state, and secondly that external metabolite fluxes are dynamically bounded. The optimization is achieved via collocation on finite elements, and accounts explicitly for an arbitrary number of flux changes. The method can be further extended to calculate the complete Pareto surface of productivity as a function of yield. We apply this method to succinate production in two engineered microbial hosts, Escherichia coli and Actinobacillus succinogenes, and demonstrate that maximum productivities can be more than doubled under dynamic control regimes.
Conclusions: The maximum theoretical yield is a measure that is well established in the metabolic engineering liter-ature and whose use helps guide strain and pathway selection. We present a robust, efficient method to calculate the maximum theoretical productivity: a metric that will similarly help guide and evaluate the development of dynamic microbial bioconversions. Our results demonstrate that nearly optimal yields and productivities can be achieved with only two discrete flux stages, indicating that near-theoretical productivities might be achievable in practice.
Keywords: Flux balance analysis, Dynamic optimizations, Elementary flux modes, Actinobacillus succinogenes,
Escherichia coli
© The Author(s) 2017. This article is distributed under the terms of the Creative Commons Attribution 4.0 International License (http://creativecommons.org/licenses/by/4.0/), which permits unrestricted use, distribution, and reproduction in any medium, provided you give appropriate credit to the original author(s) and the source, provide a link to the Creative Commons license, and indicate if changes were made. The Creative Commons Public Domain Dedication waiver (http://creativecommons.org/ publicdomain/zero/1.0/) applies to the data made available in this article, unless otherwise stated.
Background
Microbial bioconversion plays a critical role in efforts to enable sustainable production of commodity chemi-cals from renewable feedstocks. The economic feasibil-ity of the integrated biorefinery concept therefore hinges sharply on the productivity, yield, and titers that can be achieved by a given microbial host [1]. Flux balance
modeling has emerged as an important tool in guiding experimental efforts in strain design by predicting the effects of gene knockouts and overexpression on metabo-lite yields [2]. In developing engineered organisms for optimal performance in batch cultures, a trade-off is often encountered between the productivity and yield that can be obtained via metabolic interventions [3]. As a result, many existing strategies for strain design such as OptKnock or OptForce involve designing mutations to achieve the highest possible yield while maintaining
Open Access
*Correspondence: [email protected]
growth viability [4, 5]. Other strategies, including DyS-ScO, have specifically addressed the importance of pro-ductivity through dynamic simulations [6, 7]. Overall, approaches tend to follow the principle of designing static networks with minimum metabolic functionality to achieve desired product yields [8]. While these methods are computationally and experimentally tractable, opti-mum productivity is likely achieved by a dynamic strat-egy, in which the partition of resources between biomass and product formation varies with time [9].
Experimental studies have investigated the use of multi-stage fermentations to increase productivity and/ or yield. These techniques range from simple manipula-tions, such as changing from aerobic to anaerobic condi-tions [10, 11], to more complex genetic toggle switches [12] or otherwise inducible gene expression [13]. Com-putational methods have also been developed to aid in optimizing two-stage fermentation systems. Gadkar et al. optimized the flux profile of glycerol kinase to maximize the productivity of glycerol from glucose [14]. Simi-larly, Anesiadis and coworkers proposed an extension to Gadkar’s work, where parameters for a quorum-sensing toggle switch are tuned to provide the optimal repres-sion for a target gene to maximize ethanol productivity [15]. By choosing a single reaction target as their control strategy and ensuring that unmodulated fluxes are con-strained to maximize a growth objective, these strategies follow similar, well-known techniques such as MOMA [16] or ROOM [17] in calculating an expected biological response from an experimental perturbation. However, a method to calculate a theoretically optimal global limit for a batch culture’s metabolic productivity does not cur-rently exist.
The calculation of maximum theoretical yield is well established in the metabolic engineering literature, and its use helps guide strain design and pathway selection for static knockout and/or overexpression efforts. Maxi-mum yields are useful even though they are not physi-cally realizable: they reveal the cofactor balancing and pathway split ratios necessary to achieve optimum car-bon conservation. In an analogous fashion, an estimate of the maximum theoretical productivity of a batch cul-ture system would prove equally useful for the growing field of designing dynamic metabolic interventions. How-ever, due to the computational burden associated with optimizing over all feasible flux profiles, no generalized framework for such an estimate currently exists.
In this article, we present an efficient method for cal-culating the maximum theoretical productivity of a batch system based on dynamic optimization [18]. Dynamic optimization is a mathematical approach for solving problems involving a differential equation for a desired endpoint objective, in this case the maximum product
production in the minimum time. Rather than guessing values for the metabolic state and repeatedly integrating the system forward in time, the approach involves divid-ing the time domain into a set of finite elements, and within each, representing the dynamic system by a col-lection of interpolating polynomials. The polynomials are constrained to be continuous between each finite ele-ment, and at each of a set of defined points, constraints are imposed to ensure the derivatives of the interpolat-ing polynomials are consistent with maximum substrate uptake rates and maintenance requirements. In this manner, optimal metabolite profiles are found in a single optimization using a large-scale nonlinear programming solver. Dynamic optimization has previously been used in metabolic modeling, including in dynamic flux balance analysis (DFBA) [19] and in calculating optimal control for fed-batch fermentations [20]. However, its widespread usage has been limited by the number of variables that can be simultaneously considered. We therefore remove the explicit mass balance constraints by calculating ele-mentary flux modes [21], and reduce the dimensional-ity of the optimization problem using yield analysis [22]. Our method accounts explicitly for an arbitrary number of fermentation stages, and allows metabolic fluxes to change continuously over the course of the entire simu-lation. The method therefore prioritizes finding reason-able upper bounds for the productivities and yields of a given bioprocess over the faithful representation of a cell’s response to genetic perturbation. Since productiv-ity and yield cannot be simultaneously maximized, we demonstrate how this method can be easily extended to calculate the complete productivity vs. yield Pareto frontier. We apply our method to succinic acid produc-tion in two microbial hosts: engineered Escherichia coli and native Actinobacillus succinogenes. Succinic acid is a precursor to commodity chemicals in several industries, and a promising intermediate in the development of sus-tainable chemical production routes [23]. We show that the method can be useful in strain choice by comparing optimal productivity–yield surfaces for two organisms, and further demonstrate that nearly optimal yields and productivities can be achieved with only two discrete flux stages.
Methods
Dynamic flux balance analysis
In flux balance analysis (FBA) models, intracellular metabolic reactions are represented by a stoichiometric matrix S, such that Sij represents the quantity of metab-olite j produced (or consumed) by reaction i. Fluxes through each reaction are represented by the vector v.
associated with cell growth or changes to external metab-olite concentrations, and therefore that metabmetab-olites in the cell can be modeled using a pseudo-steady-state approxi-mation, Sv≈0.
FBA models can be extended to consider the dynam-ics of substrate consumption and biomass formation by including specific bounds on exchange fluxes and allow-ing the accumulation or depletion of external metabolites. The dynamic system for cell growth considered in this paper is
where x(t) represents the concentration of external
boundary species, chosen such that x0(t) is the con-centration of dry cell weight (DCW, in grams), and v(t) represents the flux through each reaction in the cell (in mmol gDCW−1 h−1), chosen such that v0(t) through vN rep-resent the exchange flux for species x0 through xN, respec-tively. The flux through the first reaction is therefore the specific growth rate (v0(t)≡µ(t)), and is in units of h−1. The resulting dynamic flux balance analysis (DFBA) model takes the form of an ordinary differential equation with an embedded linear program, for which efficient methods for the solution of the initial value problem have been developed [24]. However, unlike in dynamic flux bal-ance analysis, in this study we do not impose the optimal-ity of a given cellular objective at each moment in time.
The objective considered in this paper is to maximize productivity of the desired metabolite, xp, by finding the
optimum intracellular flux profiles v(t) and final
fermen-tation time tf, subject to steady-state constraints, reaction reversibility, and substrate uptake:
The optimization in Eqs. 1 and 2 therefore takes the form of an optimal control problem, which can be solved by discretizing in time and solving the problem using dynamic optimization. In previous applications of dynamic optimization in DFBA models, intercellular fluxes are either optimized directly [20] or replaced with representative input–output reactions found via path-way analysis [19]. As each dynamic variable requires a number of parameters to fully specify its shape over the course of the fermentation, minimizing the number of modeled fluxes helps ensure the optimizations converge. In this study, we take advantage of the productivity objec-tive to select Pareto-optimal pathways, greatly reducing the dimensionality of the optimization.
(1) dxi(t)
dt =vi(t)x0(t) fori∈ [0,NX],
(2) max
v(t),tf
xp(tf)−xp(t0) tf such that Sv(t)=0,
vlb(t)≤v(t)≤vub(t).
Calculation of elementary flux modes
To select the optimal metabolic pathways, we calculate elementary flux modes (EFMs) for both of the consid-ered metabolic networks. An EFM is a vector r in the right nullspace of S (Sr≡0), such that no other elemen-tary mode has nonzero entries that are a subset of the nonzero entries of ri [21, 25]. EFMs contain the impor-tant property that any vector in the right nullspace of S , i.e., any feasible steady-state flux, can be expressed as a nonnegative combination of the elementary modes r [26]. Because of this property and because we are only inter-ested in the effect of an elementary mode on the maxi-mum productivity, we can condense the complete set of EFMs to a convex hull in the projection in which we are interested [22]. We further restrict our analysis to the Pareto front of EFMs which allow optimum productivity, removing inefficient modes without affecting the optimal solution.
Dynamic optimization
We find the flux profiles that achieve the maximum pro-ductivity via orthogonal collocation on finite elements, a method for solving endpoint problems involving a dynamic system without an embedded ordinary differ-ential equation (ODE) integrator [18]. In the method, the dynamic system is represented by a series of algebraic constraints that implement an implicit Runge–Kutta method. The resulting sparse nonlinear program is then solved via a large-scale nonlinear programming (NLP) solver. Following the approach of orthogonal collocation [27], we represent the state variables x(t) from Eq. 1 as
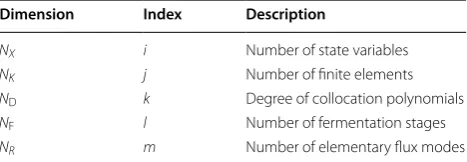
a collection of Lagrange interpolating polynomials. A summary of the dimensions and variables used in this method are presented in Tables 1 and 2.
The time domain t of the fermentation is divided into NK finite elements with a nondimensionalized internal time τ ∈ [0, 1]. Within each finite element, we represent the state vector by a polynomial of degree ND at ND+1 collocation points, denoted τn. We use Gauss–Radau col-location for its stiff decay, and therefore for ND=5, we set τk ∈ {0, 0.06, 0.28, 0.58, 0.86, 1.00}:
Table 1 Dimensions of the NLP problem Dimension Index Description
NX i Number of state variables
NK j Number of finite elements ND k Degree of collocation polynomials
NF l Number of fermentation stages
To model changes in the flux distribution, the finite ele-ments are allocated between NF distinct fermentation stages. Within each stage, we assume the fractional dis-tribution of elementary modes is held constant, while the total flux through the system is allowed to vary. The dynamic system can thus be calculated by
in which R is a matrix of shape (NR,NX) that contains the chosen elementary modes; yl contains the fractional distribution of each elementary mode in the given stage; ajk is the time-varying combined flux through all elemen-tary modes; and x0jk represents the current biomass con-centration at the given collocation point. In addition to changes in fractional EFM distribution, the step size hl is also optimized by the nonlinear program and allowed to vary between fermentation modes.
Solution of the problem involves the constrained opti-mization over the variables found in Table 2 of the pro-ductivity objective
Orthogonal collocation imposes a number of constraints during the optimization process (Eqs. 6, 7, 8, 9, 10). The first of these constraints is that state variable profiles must obey system dynamics, accomplished by ensur-ing that the derivative of the interpolatensur-ing polynomial defined in Eq. 3 is equal to the dynamics defined in Eq. 4 at each collocation point. Limits are also placed on the specific uptake and secretion rates at each collocation (3)
xj(τ )= ND
k=0
ℓk(τ )xjk
where ℓk(τ )= ND
n=0,n�=k τ−τn τk−τn
(4)
dxij dt =
1
hl dxij
dτ =ajkx0jkR yl
(5) max
X,Y,A,h
xp,NK(1)−xp,0(0) NK
j=0h(j)
.
point in accordance with biological measurements, and the sum of the fractional expression of each elementary mode for the given fermentation stage is constrained to unity.
Furthermore, the finite elements are constrained to be continuous:
Bounds are also placed on each of the optimization variables:
Finally, two additional constraints are imposed in order to avoid numerical instability and trivial solutions. The relative change in step size between fermentation modes is constrained to a factor of 10,
and the fermentation must consume at least 80% of the initial glucose:
Implementation
Metabolic models are specified using cobrapy [28]. EFMs for each metabolic model are calculated via efmtool [26]. All calculations were performed in Python, using the CasADi library [29] to implement the orthogonal collo-cation method. IPOPT [30] was used to solve the result-ing NLP problem.
Results and discussion
We demonstrate the usefulness of the method by calcu-lating the maximum theoretical productivities of suc-cinic acid from glucose for two organisms, E. coli and A. succinogenes. In a developing a DFBA model, we inte-grate knowledge of the core-carbon metabolic pathways present in the organism together with experimental data on biomass production and substrate uptake rates. An (6) forj∈ [0,NK]; k∈ [1,ND]:
hlajkx0jkR yl− ND
n=0
dℓn(τk) dτ xjn=0
vlb(xjk)≤ajkR yl≤vub(xjk) NR
m
ylm=1.
(7)
xj(1)−xj+1(0)=0 forj∈ [0,NK −1].
(8) 0 < X < 1000
0 < Y < 1 0 < A < ∞ 0.1 < h < 30
(9)
hmax hmin
≤10,
(10) xglcf
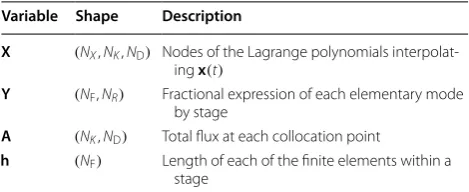
xglc0 ≤0.2. Table 2 Variable matrices optimized by nonlinear
pro-gramming
These matrices are flattened to a single parameter vector prior to being passed to IPOPT
Variable Shape Description
X (NX,NK,ND) Nodes of the Lagrange polynomials
interpolat-ing x(t)
Y (NF,NR) Fractional expression of each elementary mode
by stage
A (NK,ND) Total flux at each collocation point
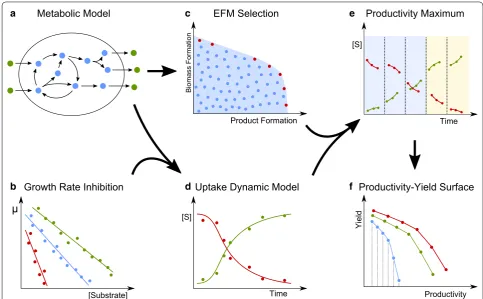
overview of the computational method is provided in Fig. 1.
Core‑carbon models of A. succinogenes and E. coli Actinobacillus succinogenes
A stoichiometric model of core-carbon metabolism in A. succinogenes was created based on genomic evidence and a previous metabolic reconstruction [31]. The model consists of 72 metabolites and 89 mass- and charge-bal-anced reactions. A reaction describing A. succinogenes cell growth was constructed from a number of experi-mental measurements. First, a biomass yield was calcu-lated from measured values of the specific growth rate and glucose uptake rate, 0.414 h−1 and 9.5 mmol, respec-tively [32]. As the models after reduction only map the input–output relationships of glucose to product, the internal details of the biomass function could be approxi-mated without introducing significant error into the method. The stoichiometry of precursor metabolites for biomass synthesis was therefore adapted from an E. coli core-carbon model [33], and scaled to match the known
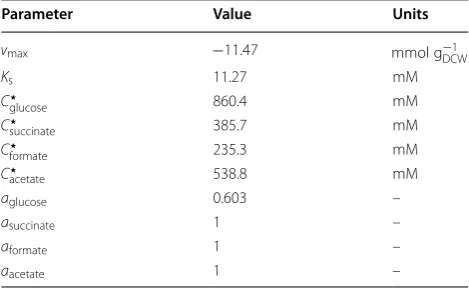
cell composition [34]. Energetic requirements of biomass synthesis, including ATP, NADH, and NADPH demand, were adapted from literature values to match the desired biomass yield [35]. A nongrowth-assisted maintenance value of 4.7 mmol g−1DCWh−1 was also enforced, which was determined from the value estimated by Lin and coworkers [36] by finding the amount of ATP that can be produced from 0.308 g of glucose. Dynamic constraints on substrate uptake were also imposed. Substrate and product inhibition on growth rate in A. succinogenes have previously been quantified with a Han–Levenspiel model [36]. Using the calculated biomass yield of 0.044 gDCW mmol−1 glucose−1, the experimentally determined parameters were converted to constraints on glucose uptake:
The parameters used in Eq. 11 are presented in Table 3. Additionally, the lower bound of the flux through
(11) vglc,min =
vmaxxglc
xglc+Ks
n
1− xn
C⋆ n
an . Metabolic Model
[Substrate]
Growth Rate Inhibition Uptake Dynamic Model
Product Formation
Biomass
Formation
EFM Selection
Time [S]
Time
Productivity Maximum
Yield
Productivity Productivity-Yield Surface
a c e
b d f
[S]
nongrowth-associated ATP maintenance was con-strained to the estimated value:
No oxygen uptake was allowed to simulate anaerobic growth.
Escherichia coli
A core-carbon model for E. coli central metabolism was taken from Orth et al. [33], which consists of 72 metab-olites and 94 reactions. Dynamic models for glucose uptake in E. coli typically assume Michaelis–Menten kinetics, in which high concentrations of glucose ulti-mately saturate the import mechanisms at their maxi-mum value [37–39]. However, this assumption leads to the erroneous result that maximum productivity is achieved at an infinite initial glucose concentration. Since no suitable literature model for substrate-level growth inhibition from the considered substrates could be found, glucose uptake kinetics were adapted from those used for A. succinogenes. Additional bounds on ATP maintenance and oxygen uptake were adapted from those determined by Feist and coworkers [40]:
Calculation and selection of elementary models for A. succinogenes and E. coli
Elementary flux modes were calculated to reduce the dimensionality of the optimization and to alleviate the necessity of enforcing stoichiometric equilibrium con-straints during the dynamic optimization. For A. succino-genes, 4763 EFMs were calculated for growth on glucose and normalized by the glucose uptake rate. After reduc-ing EFMs to the considered boundary species, duplicate EFMs were removed. The boundary species considered for A. succinogenes included biomass, ATP, glucose,
vatp,min=4.7.
vatp,min=8.39
vo2,min= −18.2.
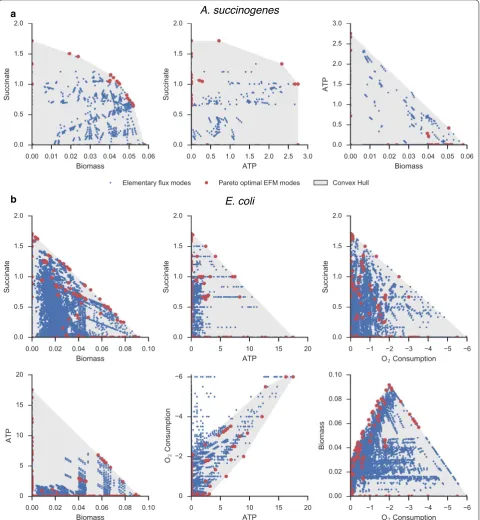
succinate, formate, acetate, and pyruvate. Since any fea-sible flux state can be expressed as a nonnegative com-bination of elementary flux modes, the flux space in the reduced dimensionality can be spanned without loss of generality by only those EFMs at the vertices of a convex hull. Furthermore, as optimal succinate productivity will be achieved using flux modes on the Pareto front of cell growth, ATP production, and succinate secretion, the reduced set of EFMs were further reduced to a final set of 22 Pareto-optimal modes. As EFMs are normalized by glucose consumption, glucose need not be explicitly included in the Pareto surface. For E. coli, the additional aerobic growth modes led to a total of 100,273 EFMs. The boundary species for E. coli were the same as those used for A. succinogenes, with the addition of oxygen and the omission of pyruvate, which was not found to be present in any optimal growth mode. In addition to biomass, ATP, and succinate production, the convex hull of opti-mal modes in E. coli must also consider oxygen consump-tion. After reduction, 137 modes were kept for E. coli.
The selected EFMs for each organism are shown in Fig. 2, which plots 2D slices of the 3D (A) and 4D (B) yield surfaces. In A. succinogenes, the chosen elementary modes can span the entirety of the yield space for the considered boundary species. In E. coli, modes that con-sume high amounts of oxygen while yielding low amounts of ATP are omitted by the algorithm, as they are unlikely to be utilized in the optimal productivity solution.
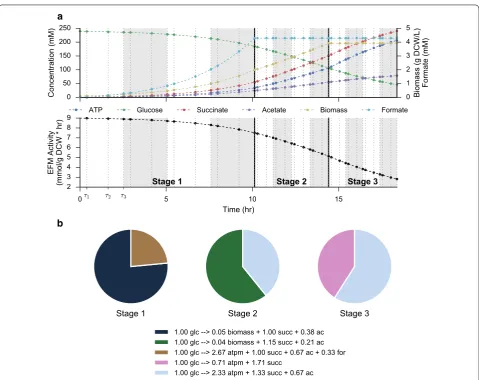
Orthogonal collocation
Optimum productivities are found via a dynamic optimi-zation framework. To further reduce the dimensionality of the optimization, and to allow the effects of discrete fermentation stages to be explicitly simulated, we divide the fermentation time into a number of discrete stages. Within each stage, fluxes are represented by a total flux profile through all elementary modes along with a frac-tional breakdown of flux through each elementary mode. An example optimum solution for maximum produc-tivity from a 3-stage fermentation in A. succinogenes is shown in Fig. 3. For clarity, this example uses only 4 finite elements per fermentation stage, while all other calculations use a minimum of 20 total finite elements evenly divided between stages. The figure demonstrates how the step sizes h are optimized to achieve the desired dynamic profile. Additionally, since EFMs are scaled by glucose uptake, the activity parameter smoothly tracks the maximum allowable uptake rate. ATP production is enforced at each collocation point by requiring that the flux through the ATP boundary reaction is greater than the nongrowth-associated maintenance require-ment. This constraint has the effect of requiring the cells to choose pathways that produce extra ATP for cellular Table 3 Parameters for the maximum specific glucose
uptake, adapted from values estimated by Lin et al. [36]
Parameter Value Units
vmax −11.47 mmol g−1DCW
Ks 11.27 mM
C⋆
glucose 860.4 mM
C⋆
succinate 385.7 mM
C⋆
formate 235.3 mM
C⋆
acetate 538.8 mM
aglucose 0.603 –
asuccinate 1 –
aformate 1 –
a
b
demands, instead of funneling all carbon towards bio-mass or product production. The selected EFMs in Fig. 3b demonstrate that optimal productivity is achieved by prioritizing cell growth early in the fermentation and succinate production in later stages. The elementary mode that represents the maximum theoretical yield for succinate on glucose, 1.71 mol succinate per mol glucose, is used only partially in the last fermentation stage, high-lighting that constraints on cell maintenance prohibit the system from achieving the maximum theoretical yield.
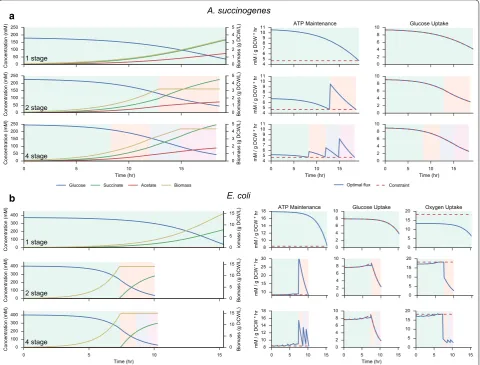
Effect of increasing the number of fermentation stages In addition to reducing the dimensionality of the prob-lem, splitting the fermentation time into discrete stages
with independent EFM expression allows a systematic investigation into the effect of stage count on maximum theoretical productivity. Relative flux ratios within each stage are fixed, and therefore represent consistent enzyme expression. Optimal productivities achieved for a varying number of fermentation stages are shown in Fig. 4 for A. succinogenes and E. coli. The right-hand side of Fig. 4 plots the dynamic constraints imposed on the solution, includ-ing ATP maintenance production rate, maximum glucose uptake rate, and the oxygen uptake rate (for E. coli). These constraints are normalized to specific uptake or produc-tion rates, and therefore ATP and oxygen uptake con-straints remain constant over the fermentation, while the glucose uptake varies based on external concentrations. In a
b
all cases, the solutions closely track the maximum allow-able glucose uptake rate. In A. succinogenes, the transition from one to two stages allows the cell to divide its succi-nate production strategy into separate growth and prod-uct formation stages. The addition of subsequent stages permits slightly higher productivities by the gradual tran-sition from growth to product formation. Additionally, as the flux ratios are fixed within each fermentation stage, the fraction of input carbon diverted to ATP production is also fixed. Thus, as lower extracellular glucose con-centrations result in lower glucose uptake rates, the cell must dynamically allocate a higher percentage of energy towards meeting its ATP maintenance requirement.
Higher numbers of stages therefore allow the cell to more efficiently meet the maintenance constraint, as demon-strated by lower excess ATP produced with additional stages.
In E. coli, maximum succinate production using a sin-gle stage is achieved microaerobically. With the addition of a second stage, the optimal fermentation time drops appreciably as succinate production is divided into an aerobic growth phase followed by a microaerobic pro-duction phase. The addition of further stages beyond two has little effect on either the succinate productivity or the concentration profiles, serving mainly to keep ATP pro-duction closer to the constrained minimum.
A. succinogenes
1 stage
2 stage
4 stage
E. coli
1 stage
2 stage
4 stage a
b
Pareto surfaces of yield versus productivity
While separate estimates of maximum theoretical yield and productivity can provide information on the eco-nomic feasibility of a bioprocess, in optimized settings one often cannot be increased without decreasing the other. We therefore show how the given method can be easily extended to calculate a full productivity–yield Pareto surface: the envelope in the multi-objective opti-mization on which productivity cannot be increased without sacrificing yield. The surface is found by first calculating the maximum productivity (Pmax, defined by Eq. 5) via the method described previously.
The nonlinear program is then solved again with yield as the objective,
in which xg represents the glucose concentration, while holding productivity constrained to a fraction of the maximum productivity,
Computational efficiency in the repeated optimizations is improved by using IPOPT’s warm solve method, which preserves the optimal solution as a starting guess for the next iteration.
Figure 5 plots the resulting yield–productivity sur-faces for 50 linearly spaced α values. By varying the number of allowed fermentation stages, these surfaces
max X,Y,A,h
xp,NK(1)−xp,0(0)
xg,0(0)−xg,NK(1) ,
xp(tf)−xp(t0) tf
−αPmax=0 forα∈ [0, 1].
reveal the performance gains which can be achieved by allowing additional metabolic flexibility. For A. succi-nogenes, higher yields can be obtained due to the lower specific ATP maintenance requirement. Addition-ally, as succinic acid is the naturally predominant fer-mentation product in A. succinogenes, high yields are obtained even at close to the maximum productivity. In E. coli, notable performance gains are achieved by moving to a 2-stage fermentation, as it enables effi-cient usage of aerobic growth modes. In both cases, moving beyond two distinct flux modes does not sub-stantially increase the yields or productivities that can be achieved.
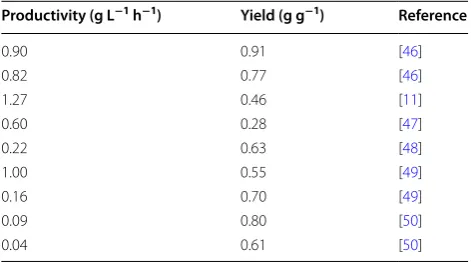
The calculated optimal surfaces are compared to data on succinate yield and productivity that have been achieved experimentally from both wild-type and engi-neered organisms, compiled in Tables 4 and 5. For con-sistency with the assumptions of the method, we limit the data to experimental values in batch cultures on grown on glucose without fed-batch operation or biomass recy-cling. The measured values of biomass yields and glucose uptake kinetics used in modeling vary from experiment to experiment, and thus the estimated productivity–yield surfaces include a degree of uncertainty. However, the data largely fall within the predicted envelope of single-stage processes, confirming the accuracy of the assump-tions made in each model. These results illustrate how the proposed method can be useful for guiding experi-mental effort: as wild-type A. succinogenes fermenta-tions naturally fall close to the optimal productivity–yield
surface, further genetic manipulation of this organism is unlikely to yield significantly improved performance. Similarly with E. coli, improving succinate productivity beyond the values previously recorded will likely require a two-stage process involving aerobic growth and anaero-bic succinate production.
Conclusions
This study represents a computationally efficient method for determining the maximum theoretical pro-ductivity for a batch culture system. As the fields of metabolic engineering and synthetic biology continue to develop techniques for the dynamic manipulation of metabolism, our methodology will enable experimental efforts to be focused on where the greatest improve-ments can be expected. While this study has focused on finding globally optimal solutions, future implemen-tations might search for optimal strategies using only
experimentally tractable EFM selections (i.e., ones that are growth-optimal for 1 or 2 gene knockouts). The method can also easily be generalized for conversion of multiple substrates as long as appropriate experimen-tal data exist to fit detailed models to substrate uptake kinetics. It could also be extended to explicitly optimize final titer instead or in addition to yield and productiv-ity. Overall, this work emphasizes the need for better empirical models of substrate and product exchange rates and growth kinetics in designing dynamic meta-bolic interventions.
Abbreviations
DFBA: dynamic flux balance analysis; FBA: flux balance analysis; EFMs: elemen-tary flux modes; ODE: ordinary differential equation; NLP: nonlinear program-ming; DCW: dry cell weight; ATP: adenosine triphosphate; NADH: nicotinamide adenine dinucleotide; NADPH: nicotinamide adenine dinucleotide phosphate.
Authors’ contributions
PSJ, YJB, and MFC designed the method and wrote the manuscript. PSJ performed all numerical experiments. All authors read and approved the final manuscript.
Acknowledgements
We thank Gregg Beckham for his careful review of the manuscript.
Competing interests
The authors declare that they have no competing interests.
Availability of supporting data
The datasets generated during and/or analyzed during the current study are available in the github repository, https://github.com/pstjohn/ productivity-maximization.
Funding
This work was funded by the US Department of Energy’s Bioenergy Technolo-gies Office (DOE-BETO), ContractNo. DE-AC36-08GO28308 with the National Renewable Energy Laboratory.
Received: 29 September 2016 Accepted: 12 January 2017
References
1. Davis R, Tao L. Tan ECD, Biddy MJ, Beckham GT, Scarlata C, Jacobson J, Cafferty K, Ross J, Lukas J, Knorr D, Schoen P. Process design and econom-ics for the conversion of lignocellulosic biomass to hydrocarbons: dilute-acid and enzymatic deconstruction of biomass to sugars and biological conversion of sugars to hydrocarbons. Technical Report NREL/TP-5100-60223. 2013. doi:10.2172/1107470.
2. Feist AM, Herrgård MJ, Thiele I, Reed JL, Palsson BØ. Reconstruction of bio-chemical networks in microorganisms. Nat Rev Microbiol. 2009;7(2):129– 43. doi:10.1038/nrmicro1949.
3. Holtz WJ, Keasling JD. Engineering static and dynamic control of syn-thetic pathways. Cell. 2010;140(1):19–23. doi:10.1016/j.cell.2009.12.029. 4. Burgard AP, Pharkya P, Maranas CD. Optknock: a bilevel programming
framework for identifying gene knockout strategies for microbial strain optimization. Biotechnol Bioeng. 2003;84(6):647–57. doi:10.1002/ bit.10803.
5. Ranganathan S, Suthers PF, Maranas CD. Optforce: an optimization procedure for identifying all genetic manipulations leading to targeted overproductions. Plos Comput Biol. 2010;6(4):1000744. doi: 10.1371/jour-nal.pcbi.1000744.
Table 4 Literature data for productivity and yield achieved in A. succinogenes batch fermentations
Productivity (g L−1 h−1) Yield (g g−1) Reference
1.18 0.82 [41]
0.71 0.77 [41]
0.49 0.60 [41]
0.67 0.77 [41]
0.76 0.70 [41]
0.63 0.61 [41]
0.46 0.69 [42]
0.72 0.72 [42]
0.71 0.61 [42]
0.87 0.65 [42]
0.55 0.76 [43]
1.34 0.80 [43]
0.66 0.79 [44]
0.75 0.76 [45]
Table 5 Literature data for productivity and yield achieved in E. coli batch fermentations
Productivity (g L−1 h−1) Yield (g g−1) Reference
0.90 0.91 [46]
0.82 0.77 [46]
1.27 0.46 [11]
0.60 0.28 [47]
0.22 0.63 [48]
1.00 0.55 [49]
0.16 0.70 [49]
0.09 0.80 [50]
6. Zhuang K, Yang L, Cluett WR, Mahadevan R. Dynamic strain scanning optimization: an efficient strain design strategy for balanced yield, titer, and productivity. DySScO strategy for strain design. BMC Biotechnol. 2013;13(1):8. doi:10.1186/1472-6750-13-8.
7. Hanly TJ, Henson MA. Dynamic metabolic modeling of a microaero-bic yeast co-culture: predicting and optimizing ethanol production from glucose/xylose mixtures. Biotechnol Biofuels. 2013;6(1):44. doi:10.1186/1754-6834-6-44.
8. Ruckerbauer DE, Jungreuthmayer C, Zanghellini JUR. Design of optimally constructed metabolic networks of minimal functionality. PLoS ONE. 2014;9(3):e92583. doi:10.1371/journal.pone.0092583.
9. Venayak N, Anesiadis N, Cluett WR, Mahadevan R. Engineering metabo-lism through dynamic control. Curr Opin Biotechnol. 2015;34:142–52. doi:10.1016/j.copbio.2014.12.022.
10. Vemuri GN, Eiteman MA, Altman E. Succinate production in dual-phase
Escherichia coli fermentations depends on the time of transition from aer-obic to anaeraer-obic conditions. J Ind Microbiol Biotechnol. 2002;28(6):325– 32. doi:10.1038/sj.jim.7000250.
11. Andersson C, Hodge D, Berglund KA, Rova U. Effect of different carbon sources on the production of succinic acid using metabolically engi-neered Escherichia coli. Biotechnol Progr. 2007;23(2):381–8. doi:10.1021/
bp060301y.
12. Soma Y, Tsuruno K, Wada M, Yokota A, Hanai T. Metabolic flux redirection from a central metabolic pathway toward a synthetic pathway using a metabolic toggle switch. Metab Eng. 2014;23:175–84. doi:10.1016/j. ymben.2014.02.008.
13. Valdez-Cruz NA, Caspeta L, Pérez NO, Ramírez OT, Trujillo-Roldán MA. Production of recombinant proteins in E. coli by the heat inducible expression system based on the phage lambda pl and/or pr promoters. Microb Cell Fact. 2010;9(1):1. doi:10.1186/1475-2859-9-18.
14. Gadkar KG, Doyle FJ III, Edwards JS, Mahadevan R. Estimating optimal profiles of genetic alterations using constraint-based models. Biotechnol Bioeng. 2004;89(2):243–51. doi:10.1002/bit.20349.
15. Anesiadis N, Cluett WR, Mahadevan R. Dynamic metabolic engineering for increasing bioprocess productivity. Metab Eng. 2008;10(5):255–66. doi:10.1016/j.ymben.2008.06.004.
16. Segre D, Vitkup D, Church GM. Analysis of optimality in natural and per-turbed metabolic networks. Proc Natl Acad Sci USA. 2002;99(23):15112–7. doi:10.1073/pnas.232349399.
17. Shlomi T, Berkman O, Ruppin E. Regulatory on/off minimization of meta-bolic flux changes after genetic perturbations. Proc Natl Acad Sci USA. 2005;102(21):7695–700. doi:10.1073/pnas.0406346102.
18. Biegler LT. An overview of simultaneous strategies for dynamic optimization. Chem Eng Process. 2007;46(11):1043–53. doi:10.1016/j. cep.2006.06.021.
19. Mahadevan R, Edwards JS, Doyle FJ III. Dynamic flux balance analysis of diauxic growth in Escherichia coli. Biophys J. 2002;83(3):1331–40. doi:10.1016/S0006-3495(02)73903-9.
20. Hjersted JL, Henson MA. Optimization of fed-batch Saccharomyces cerevi-siae fermentation using dynamic flux balance models. Biotechnol Progr. 2006;22(5):1239–48. doi:10.1021/bp060059v.
21. Schuster S, Dandekar T, Fell DA. Detection of elementary flux modes in biochemical networks: a promising tool for pathway analysis and metabolic engineering. Trends Biotechnol. 1999;17(2):53–60. doi:10.1016/ s0167-7799(98)01290-6.
22. Song H-S, Ramkrishna D. Reduction of a set of elementary modes using yield analysis. Biotechnol Bioeng. 2009;102(2):554–68. doi:10.1002/ bit.22062.
23. Song H, Lee SY. Production of succinic acid by bacterial fermen-tation. Enzyme Microb Tech. 2006;39(3):352–61. doi:10.1016/j. enzmictec.2005.11.043.
24. Höffner K, Harwood SM, Barton PI. A reliable simulator for dynamic flux balance analysis. Biotechnol Bioeng. 2012;110(3):792–802. doi:10.1002/ bit.24748.
25. Jevremovic D, Trinh CT, Srienc F, Boley D. On algebraic properties of extreme pathways in metabolic networks. J Comput Biol. 2010;17(2):107– 19. doi:10.1089/cmb.2009.0020.
26. Terzer M, Stelling J. Large-scale computation of elementary flux modes with bit pattern trees. Method Biochem Anal. 2008;24(19):2229–35. doi:10.1093/bioinformatics/btn401.
27. Biegler LT. Nonlinear Programming. doi:10.1137/1.9780898719383.ch10.
28. Ebrahim A, Lerman JA, Palsson BØ, Hyduke DR. Cobrapy: constraints-based reconstruction and analysis for python. BMC Syst Biol. 2013;7(1):74. doi:10.1186/1752-0509-7-74.
29. Andersson J. A general-purpose software framework for dynamic optimi-zation. Arenberg Doctoral School; 2013.
30. Wächter A, Biegler LT. On the implementation of an interior-point filter line-search algorithm for large-scale nonlinear programming. Math Progr. 2005;106(1):25–57. doi:10.1007/s10107-004-0559-y.
31. McKinlay JB, Laivenieks M, Schindler BD, McKinlay AA, Siddaramappa S, Challacombe JF, Lowry SR, Clum A, Lapidus AL, Burkhart KB, Harkins V, Vieille C. A genomic perspective on the potential of Actinobacillus succi-nogenes for industrial succinate production. BMC Genom. 2010;11(1):680. doi:10.1186/1471-2164-11-680.
32. McKinlay JB, Zeikus JG, Vieille C. Insights into Actinobacillus suc-cinogenes fermentative metabolism in a chemically defined growth medium. Appl Environ Microb. 2005;71(11):6651–6. doi:10.1128/ AEM.71.11.6651-6656.2005.
33. Orth JD, Fleming RMT, Palsson BØ. Reconstruction and use of microbial metabolic networks: the core Escherichia coli metabolic model as an educational guide. EcoSal Plus. 2010; 4. doi:10.1128/ecosalplus.10.2.1. 34. der Werf MJV, Guettler MV, Jain MK, Zeikus JG. Environmental and
physi-ological factors affecting the succinate product ratio during carbohydrate fermentation by Actinobacillus sp. 130z. Arch Microbiol. 1997;167(6):332– 42. doi:10.1007/s002030050452.
35. McKinlay JB, Shachar-Hill Y, Zeikus JG, Vieille C. Determining Actinobacil-lus succinogenes metabolic pathways and fluxes by nmr and gc-ms analyses of 13c-labeled metabolic product isotopomers. Metab Eng. 2007;9(2):177–92. doi:10.1016/j.ymben.2006.10.006.
36. Lin SKC, Du C, Koutinas A, Wang R, Webb C. Substrate and product inhibi-tion kinetics in succinic acid producinhibi-tion by Actinobacillus succinogenes. Biochem Eng J. 2008;41(2):128–35. doi:10.1016/j.bej.2008.03.013. 37. Hanly TJ, Urello M, Henson MA. Dynamic flux balance modeling of S.
cer-evisiae and E. coli co-cultures for efficient consumption of glucose/xylose mixtures. Appl Microbiol Biotechnol. 2011;93(6):2529–41. doi:10.1007/ s00253-011-3628-1.
38. Song H-S, Ramkrishna D. Cybernetic models based on lumped elemen-tary modes accurately predict strain-specific metabolic function. Biotech-nol Bioeng. 2010;108(1):127–40. doi:10.1002/bit.22922.
39. Harwood SM, Höffner K, Barton PI. Efficient solution of ordinary differen-tial equations with a parametric lexicographic linear program embedded. Numer Math. 2015. doi:10.1007/s00211-015-0760-3.
40. Feist AM, Henry CS, Reed JL, Krummenacker M, Joyce AR, Karp PD, Broadbelt LJ, Hatzimanikatis V, Palsson B. A genome-scale metabolic reconstruction for Escherichia coli K-12 MG1655 that accounts for 1260 ORFs and thermodynamic information. Mol Syst Biol. 2007;3(121):121. doi:10.1038/msb4100155.
41. Li J, Jiang M, Chen KQ, Ye Q, Shang LA, Wei P. Effect of redox potential reg-ulation on succinic acid production by Actinobacillus succinogenes. Bio-process Biosyst Eng. 2010;33(8):911–20. doi:10.1007/s00449-010-0414-x. 42. Salvachúa D, Mohagheghi A, Smith H, Bradfield MFA, Nicol W, Black
BA, Biddy MJ, Dowe N, Beckham GT. Succinic acid production on xylose-enriched biorefinery streams by Actinobacillus succinogenes in batch fermentation. Biotechnol Biofuels. 2016;9(1):121. doi:10.1186/ s13068-016-0425-1.
43. Guettler MV, Jain MK, Rumler D. Method for making succinic acid, bacte-rial variants for use in the process, and methods for obtaining variants. US5573931 A. 1996.
44. Liu YP, Zheng P, Sun ZH, Ni Y, Dong JJ, Zhu LL. Economical succinic acid production from cane molasses by Actinobacillus succinogenes. Bioresour Technol. 2008;99(6):1736–42. doi:10.1016/j.biortech.2007.03.044. 45. Xi YL, Chen KQ, Dai WY, Ma JF, Zhang M, Jiang M, Wei P, Ouyang PK.
Suc-cinic acid production by Actinobacillus succinogenes nj113 using corn steep liquor powder as nitrogen source. Bioresour Technol. 2013;136:775– 9. doi:10.1016/j.biortech.2013.03.107.
46. Jantama K, Haupt MJ, Svoronos SA, Zhang X, Moore JC, Shanmugam KT, Ingram LO. Combining metabolic engineering and metabolic evolution to develop nonrecombinant strains of Escherichia coli C that produce succinate and malate. Biotechnol Bioeng. 2008;99(5):1140–53. doi:10.1002/bit.21694. 47. Millard CS, Chao YP, Liao JC, Donnelly MI. Enhanced production of
suc-cinic acid by overexpression of phosphoenolpyruvate carboxylase in
• We accept pre-submission inquiries
• Our selector tool helps you to find the most relevant journal
• We provide round the clock customer support
• Convenient online submission
• Thorough peer review
• Inclusion in PubMed and all major indexing services
• Maximum visibility for your research
Submit your manuscript at www.biomedcentral.com/submit
Submit your next manuscript to BioMed Central
and we will help you at every step:
48. Stols L, Donnelly MI. Production of succinic acid through overexpression of NAD(+)-dependent malic enzyme in an Escherichia coli mutant. Appl Environ Microb. 1997;63(7):2695–701.
49. Lin H, Bennett GN, San K-Y. Metabolic engineering of aerobic succinate production systems in Escherichia coli to improve process productiv-ity and achieve the maximum theoretical succinate yield. Metab Eng. 2005;7(2):116–27. doi:10.1016/j.ymben.2004.10.003.